Information + science
When I was Chief Technology Officer of AnswerDash, the startup I co-founded to help answer people’s questions on websites, one of my primary jobs was to help our sales team sell. One of our company’s biggest opportunities was to sell to a large telecommunications company that fielded hundreds of thousands of phone calls each month about billing. Each one of those phone calls cost anywhere from $5-50 each, because they took at least one customer support staff time to answer. The company was enticed by our product, because it might help their customers get answers to billing questions on the website itself, potentially saving them millions in support costs (by laying off customer support staff). They agreed to a pilot launch, we passed their security audit, and we helped them write content for our service to ensure people could find helpful answers. They agreed to run a one month A/B test, comparing calls in the month during the pilot to the months before and after our service was added.
After the pilot month, we had the results: we had reduced their call volume by about 5%, saving them tens of thousands of calls each month. We were overjoyed! But when we talked to their internal data scientist, he didn’t believe the results. He wanted to know more about how we had gathered our data, how we had cleaned it, and how we had analyzed it. We shared our methods with him, and they agreed to run another pilot, this time using their own A/B testing infrastructure. Again, they received the same results: a 5% reduction. We met again and make the hard sell that our product was the cause of the two reductions, but he was still skeptical of the results, and recommended the company pass on our service. We learned later that this data scientist had been wrong a few times before, and needed to not be wrong again, and so despite our successful results, his need to maintain his reputation internally as a trusted source of truth trumped our seemingly positive results.
This story is an example of applied data sciencedata science: Using data and code to answer questions. in industry, and it’s reflective of the broader challenges of data science in both academia, industry, and government. How do we use data to answer questions and to make decisions? How do we address issues of bias and trust? And how do we communicate what we learn in a way that not only persuades, but acknowledges the many limitations of data in modeling the world?
Science
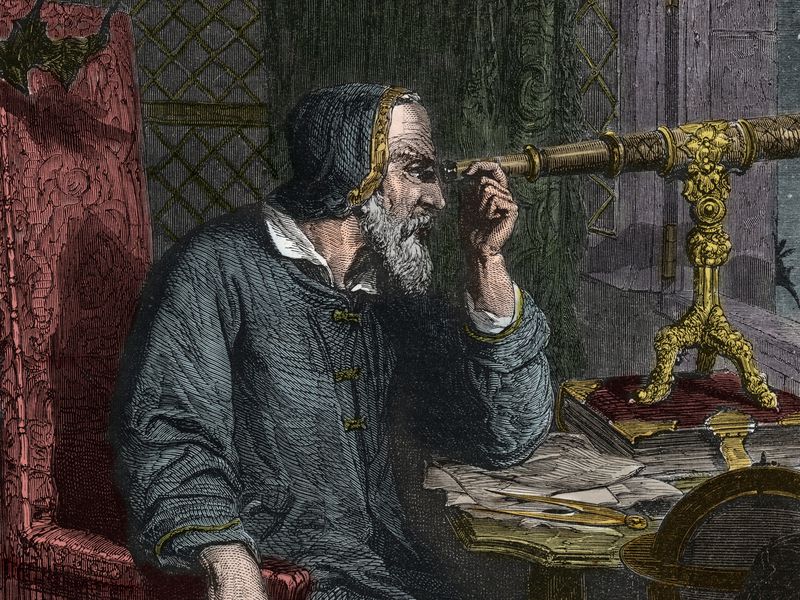
Long before there was data science, there was science, emerging in the 16th century in Europe. And at the core of science was the central question: how can we answer questions ? Questions such as “ Why do things fall after we throw them up in the air? ”, “ What is at the bottom of the ocean? ”, or “ Where do species come from? ” Prior to science, questions like these were most often answered either through the kinds of logical argumentation of philosophers and mathematicians, the kinds of interpretative and humanist traditions in the humanities, and, of course, religion. What science brought was method: strategies for observation and measurement of the natural and social world, techniques for analyzing data, and practices for interpreting and synthesizing data into ever better theories that explain how the world works. The result of this new epistemology of knowledge was a revolution in how humanity stumbles its way toward truth through evidence and paradigm shifts 7 .
Science and its methods evolved over centuries, shaping not only our knowledge, but our practical application of knowledge, driving innovations in engineering and industry 12 . But in 1962, John W. Tukey, an American mathematician and statistician, wrote The Future of Data Analysis 15 , where he imagined in a future in which computers might enable a speed and scale of data analysis that might transform how data is analyzed and who analyzes it:
Most data analysis is going to be done by people who are not sophisticated data analysts and who have very limited time; if you do not provide them tools the data will be even less studied. Properly automated tools are the easiest to use for a man with a computer.
He imagined algorithms that would automate statistical computations and even algorithms that would render data visualizations, freeing analysts from having to calculate them manually. At the same time, he warned that such automation would create even greater need for theory, to help guide analysts, less they mindlessly and recklessly search for patterns in data, only to find spurious associations with no meaning.
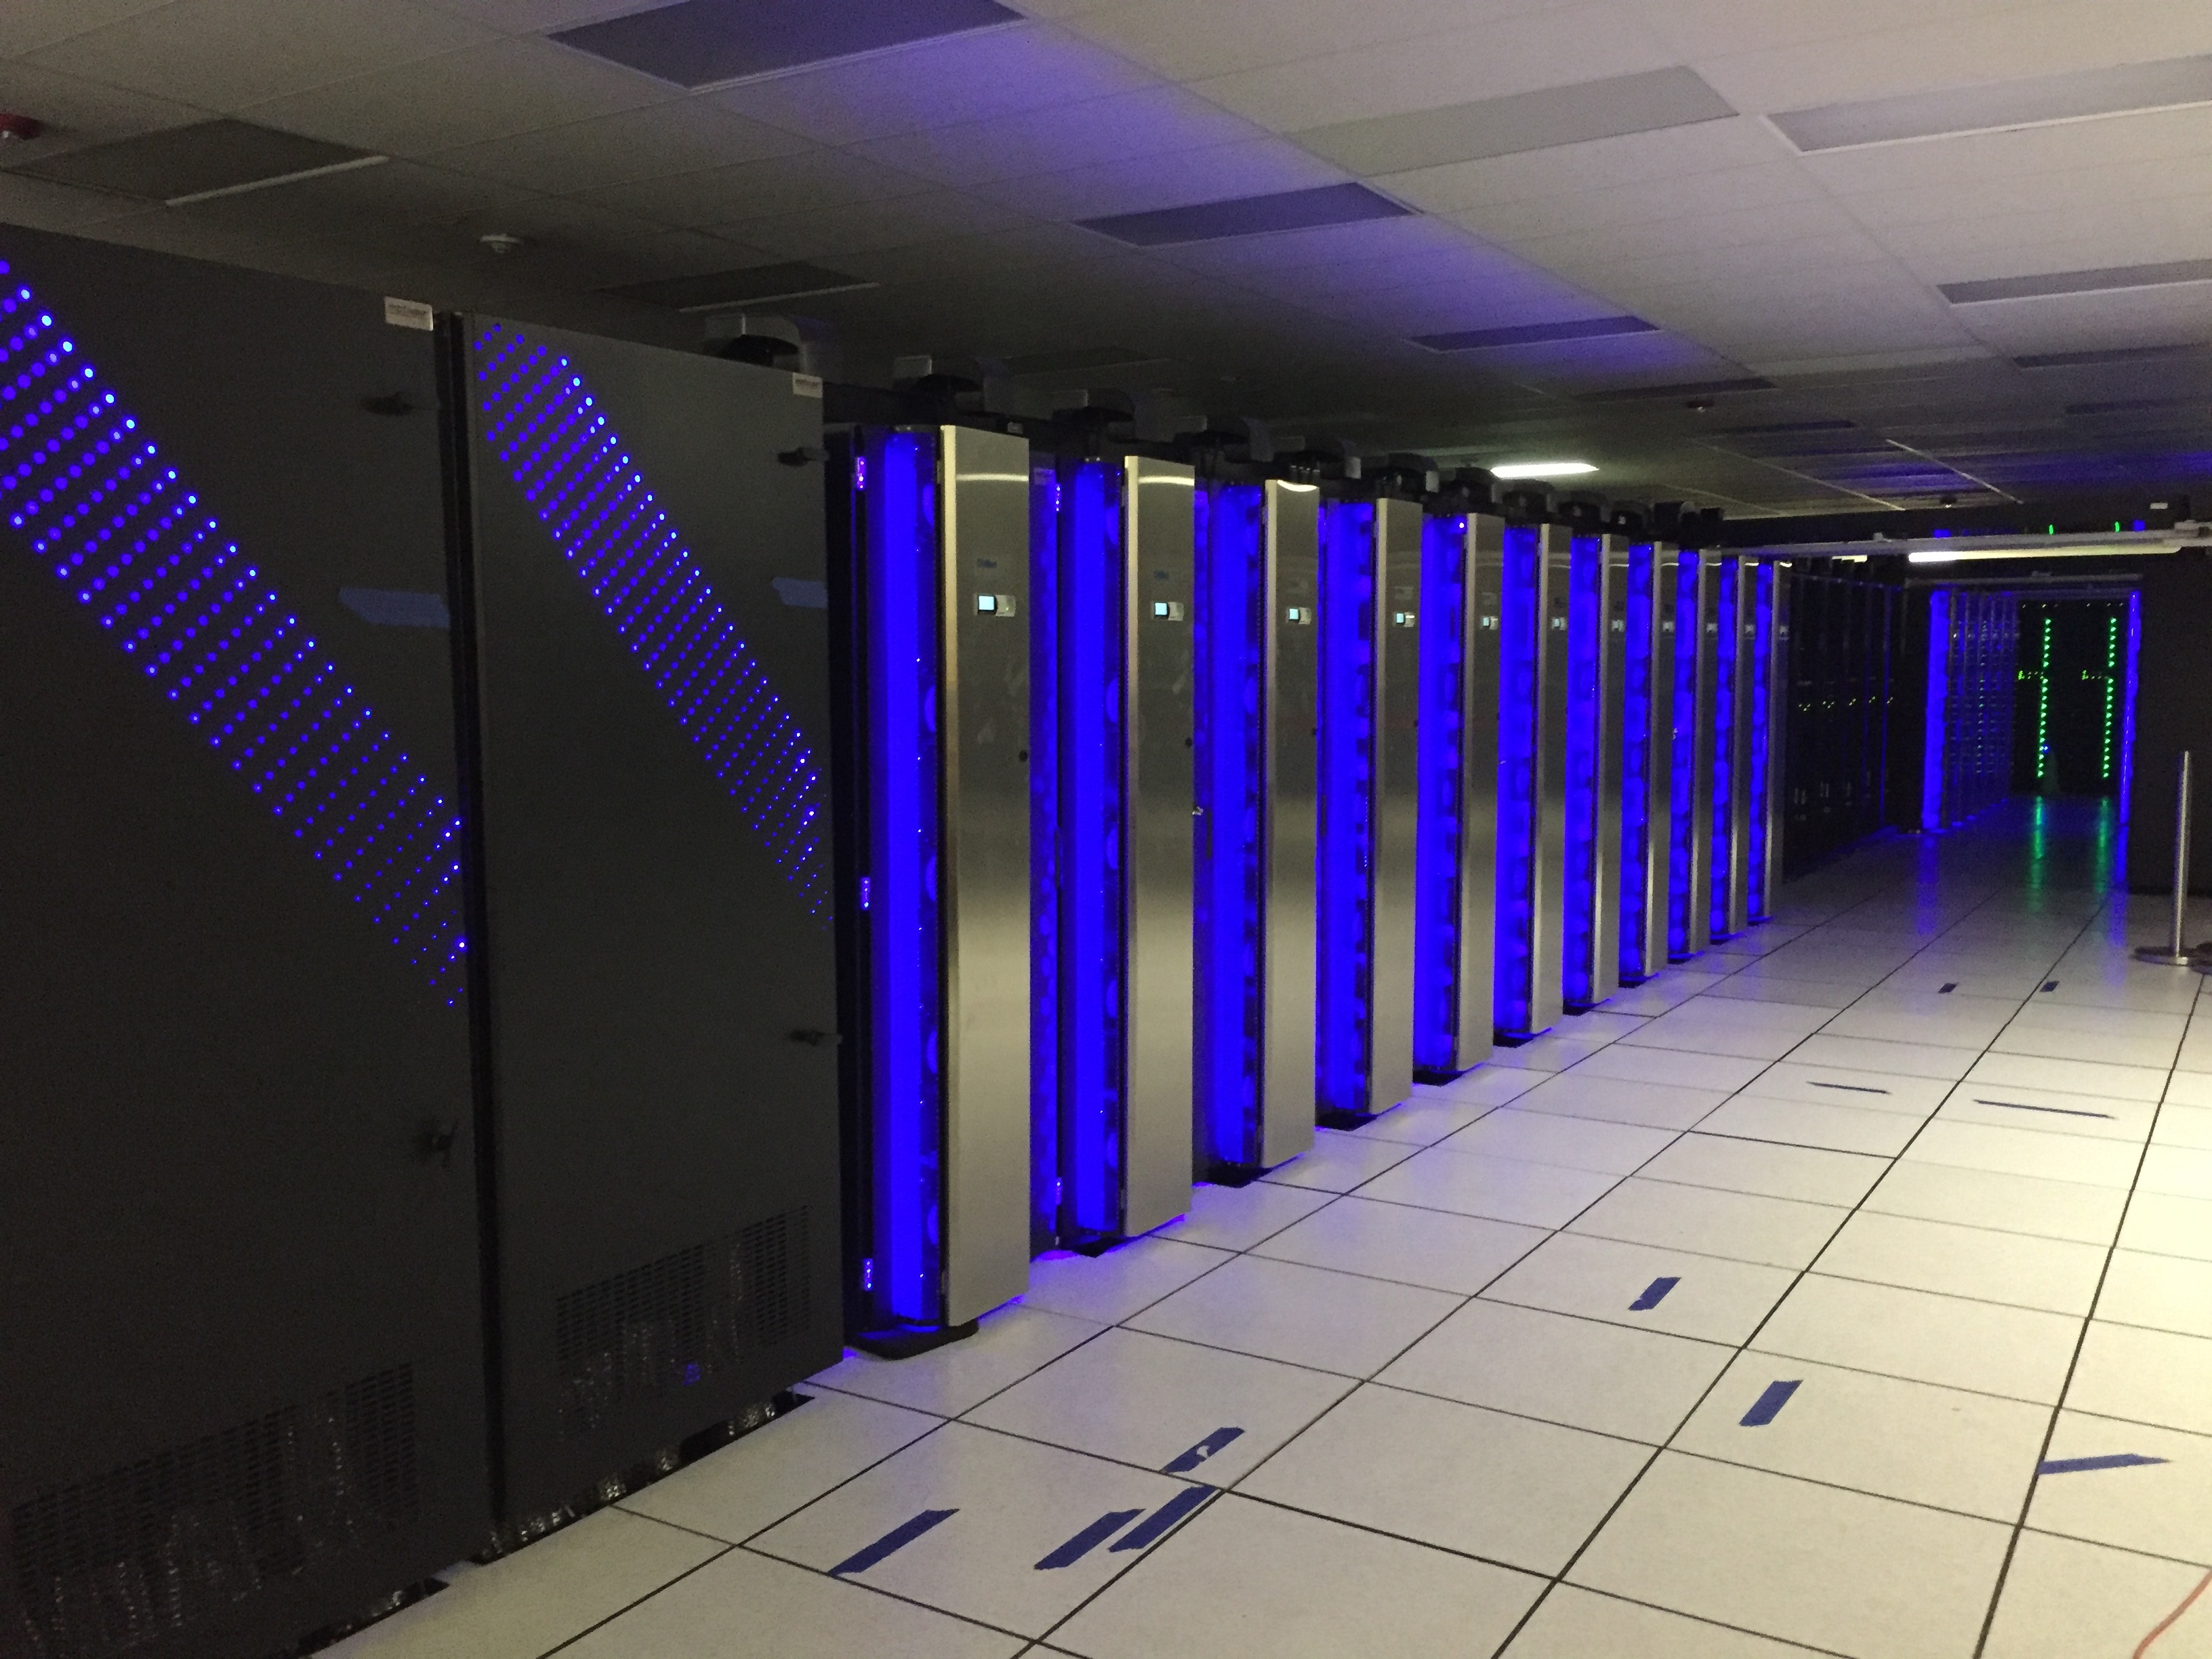
Only a few decades later, his predictions came to pass in science, as computing transformed science 8 . Scientists began using sensors to automatically gather large scale data about the climate. In partnership with computer scientists, they began inventing database systems capable of storing hundreds of millions of data points. The scale of data required new methods of automated analysis, facilitated by both advances in statistical methods such as machine learning, as well as advances in computer hardware and algorithms, enabling the first supercomputers to process large scale data in real time. Programming languages like R , created by and for statisticians to analyze data automatically, began to replace manual calculation on data, facilitating analysis at scale. And new automated forms of data visualization emerged to enable scientists to explore their data to generate hypotheses, but also to summarize it in scientific journals. By the late 1990’s, science had changed, becoming inherently computational, though at its core, its endeavor remained the same: gather data, test hypothesis, develop theories, but do so with more data and speed than ever before. But it was also more sociotechnical than ever, balancing the inherently human aspects of science with increasingly technical infrastructure 11 .
The result of this multi-decade transformation was a general understanding of analysis as a pipeline :
- Pose a question that can be answered with data. For example, an immunologists might want to know “ How effective are SARS-CoV-2 vaccines for children? ” This has remained relatively unchanged by computation and statistics, as data and algorithms alone cannot tell us what questions are novel, important, and feasible to answer.
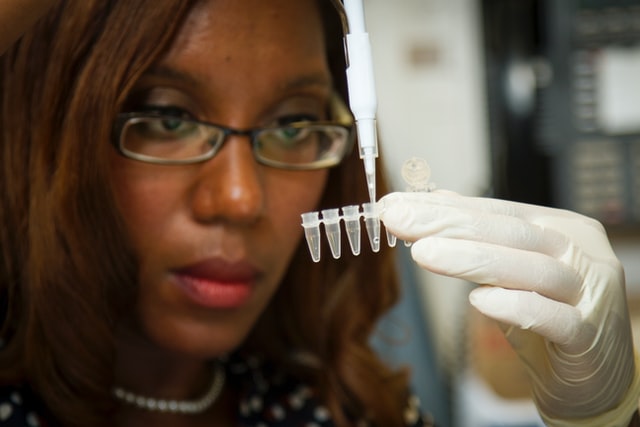
- Define measurements of the phenomena in the question. While this is still largely something that data and algorithms cannot change, they did change what kinds of measurements are possible. For example, computing was central to enabling DNA sequencing, which has been critical in precise measurement of viral antibodies 14 .
- Gather data . Computing transformed this by automating measurement and storage in many domains, allowing sensors of many kinds to gather and record data at scale without human labor. For example, oceanographers can now deploy extensive cables and sensors on the coastal ocean floor to monitor submarine volcanic activity, methane plumes, salinity, and the effects of climate change from their offices 13 .
- Explore the data . Computing transformed this step by allowing it to be quickly queried, summarized, and visualized, helping scientists see patterns, form hypothesis, and plan analyses. For example, R packages like ggplot2 enabled scientists to quickly visualize sampled data, build upon some of the earliest data visualizations in the 18th and 19th century, which helped diagnose cholera outbreaks in London.
- Analyze the data . Computing transformed this step by allowing programs to automatically clean, restructure, query, and statistically analyze data at scale, rather than calculating statistics by hand or by entering data tables into statistics packages. Libraries like Pandas for Python emerged making it easier to write short but powerful programs for processing data; libraries like mlr3 emerged to simplify the application of machine learning to problems of prediction, classification, and clustering.
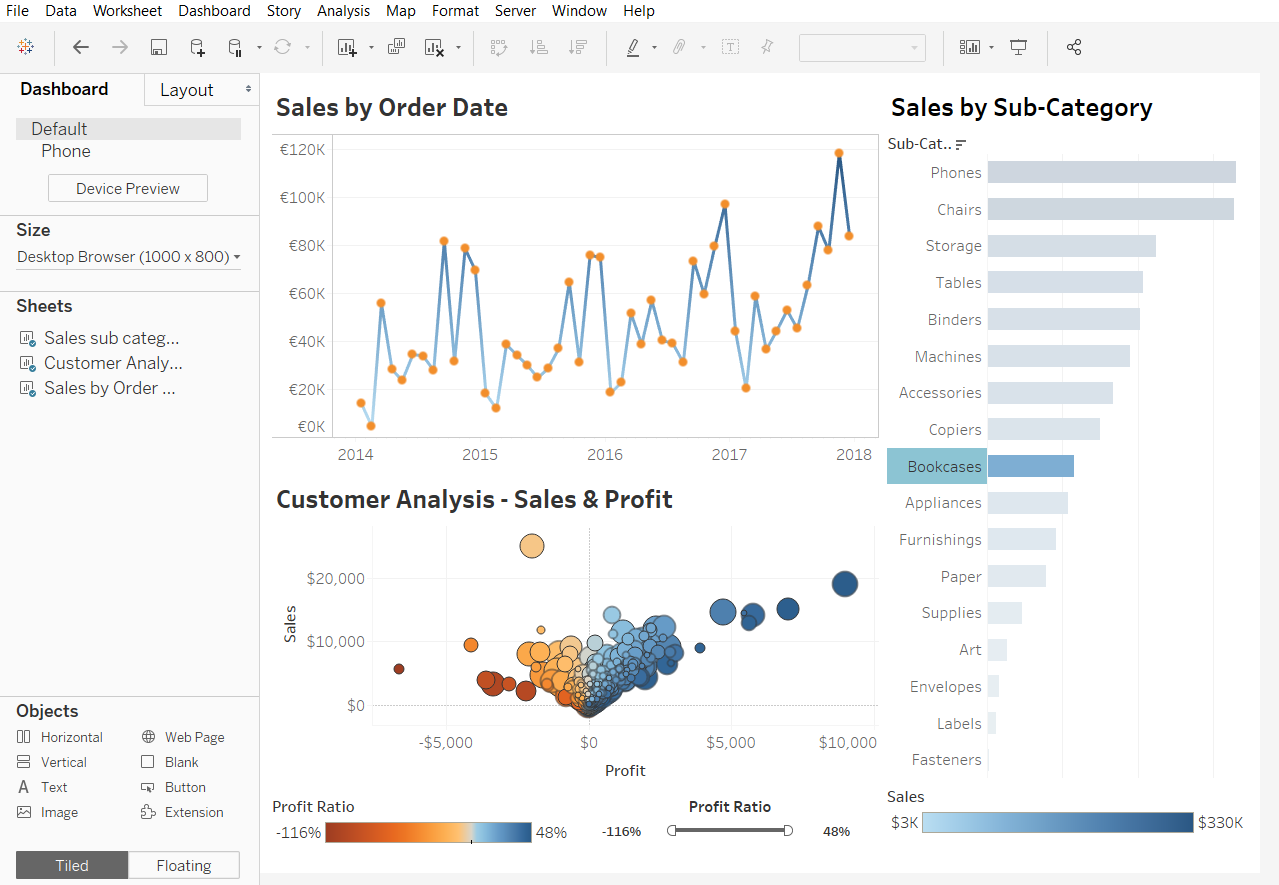
- Report results . As with exploration, computing made it possible to automatically generate summaries, visualizations, and reports for scientists, whether for a research paper, presentation, or internal discussion. Tools like Tableau emerged to help streamline the creation of visualizations and reports.
- Interpret results . As with posing questions and defining measurements, interpretation remained untouched by computing and statistics, as scientists still needed to make sense of results and integrate them into broader theories and bodies of evidence.

Underlying this pipeline were two long-standing challenges. The first, how to ask good questions and interpret the answers , have always been at the heart of not only science, but scholarship in general. Computing has left those challenges unchanged. But the second had always been there, but was never seriously engaged: when is it ethical to gather and analyze data ? Computing had a strong impact on this question, as it was enabling observation in ways never before possible, at scales never before possible. By amplifying and automating how data was used to answer questions, it raised new ethical concerns about data and its inherent biases. Some of the critical concerns include 3 :
- Whoever gathers the data decides what knowledge we discover; what if most of the data gathered is by industry, with no public control over what is gathered?
- Will the scale of data lead people to falsely believe in its objectivity? Data has bias and scale cannot correct its inaccuracies or biases.
- Will the quantity of data become more important than its quality? In science, sometimes small data sets with high quality data are more valuable than large data sets with poor quality.
- What meaning is lost when big data is taken out of context? Especially when that context might not be gathered as metadata?
- When is it unethical to gather data at scale? Issues of consent, sampling bias, and harm still matter, even when data collection is automated.
- Who gets access to data, especially if it is gathered privately? Science is practiced in public, and private data risks creating digital divides.
Scholars have further worried that all of the phases of data science above, when done without awareness of the deep, structural, and historical inequities in society, might only reinforce those inequities 4 . They might pose questions only of importance to dominant groups, they might gather data in ways that exclude marginalized groups, they might analyze data in ways that ignore the margins society, and they might visualize, report, and interpret data in ways that are ignorant of marginalized experiences. Computing and statistics might then become another tool for oppression.
Industry
It wasn’t until the early 2000’s that industry, with its emerging realization of the power of information for informing decisions, that the phrase data sciencedata science: Using data and code to answer questions. emerged. DJ Patil, an executive at LinkedIn who was doing a lot of data analysis of user engagement, was talking a lot with Jeff Hammerbacher , who was on Facebook’s data team doing the same thing. They didn’t want to call themselves “analysts,” because that was a word too often associated with finance; they didn’t like the term “research scientist” or “statistician”, since those were associated with academia. And so after brainstorming some job titles, they came up with “data scientist.” It stuck, and was just provocative and vague enough that industry executives started realizing that the applied science that Silicon Valley was doing to understand user activity on their websites was something that all companies could be doing with their own data.
Of course, in essence, “data science” was not substantially different from science. There were still questions, but they concerned questions of capitalism, such as “ Who is visiting our site? ”, “ Why are people leaving our site? ”, and “ What is driving sales? ” Conceptually, measurement was no different, but measurements tended to be about web server logs, sales transactions, and advertising campaigns. Data storage was often more demanding, since commerce tends to operate at a greater scale then science, but database technologies worked equally well in both domains. The techniques for data analysis were no different, drawing upon the same statistical and computational methods of science. And the tools were the same, drawing upon R, Python, machine learning libraries, and data visualization toolkits.
There were three differences, however:
- Industry typically has far less time than science. Where scientists might take decades to identify a high certainty answer to a big unanswered question, data scientists in industry might need a (necessarily low certainty) answer in a day, a week, or a month.
- Unlike science, which answers questions for the sake of understanding, industry answers questions to inform decisions . This introduces risks of bias and persuasion, as data might be more likely to be abused in industry to secure a promotion or increase sales.
- Unlike science, where the people using data to do science might have at least 5-6 years of training in a Ph.D., and communicate primarily with people with similar levels of training, data scientists in industry might lack similar expertise , and be communicating with people with little scientific literacy.
The result of these three differences was industry, as well as government, began to push for more training of data scientists. In essence, these efforts distilled the core expertise that scientists had developed in combining computing and statistics into knowledge that undergraduate or masters students have. While that educational infrastructure has grown, many of the data scientists hired in industry have been people with Ph.D.s that did not find or did not want a job in academia.
As data science has expanded in industry, the roles that data scientists take have been woven through business and government. Some data scientists inform managers’ strategic decisions with new insights; some specializing in modeling for real-time prediction to inform prioritization of tasks; some build robust platforms for data collection; and some manage teams of data scientists to do these things 6 . Others specialize in the unique challenges of leveraging machine learning, including managing and versioning data and calibrating and tuning machine learned models 1 . Data scientists in industry, unlike scientists, often find that they have to model data in ways that balance precision with simplicity, in order to communicate insights in ways that are relevant and comprehensible to people in their organization that lack data science expertise 5 .

Industry, like academia, is also beginning to grapple with the risks of bias and oppression in large scale data gathering and analysis. An increasing number of both scholars and industry experts have raised concerns about how data is being used to reinforce and amplify oppression of marginalized groups 2,4,9,10 . Data scientists, often having never received education about issues of justice, bias, and ethics, resist these calls, arguing that data is neutral. And controversies, like the firing of AI Ethics expert Timnit Gebru at Google, demonstrate that the role of ethics in data and data science in industry is far from a settled one.
Ultimately, the transformation of science and industry, first through statistics, and then through computation, are transformations about information: where it comes from, how we create it, what it means, and whether we trust it. The disruptive nature of computation is changing the answers to these questions, but it is not changing the questions themselves. Universities, as a nexus of both data-driven science, as well as data science education, are at the heart of shaping whether the answers to these questions are purely technical in nature, or sociotechnical and sociopolitical.
Podcasts
Interested in learning more about science and data science? Consider these podcasts:
- Florence Nightingale: Data Viz Pioneer, 99% Invisible|https://99percentinvisible.org/episode/florence-nightingale-data-viz-pioneer/]. Discusses the founder of modern nursing, Florence Nightingale, who also happened to be a pioneer in data visualization of public health data.
- Scientists Are Hunting For Alien Worlds Outside Our Solar System, Are We There Yet?, NPR . Discusses efforts to detect life in other solar systems using data.
- CRISPR, Radiolab, WYNC . Discusses technology for editing DNA, and the many complex implications of treating DNA as data.
References
-
Saleema Amershi, Andrew Begel, Christian Bird, Robert DeLine, Harald Gall, Ece Kamar, Nachiappan Nagappan, Besmira Nushi, and Thomas Zimmermann (2019). Software engineering for machine learning: A case study. International Conference on Software Engineering: Software Engineering in Practice.
-
Ruha Benjamin (2019). Race after technology: Abolitionist tools for the new jim code. Social Forces.
-
danah boyd, Kate Crawford (2012). Critical questions for big data: Provocations for a cultural, technological, and scholarly phenomenon. Information, Communication & Society.
-
Catherine D'Ignazio, Lauren F. Klein (2020). Data Feminism. MIT Press.
-
Fred Hohman, Andrew Head, Rich Caruana, Robert DeLine, and Steven M. Drucker (2019). Gamut: A Design Probe to Understand How Data Scientists Understand Machine Learning Models. ACM Conference on Human Factors in Computing Systems.
-
Miryung Kim, Thomas Zimmermann, Robert DeLine, and Andrew Begel (2016). The emerging role of data scientists on software development teams. IEEE/ACM International Conference on Software Engineering.
-
Thomas S. Kuhn (2012). The structure of scientific revolutions. University of Chicago Press.
-
Charlotte P. Lee, Paul Dourish, and Gloria Mark (2006). The human infrastructure of cyberinfrastructure. ACM Conference on Computer Supported Cooperative .
-
Safiya Noble (2018). Algorithms of oppression: How search engines reinforce racism. NYU Press.
-
Cathy O'Neil (2016). Weapons of math destruction: How big data increases inequality and threatens democracy. Broadway Books.
-
David Ribes, Charlotte P. Lee (2010). Sociotechnical Studies of Cyberinfrastructure and e-Research: Current Themes and Future Trajectories. Computer Supported Cooperative Work.
-
Bertrand Russell (1953). The impact of science on society. Routledge.
-
John Trowbridge, Robert Weller, Deborah Kelley, Edward Dever, Albert Plueddemann, John A. Barth, and Orest Kawka (2019). The Ocean Observatories Initiative. Frontiers in Marine Science.
-
Cheng-ting Tsai, Peter V. Robinson, Carole A. Spencer, and Carolyn R. Bertozzi (2016). Ultrasensitive Antibody Detection by Agglutination-PCR (ADAP). ACS Central Science.
-
John W. Tukey (1962). The future of data analysis. The annals of mathematical statistics.