Hardening in oysters drives increased growth
It’s a stage specific thing
Mar 8, 2024
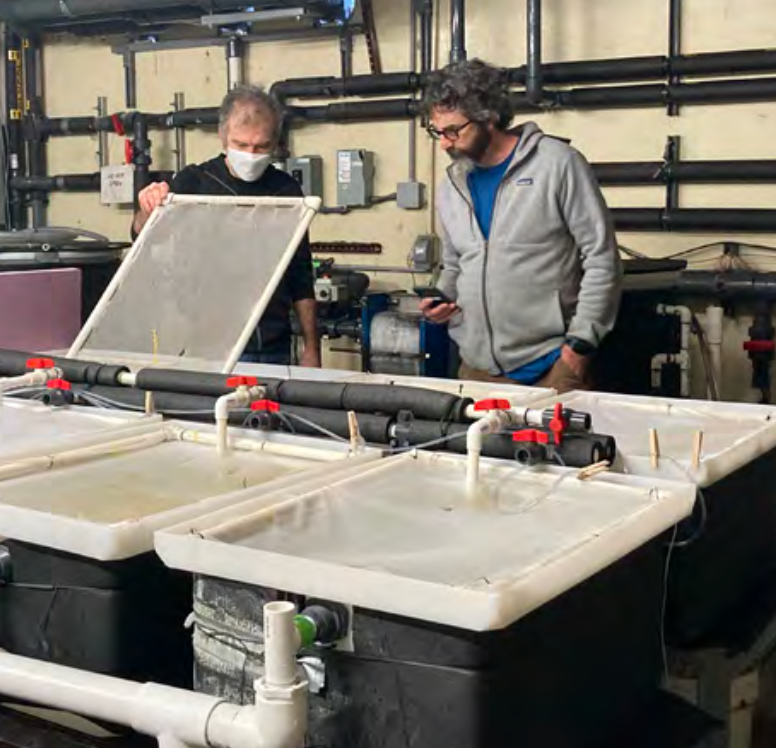
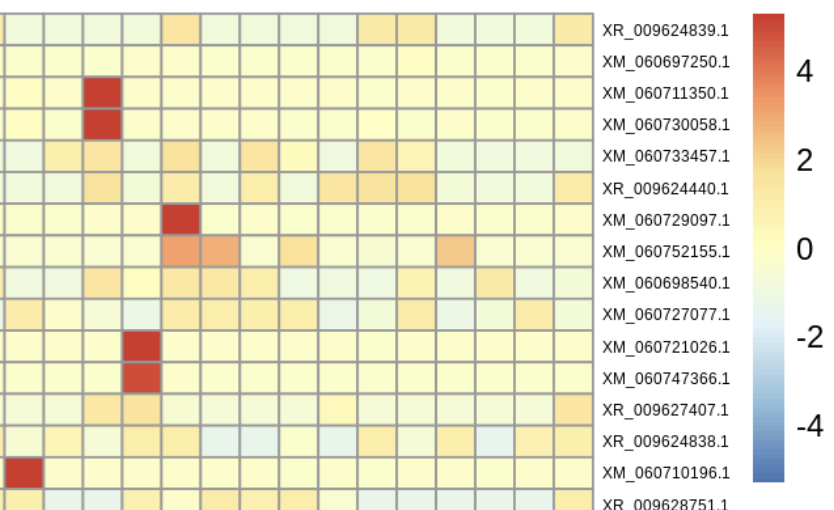
Research in our lab focuses on characterizing physiological responses of marine organisms to environmental change. Using integrative approaches we strive to examine impacts and adaptive potential from the nucleotide to organismal level. A core component of this includes investigating the functional relationship of genetics, epigenetics, and physiology.
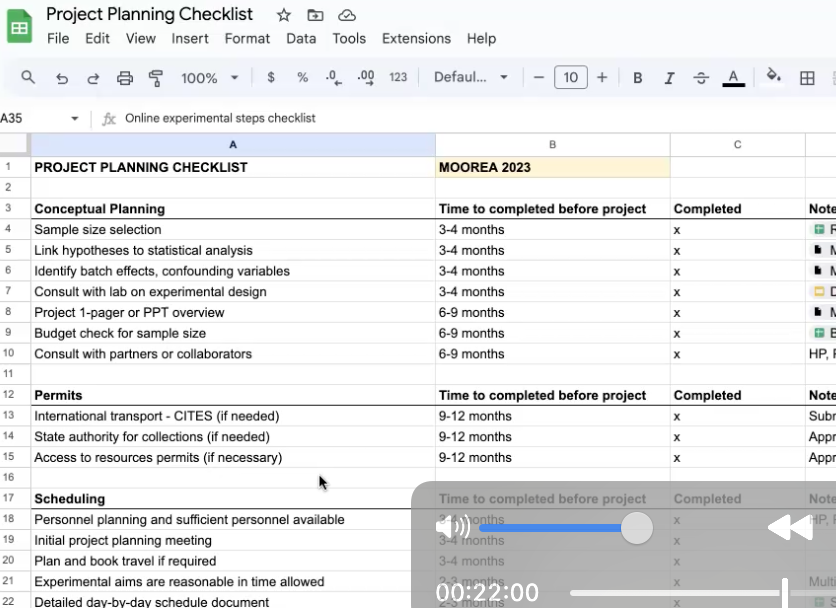
Our lab makes all research products and processess readily available. This includes publishing of online lab notebooks, presentations, protocols, data, and more.
Below is a snapshot of current activity. Use the sidebar menu to learn more about the people, research, and lab culture. If you explore this site and want more, you can checkout our handbook and tusk.