Changes in Puget Sound Waters Over the Last Century
Parker MacCready, University of Washington, School of Oceanography
Climate change, and how it might affect the Puget Sound ecosystem, are of great concern in our region. Here we explore how Puget Sound water properties, river flow, and weather have changed over the past century. This analysis is motivated by the Salish Sea Marine Survival Project, which seeks to understand why Chinook and Coho salmon populations in the Salish Sea have decreased since about 1970.
SUMMARY: Based on observations of water properties, river flow and weather there are three clear changes in Puget Sound over the last century. Water temperature in the Sound has increased by 0.5-1.0 °C, with the largest increase in the surface waters of Hood Canal. Salinity has changed less, although the surface waters of Hood Canal appear to be fresher by about 1 psu. There is no clear trend in the total amount of precipitation, and most rivers do not show much long term change. However, in rivers with large watersheds in the Cascades the flow happens more in the winter and less in the spring because there is less snow to melt. Air temperature has gradually increased, by about 1-2 °C in a century, consistent with the change in water temperature.
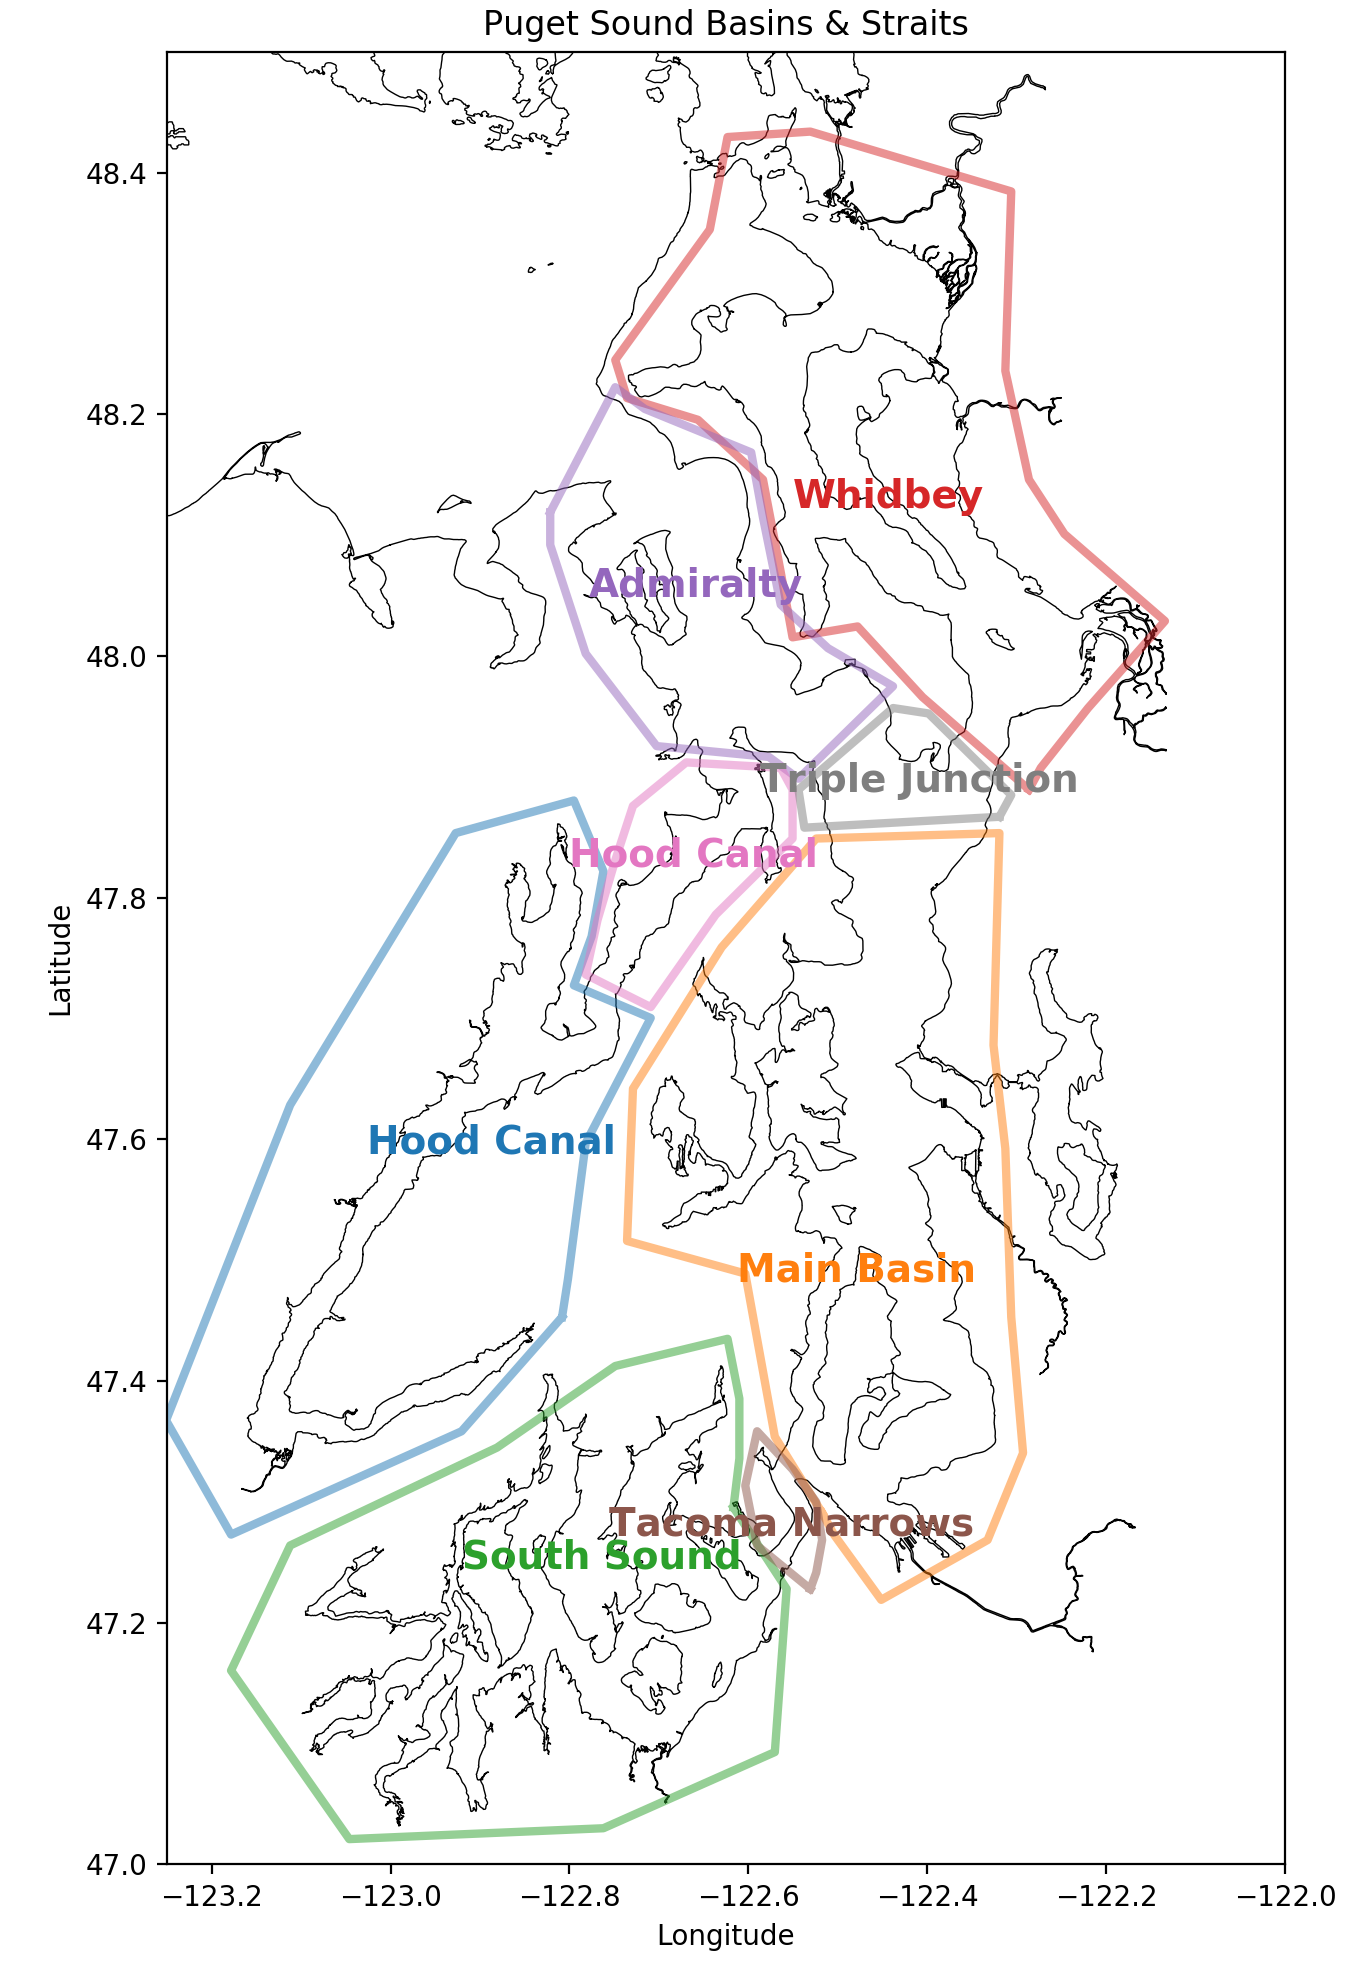
Place Names of Puget Sound: The "basins" are generally deep with weak tidal currents. These are Main Basin, Whidbey Basin, Hood Canal, and South Sound. The "straits" connecting them are generally shallower, narrower, and have much stronger tidal currents, especially Admiralty Inlet and Tacoma Narrows.
Water Properties in Puget Sound [TOP]
Currently the Washington State Department of Ecology goes out every month, by small boat and float plane, and samples water properties at several dozen repeat stations throughout Puget Sound and the Washington coastal estuaries. They collect "CTD cast" data on temperature, salinity, dissolved oxygen (DO) and other properties throughout the water column, in many cases down deeper than 200 m. They also collect water samples in bottles from a few depths, typically 0, 10, and 30 m, which are analyzed for chemicals such as Nitrate. The Ecology data goes back to 1991, although here we only consider 1999-2017 because of the availability of DO in the records.
This gives us almost 40 years of data, but it is not long enough to clearly identify long term trends that may correlate with salmon declines. To augment our record we use the Collias data set, a compilation of cast and bottle data from the period 1932-1975. These data are not sampled with the same monthly frequency or regular station location as the Ecology data, but by aggregating them into basins or longer time periods we can combine the Ecology and Collias data sets to make a much longer (albeit gappy) historical record.
In presenting our results we will focus on Main Basin and Hood Canal, because they have good data availability and are representative of the changes we see in most of the Sound. Similar plots for all the basins are available here.
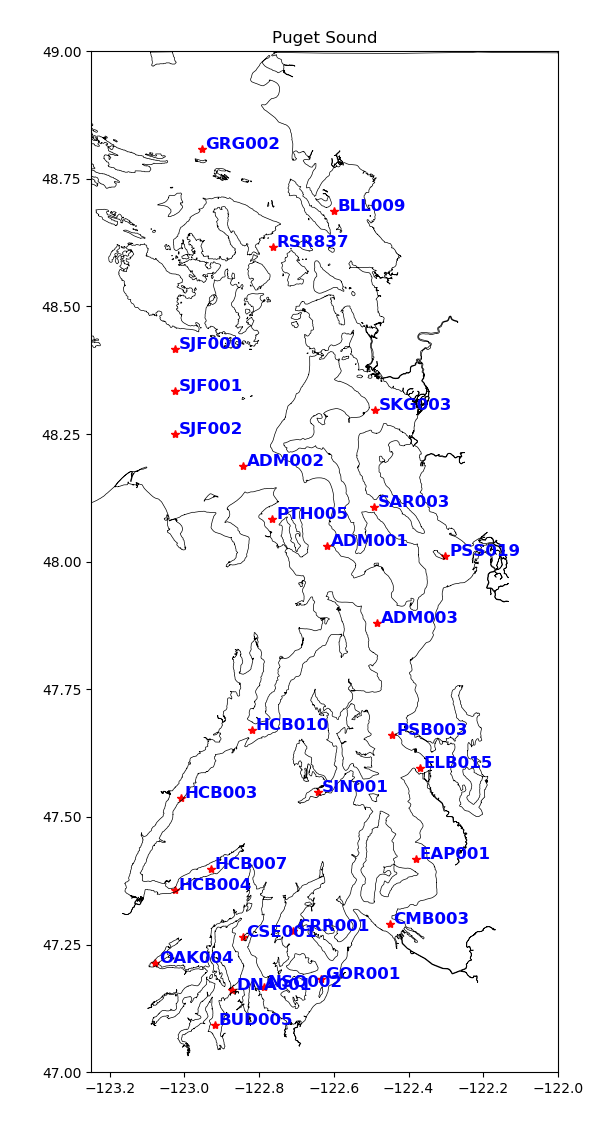
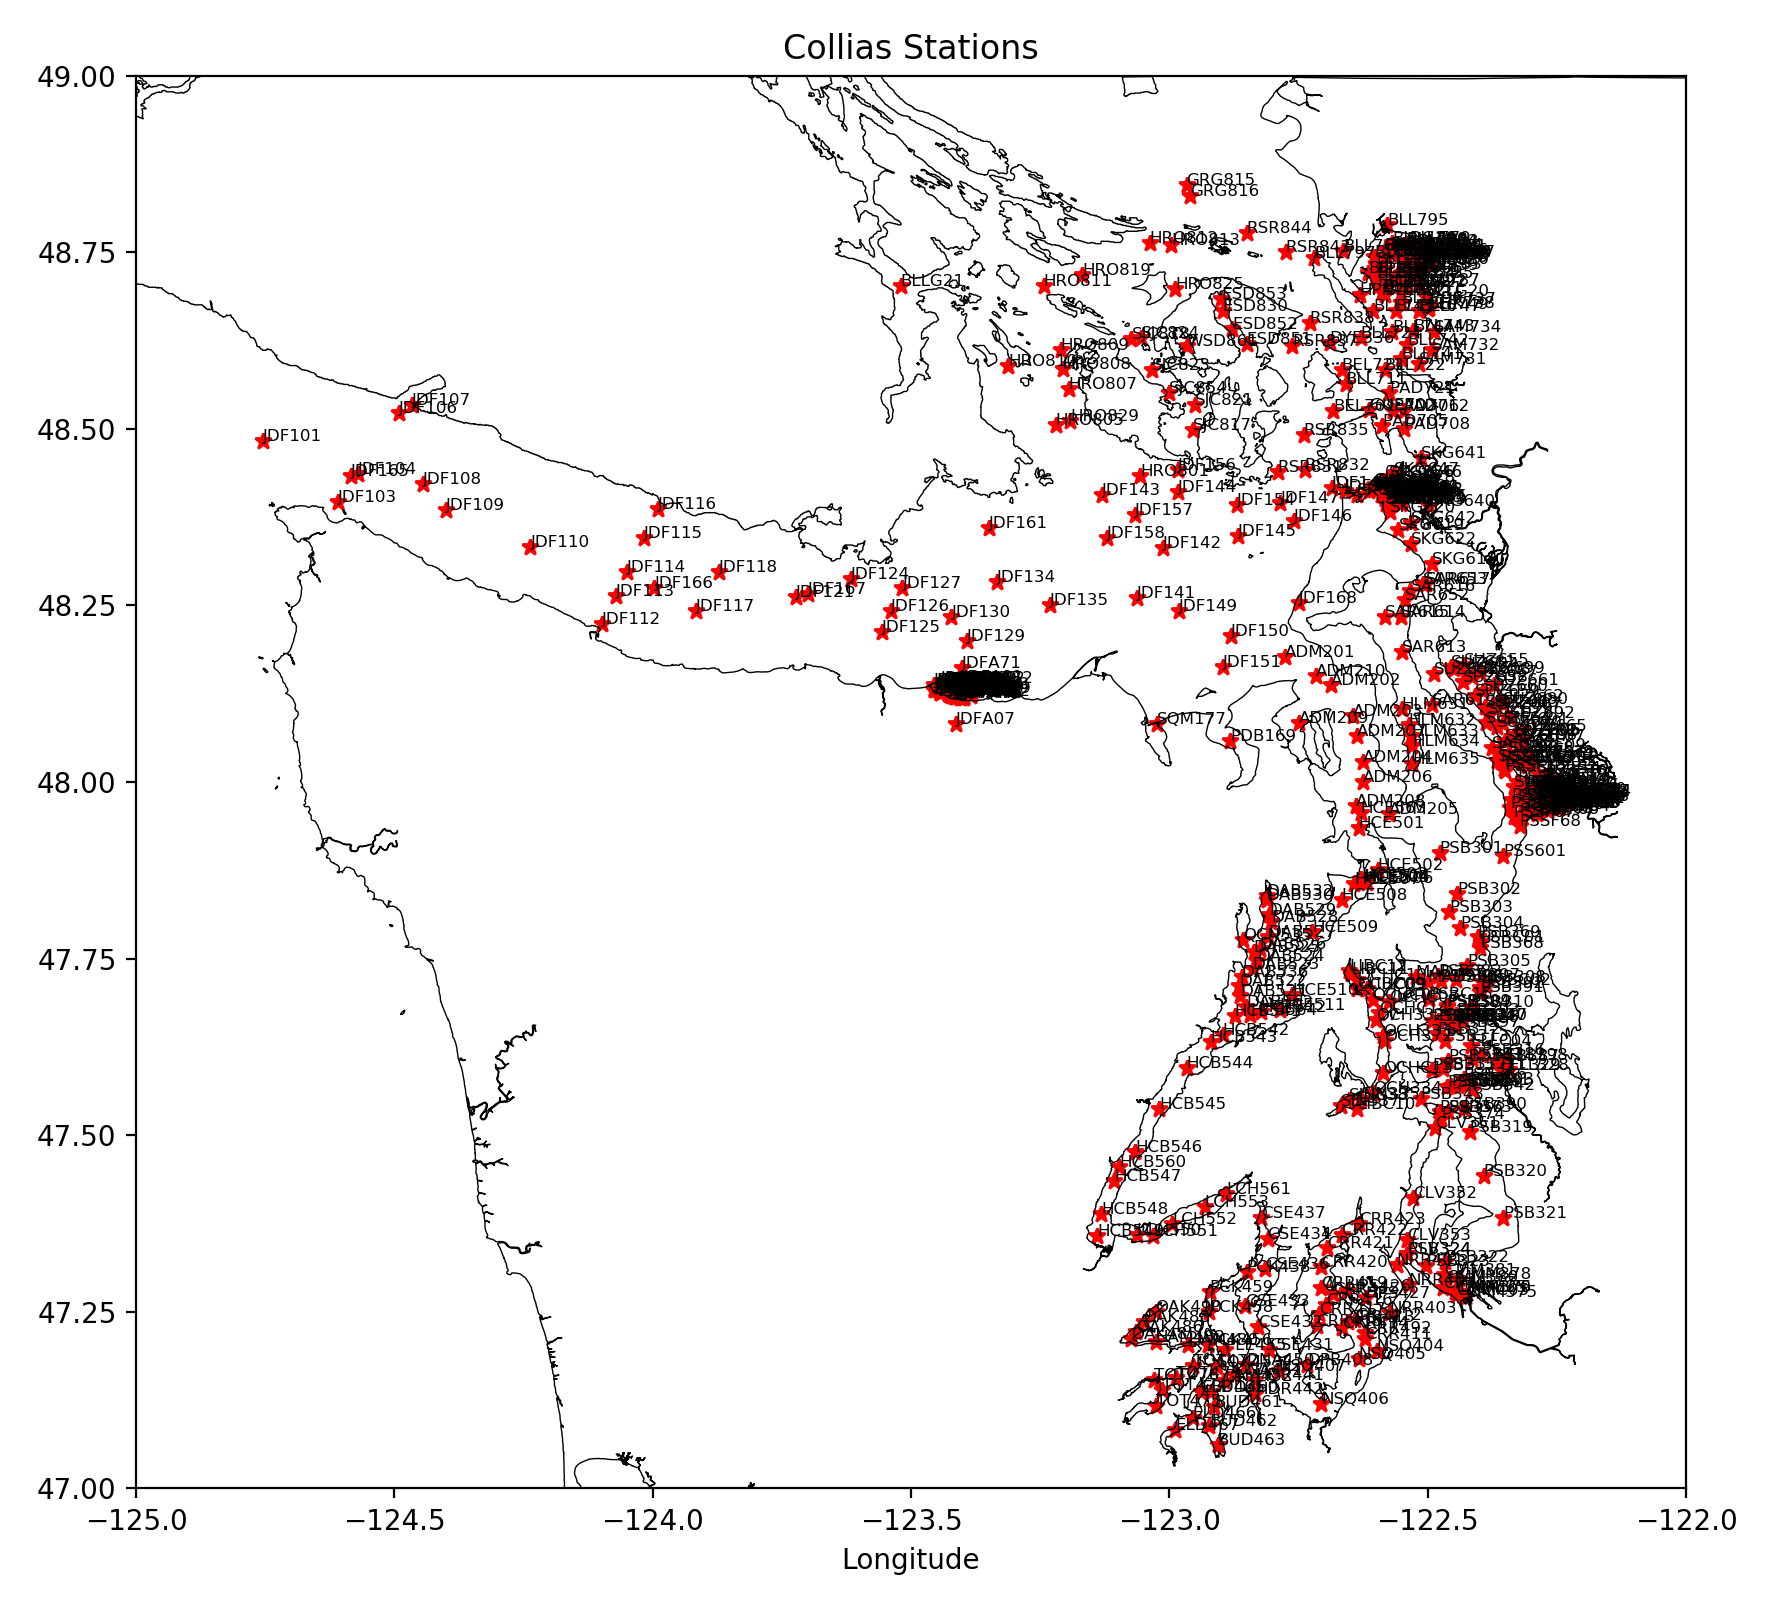
The maps above show Ecology and Collias stations. The Ecology station pattern is much more regular. We combine the two data sets by averaging all the data in a given basin.
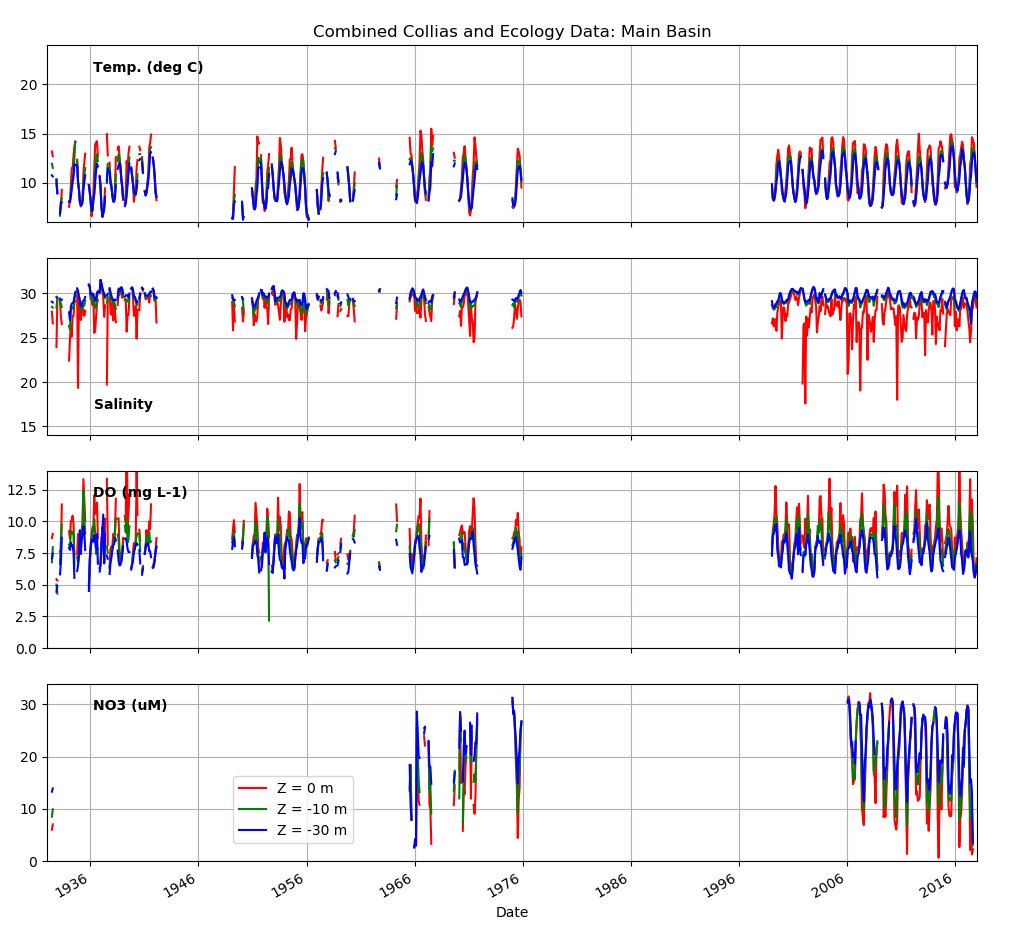
Above we plot long time series of four water properties, combining the Collias and Ecology data for all stations in Main Basin. We select date from three depths: 0, 10, and 30 m. There are clear gaps in the time series, with the only really continuous records starting in 1999 with Ecology. The annual cycle (e.g. cold water in the winter, warm in the summer) is apparent in all properties. While we think of Main Basin as relatively well-mixed there are also clear depth differences, for example surface waters are always fresher due to the input from rivers. By eye it is hard to see if there are clear trends in the data. Also the Nitrate data (NO3) does not really have enough past information to tell if there are trends.
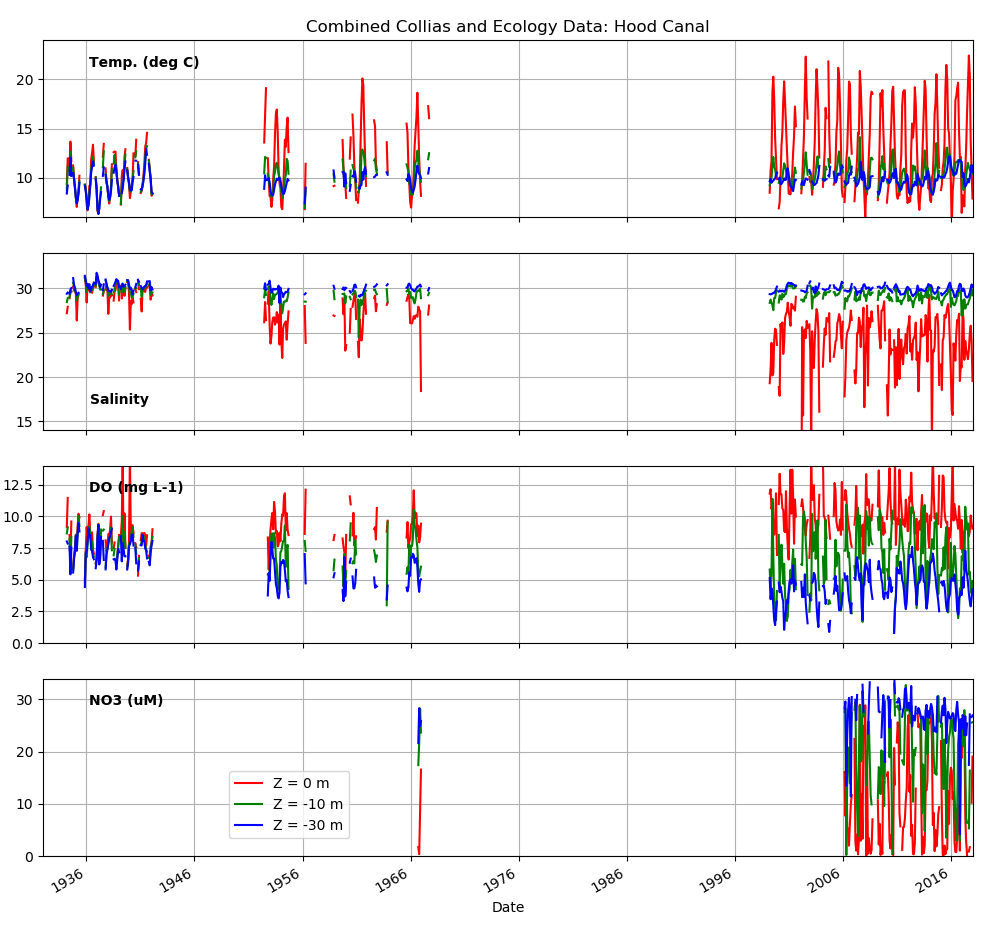
Looking at similar time series from all the Hood Canal stations (above) there are some striking changes over time. Surface waters appear to be warmer and fresher, and DO at 30 m depth may have decreased. Are these signals real, or perhaps due to differences in sample location or methods? These are hard questions to answer (we can't go back in the past and re-do the Collias data collection!) so we look for supporting evidence. We will do this by (i) looking at the data in a couple of other ways, and (ii) by looking at related records of stream flow and weather, which are known to influence the water in Puget Sound.
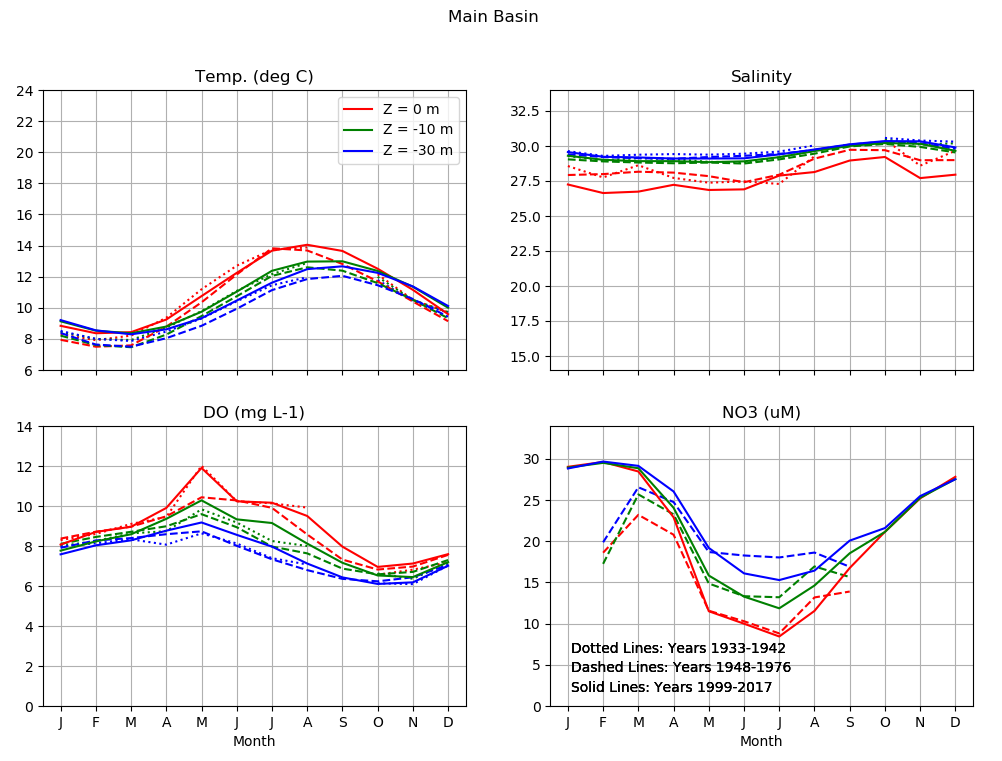
One way we can simplify all this data is to look at the seasonal cycle. This means we take all the data from a given basin, in a given depth range, and then average it by month, as shown above for Main Basin. Again we show the four water properties: Temperature, Salinity, Dissolved Oxygen, and Nitrate. The colors show the depth.
We have also split our time series into three sub-periods, denoted by the different line styles, as a way of looking for changes over time. For Main Basin there are no obvious changes in either average values or timing. The reason timing matters is that different salmon stocks come out of rivers at different times of year.
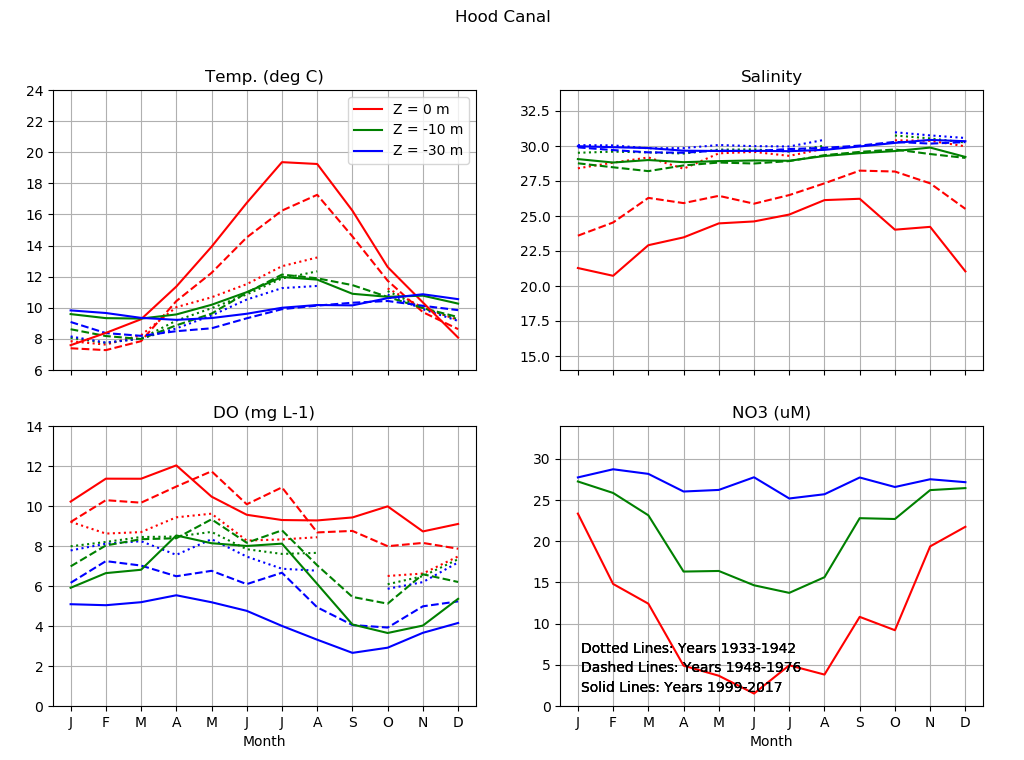
Looking at the seasonal cycle in Hood Canal (above) we see some striking changes over time. Surface waters in the modern era, 1999-2017, are warmer (especially in the summer) and fresher (especially in the winter). Dissolved Oxygen at 30 m appears to have decreased by about 3 mg/L (about 30%). One type of change we do not obviously see in any of these records is changes in timing.
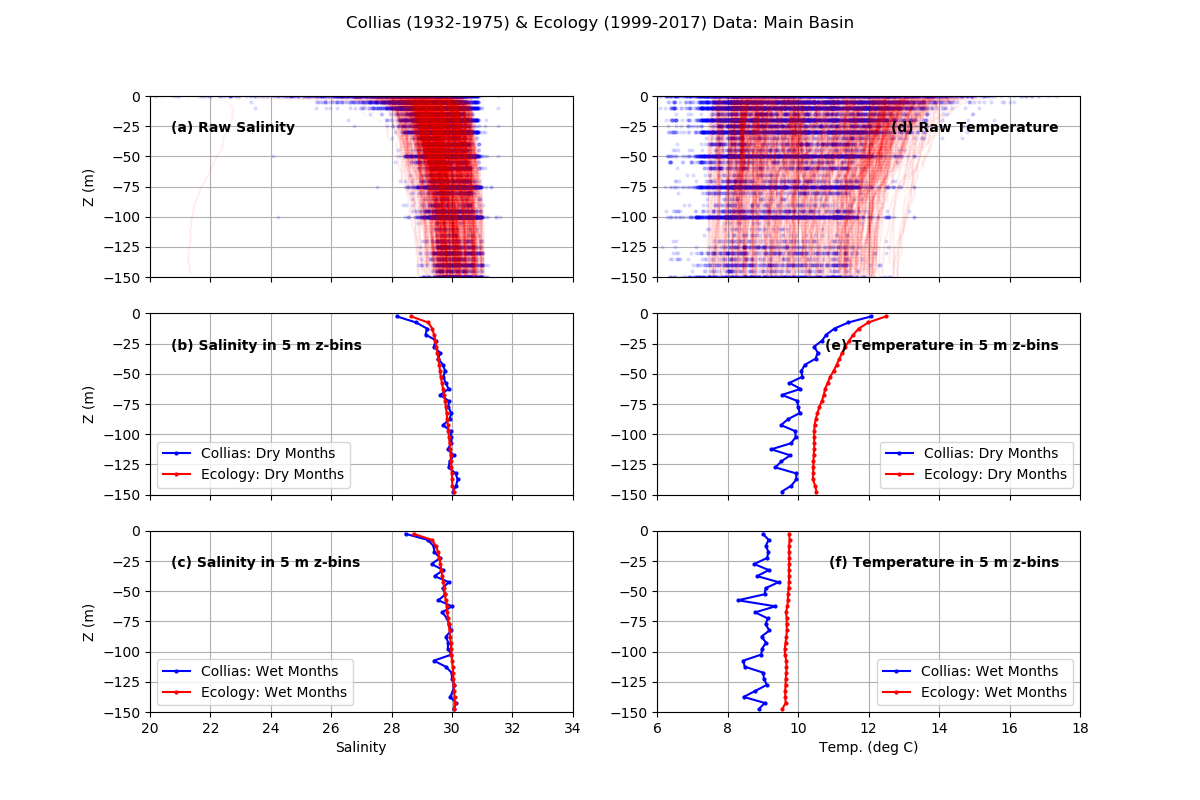
To explore the water properties in more detail, we can look at changes versus depth within a basin. In the top row of plots above we plot ALL the Collias (blue) and Ecology (red) Temperature and Salinity data from Main Basin. There is a lot of spread in the data, because we are looking at all months of all years. To make things clearer we average all the data into 5 m bins, and then select only "Dry" months (May through September, middle row) or "Wet" months (October through April, bottom row). The one thing that really stands out is that the whole water column has gotten about 1 °C warmer in the modern, Ecology, data period. This is consistent with other long data records from the Salish Sea (Riche et al. 2014) and, as we will see below, with the weather. Since we have been able to make accurate temperature measurements for centuries, it is likely that these changes are real, not an artifact of sampling or procedures.
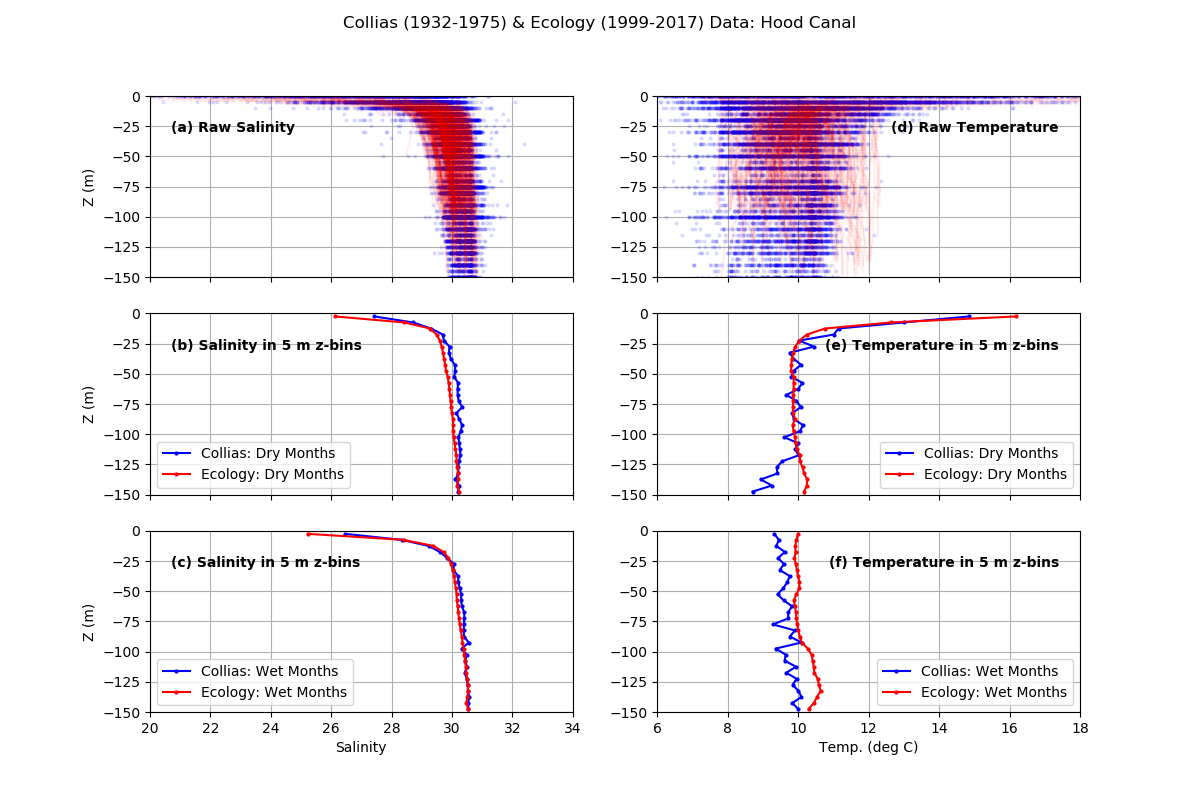
Turning to the water column in Hood Canal (above), there is again some evidence of warming, especially in the Wet months. There is also some, apparently real, warming and freshening of the surface waters, but it is isolated to the top 5 m bin. Could this be due to the Hood Canal Floating Bridge partially impeding the flow of surface waters out to the Pacific Ocean? Perhaps. The Bridge was constructed in 1961. On the other hand, Hood Canal is among the more highly "stratified" basins of the Sound, meaning that water properties change rapidly with depth near the surface. This means that small changes in the exact depth of observations of the water close to the surface could give rise to apparent changes when we make our 5 m binned averages.
River Flow: Changes in Timing [TOP]
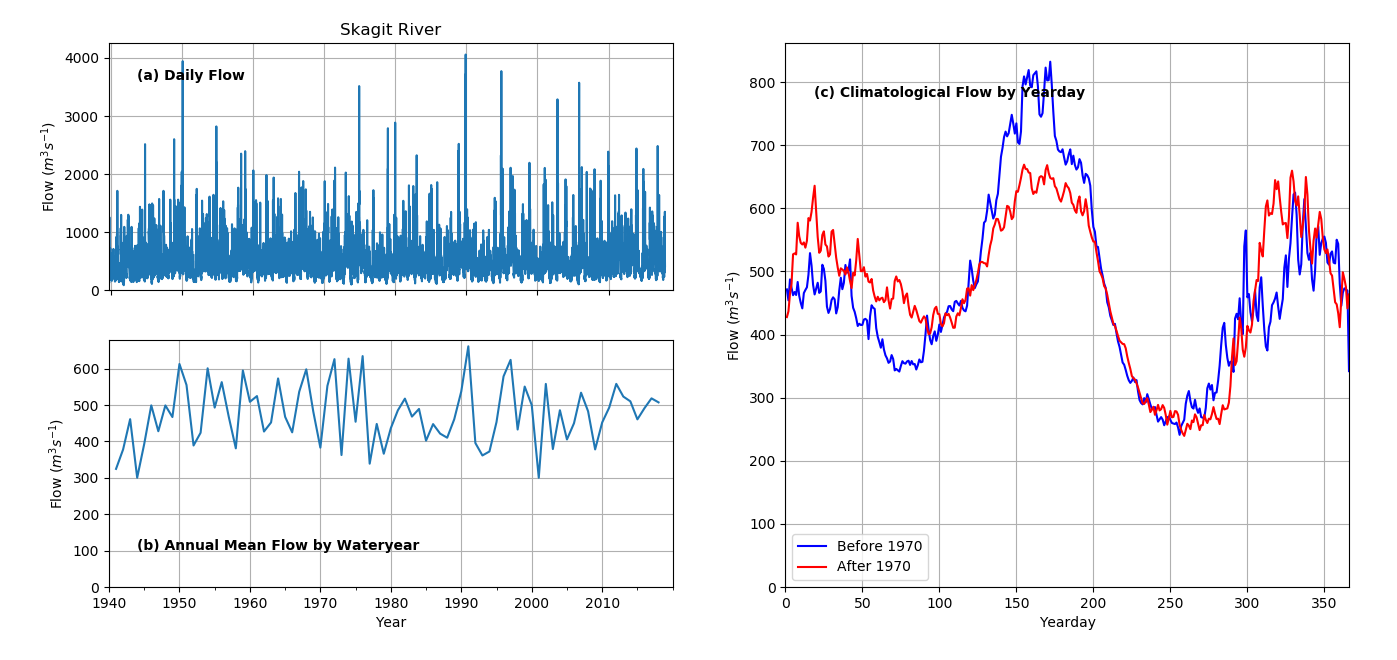
One type of environmental data for which very long records are available is river flow, provided by the US Geological Survey. We looked at long records from a selection of the main rivers in the Sound, spanning all the Basins. For the most part there was no clear trend over the past century in annual average river flow, or in the timing of that flow. One important exception is shown above, the Skagit River. This is the biggest river in the Sound, flowing into Whidbey Basin, and then into northern Main Basin, with an annual average flow of 500 m3/s (accounting for fully half the net river flow into the Sound). The complete record of daily flow, almost 80 years, is plotted in (a). Below that we average the flow by year (b). There is a lot of variation between wet and dry years, for example the drought year of 2001 had less than half the flow of a wet year. There is no obvious long term trend. The year averages are actually calculated using "water years" which start on October 1 of the year before, in order to capture the full wet period of the winter.
While there is not a long term trend in the AMOUNT of water flow in this river, there is a change in the TIMING. This is apparent in (c) where we bin all the flow by day of year, and then make separate averages of everything before 1970 (blue) and after 1970 (red). The clear change is that in more recent records (red) the "spring freshet" of peak flow in June (around day 160) has decreased, and the flow during the winter has increased. The physical reason for this, which is also quite apparent in other rivers like the Fraser, is that there is less accumulation of snow in the mountains during the winter, so there is less to melt in the spring. This may be an important change for salmon in the Sound if they depend on abundant, cold freshwater in the spring. Other rivers we examined do not have such a strong spring freshet, and as a result they did not show as much of a long term change.
Weather: Rainfall, Sunshine, and Temperature [TOP]
We can also examine long term weather records in our region, to see of they are consistent with the warming we saw in Puget Sound waters. You can access this data from the National Climate Data Center. While there is a lot of data available, not that many records go back as long as we would like. Also some types of data that we would like to know about, like wind speed, appear to have have biases and odd jumps due to changes in instrumentation over the years. So we focus here on the things that are most reliably measured: rainfall and temperature.
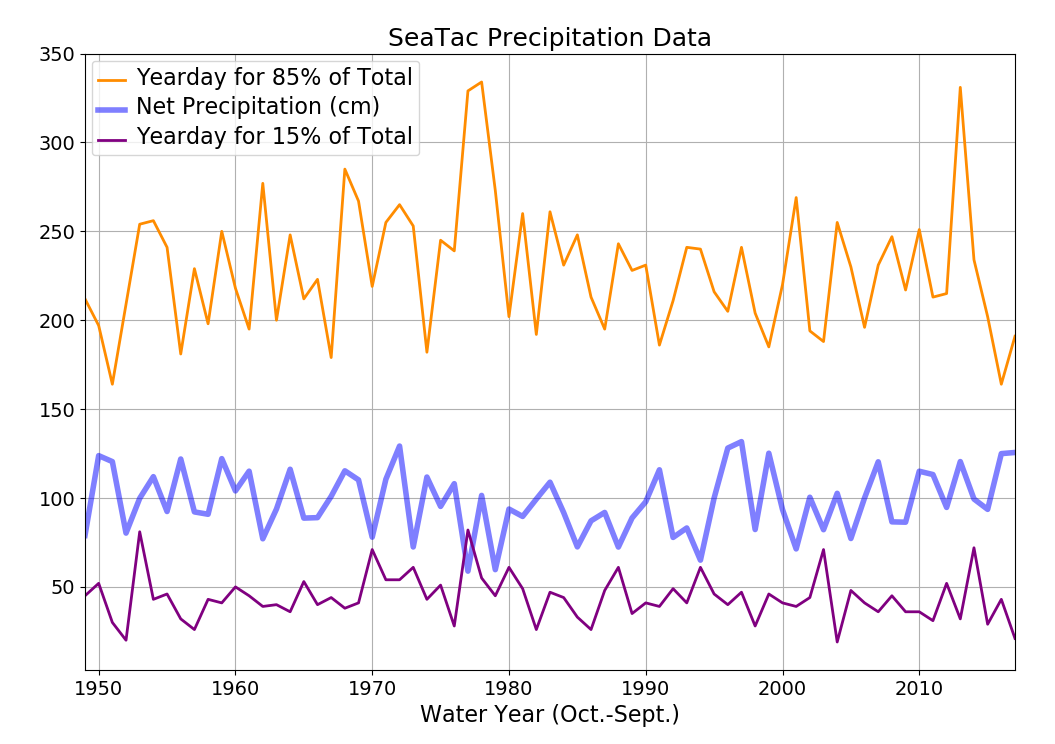
A particularly good long term record comes from SeaTac airport, just south of Seattle. In the plot above we show rainfall data, averaged by year (actually water year, like we did for the river flow), for almost 70 years. The thick line in the middle is net rainfall (cm), so you can see that about a meter of rain falls on us each year. It may have been drier in the 80's, and wetter in the 50's, but there is no obvious trend. We also plot lines showing what day of the year the accumulated rain got to 15% and 85% of the total for that year. This is a way to look for changes in timing. Again there are no obvious trends.
All the rain data above is consistent with what we saw in the river flow: there is no obvious long term trend in the amount of precipitation.
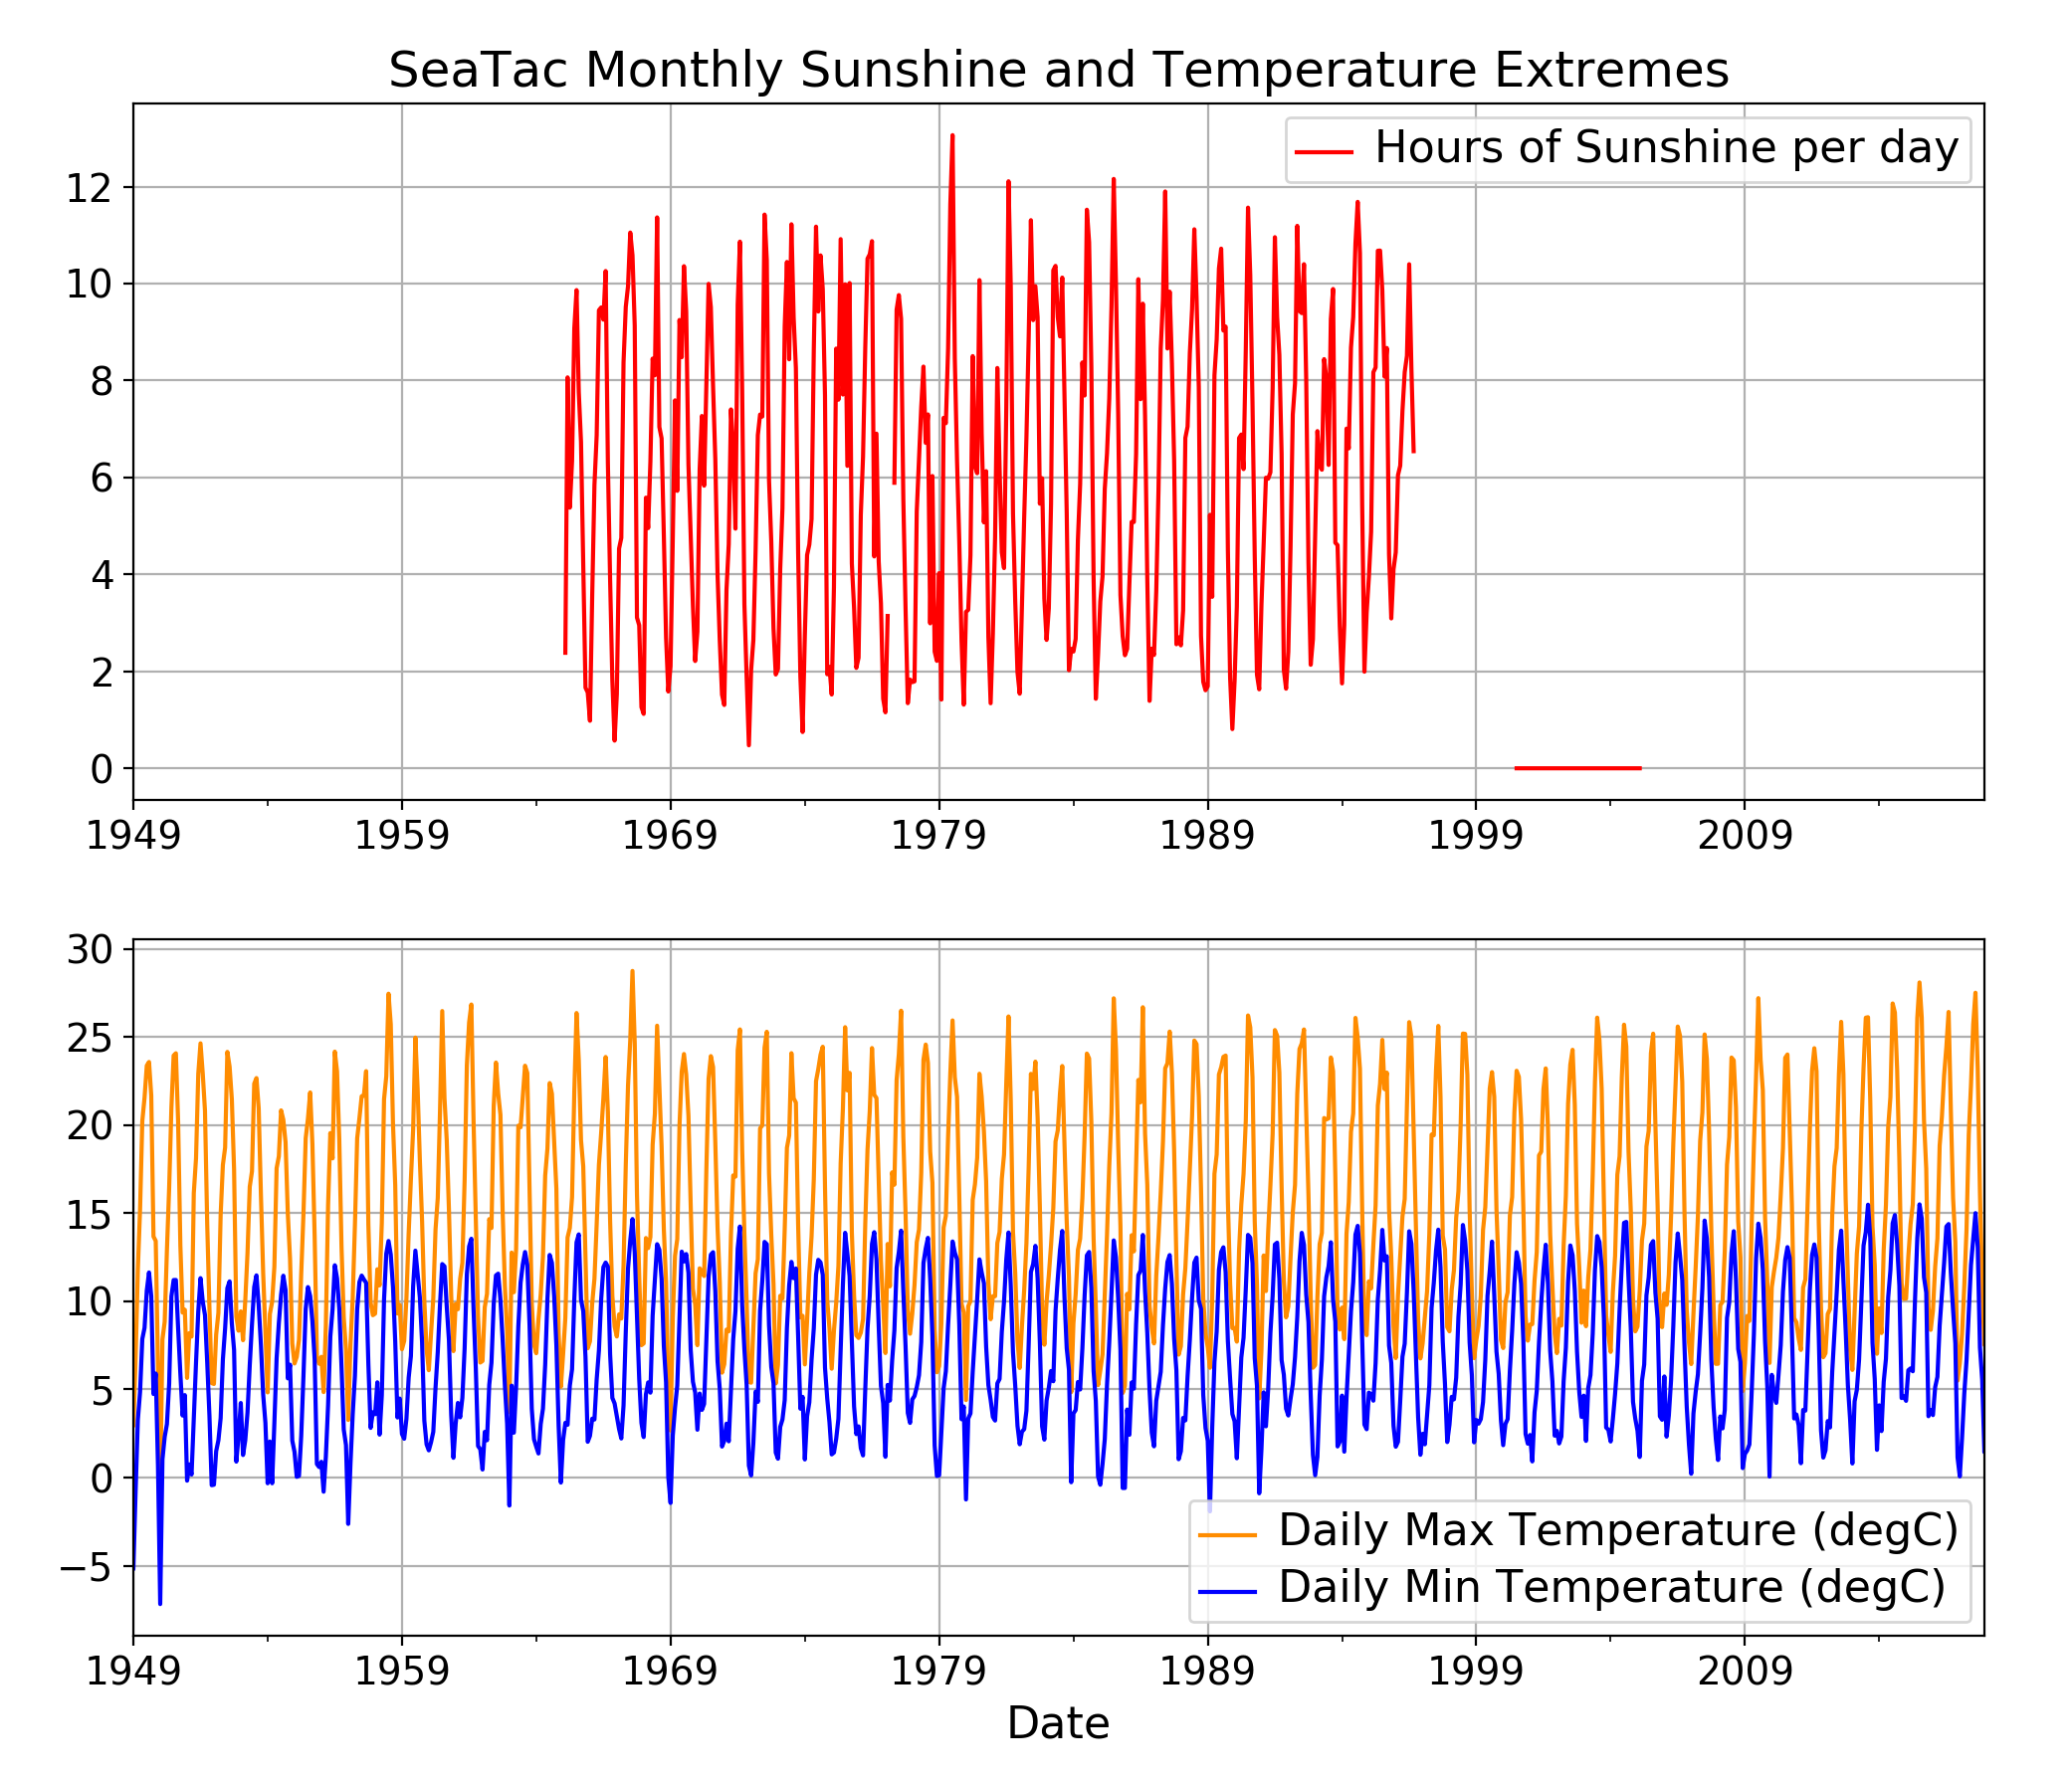
The temperature record from SeaTac shows clear long term trends. In the upper plot above we show one measure of how sunny it is in this region, however the time span during which the data are available is not really long enough to say if things are changing. In the lower plot we show about 70 years of daily max and min temperature, averaged into month bins. The annual hot-cold cycle is apparent as the jagged up and down of the curves. There is also a gradual warming, most apparent in the summertime Daily Min Temperature (the peaks of the blue curve). This indicates that summertime nights have gotten warmed by about 4 °C over this time. Overall this warming is broadly consistent with the warming we saw in Puget Sound waters.
Physically, the warmer air could have warmed the water in Puget Sound, but it is also likely that the warming occurred over a much larger area, like the North Pacific, which is the source waters for the Salish Sea and Puget Sound.
SUMMARY [TOP]
Based on the observations presented here, it is clear that some aspects of the water properties of Puget Sound have changed over the past 50-100 years. The water is somewhat warmer and has lower oxygen levels below the surface. Neither of these changes would be beneficial to salmon. It is unlikely, however,that these changes alone have caused the large decreases in Chinook and Coho salmon we have seen in Puget Sound since 1970, but they may have contributed. There are many other possible causes being investigated by US and Canadian scientists, including changes in zooplankton quality, predation by seals, disease, and other hypotheses.
Other sources of information [TOP]
- For weather records like temperature and precipitation, there is an amazing new online tool from the Office of the Washington State Climatologist. You can use this yourself to quickly make plots similar to what we did with the SeaTac weather above.
- The NANOOS NVS Climatology app allows you to explore current data from buoys in Washington marine waters, putting the data in historical context.
- A beautiful analysis of long-term changes in the Strait of Georgia, the Canadian part of the Salish Sea, is in:
- Riche, O., S. C. Johannessen, and R. W. Macdonald, 2014: Why timing matters in a coastal sea: Trends, variability and tipping points in the Strait of Georgia, Canada. J. Mar. Syst., 131, 36-53, doi:10.1016/j.jmarsys.2013.11.003.
- and related ecosystem effect are described here:
- Preikshot, D., R. J. Beamish,and C. M. Neville, 2013: A dynamic model describing ecosystem-level changes in the Strait of Georgia from 1960 to 2010. Prog. Oceanogr., 115, 28-40, doi:10.1016/j.pocean.2013.05.020.
- Potential pitfalls in dealing with long term changes in wind speed data are described here:
- Wan, H., X. L. Wang, and V. R. Swail, 2010: Homogenization and Trend Analysis of Canadian Near-Surface Wind Speeds. J. Clim., 23, 1209-1225. doi:10.1175/2009JCLI3200.1
- Some background on long term changes in salmon survival is contained in this paper:
- Zimmerman, M., J. R. Irvine, M. O’Neill, J. H. Anderson, C. M. Greene, J. Weinheimer, M. Trudel, and K. Rawson, 2015: Spatial and Temporal Patterns in Smolt Survival of Wild and Hatchery Coho Salmon in the Salish Sea. Mar. Coast. Fish. Dyn. Manag. Ecosyst. Sci., 7, 116-134, doi:10.1080/19425120.2015.1012246.
Data and programs used to make these plots [TOP]
If you are comfortable with programming in python and want to see how the data in the plots above was gathered and processed, you can find the whole pile of zipped input, code, and output directories here. I have endeavored to include clear README's in all the code folders, but if anything is unclear please email the author: Parker MacCready, pmacc@uw.edu.
Dropbox Link to Compressed Files [178 MB]