mmf.utils.mmf_plot
| LaTeXPlotProperties(*varargin, **kwargs) | Instances of this class provide a description of properties of a plot based on numbers extracted from a LaTeX file. Insert the following code into the section where the plot is to appear in order to extract the appropriate parameters and then use the reported values to initialize this class: |
| ListCollection(collections, **kwargs) | Provide a simple matplotlib.collections.Collection of a list of |
| Figure(*varargin, **kwargs) | This class represents a single figure and allows customization of properties, as well as providing plotting facilities. |
| imcontourf(x, y, z[, contours]) | Like matplotlib.pyplot.contourf() but does not actually find contours. |
| contourf(*v, **kw) | Replacement for matplotlib.pyplot.contourf() that supports the |
| plot_errorbars(x, y[, dx, dy, colour, ...]) | |
| xticks(ticks) | Replace ticks with real text so psfrag works. |
| error_line(x, y, dy[, fgc, bgc, N, fill]) | Plots a curve (x,y) with gaussian errors dy represented by |
| plot3d(x, y, z[, wireframe]) | Wrapper to generate 3d surface plots. |
| plot_err(x, y[, yerr, xerr]) | Plot x vs. |
| monkey_patch_inset_locator() | |
| plot3dmpl(X, Y, Z[, zmin, zmax, xlabel, ...]) | Use MayaVi2 to plot the surface. |
| yticks(ticks) |
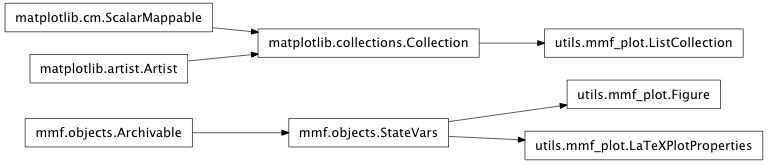
Inheritance diagram for mmf.utils.mmf_plot:
Plotting tools.
This module includes some additional tools for making publication quality figures for LaTeX documents. The main goal is for good control over sizing, fonts, etc.
To Do
Todo
Fix this bug!
>>> from mmf.utils.mmf_plot import Figure
>>> fig = Figure()
>>> plt.plot([0,1],[1,1.118])
>>> fig.adjust()
This has something to do with the yticks. If they are set, then things work fine:
>>> plt.clf()
>>> plt.plot([0,1],[1,1.118])
>>> plt.yticks(plt.yticks()[0])
>>> fig.adjust()
- class mmf.utils.mmf_plot.LaTeXPlotProperties(*varargin, **kwargs)[source]
Bases: mmf.objects.StateVars
Instances of this class provide a description of properties of a plot based on numbers extracted from a LaTeX file. Insert the following code into the section where the plot is to appear in order to extract the appropriate parameters and then use the reported values to initialize this class:
::
- LaTeXPlotProperties(textwidth_pt=332.89723,
- columnwidth_pt=332.89723, baselineskip_pt=12.0, tick_fontsize=footnotesize, usetex=True, style=None, font_info={‘euler’: (‘zeur’, ‘\usepackage[sc,osf]{mathpazo}\usepackage[euler-digits,small]{eulervm}’), ‘times’: (‘ptm’, ‘\usepackage{mathptm}’)}, font={‘monospace’: [‘computer modern typewriter’], ‘serif’: [‘euler’], ‘family’: ‘serif’, ‘sans-serif’: [‘bera sans serif’]}, latex_preamble=[‘\usepackage{mmfmath}\usepackage{amsmath}’], latex_preview=True, golden_mean=0.61803398875, font_size_pt=10, font_factors={‘small’: 0.9, ‘footnotesize’: 0.8}, inches_per_pt=0.0138370001384, inches=1.0, pt=0.0138370001384)
showthetextwidth showthecolumnwidth showthebaselinskip
Note
We assume that the document is typeset using the Computer Modern fonts.
Attributes
- class mmf.utils.mmf_plot.ListCollection(collections, **kwargs)[source]
Bases: matplotlib.collections.Collection
Provide a simple matplotlib.collections.Collection of a list of artists. Provided so that this collection of artists can be simultaneously rasterized. Used by my custom contourf() function.
Methods
add_callback(func) Adds a callback function that will be called whenever one of add_checker(checker) Add an entry to a dictionary of boolean flags autoscale() Autoscale the scalar limits on the norm instance using the autoscale_None() Autoscale the scalar limits on the norm instance using the changed() Call this whenever the mappable is changed to notify all the check_update(checker) If mappable has changed since the last check, contains(mouseevent) Test whether the mouse event occurred in the collection. convert_xunits(x) For artists in an axes, if the xaxis has units support, convert_yunits(y) For artists in an axes, if the yaxis has units support, draw(artist, renderer, *args, **kwargs) findobj([match, include_self]) Find artist objects. get_agg_filter() return filter function to be used for agg filter get_alpha() Return the alpha value used for blending - not supported on all get_animated() Return the artist’s animated state get_array() Return the array get_axes() Return the Axes instance the artist get_children() Return a list of the child :class:`Artist`s this get_clim() return the min, max of the color limits for image scaling get_clip_box() Return artist clipbox get_clip_on() Return whether artist uses clipping get_clip_path() Return artist clip path get_cmap() return the colormap get_collections() get_contains() Return the _contains test used by the artist, or None for default. get_dashes() get_datalim(transData) get_edgecolor() get_edgecolors() get_facecolor() get_facecolors() get_figure() Return the Figure instance the get_gid() Returns the group id get_hatch() Return the current hatching pattern get_label() Get the label used for this artist in the legend. get_linestyle() get_linestyles() get_linewidth() get_linewidths() get_offset_position() Returns how offsets are applied for the collection. get_offset_transform() get_offsets() Return the offsets for the collection. get_paths() get_picker() Return the picker object used by this artist get_pickradius() get_rasterized() return True if the artist is to be rasterized get_snap() Returns the snap setting which may be: get_transform() Return the Transform get_transformed_clip_path_and_affine() Return the clip path with the non-affine part of its get_transforms() get_url() Returns the url get_urls() get_visible() Return the artist’s visiblity get_window_extent(renderer) get_zorder() Return the Artist‘s zorder. have_units() Return True if units are set on the x or y axes hitlist(event) List the children of the artist which contain the mouse event event. is_figure_set() Returns True if the artist is assigned to a is_transform_set() Returns True if Artist has a transform explicitly pchanged() Fire an event when property changed, calling all of the pick(mouseevent) call signature: pickable() Return True if Artist is pickable. properties() return a dictionary mapping property name -> value for all Artist props remove() Remove the artist from the figure if possible. remove_callback(oid) Remove a callback based on its id. set(**kwargs) A tkstyle set command, pass kwargs to set properties set_agg_filter(filter_func) set agg_filter fuction. set_alpha(alpha) Set the alpha tranparencies of the collection. set_animated(b) Set the artist’s animation state. set_antialiased(aa) Set the antialiasing state for rendering. set_antialiaseds(aa) alias for set_antialiased set_array(A) Set the image array from numpy array A set_axes(axes) Set the Axes instance in which the set_clim([vmin, vmax]) set the norm limits for image scaling; if vmin is a length2 set_clip_box(clipbox) Set the artist’s clip Bbox. set_clip_on(b) Set whether artist uses clipping. set_clip_path(path[, transform]) Set the artist’s clip path, which may be: set_cmap(cmap) set the colormap for luminance data set_collections(collections) set_color(c) Set both the edgecolor and the facecolor. set_colorbar(im, ax) set the colorbar image and axes associated with mappable set_contains(picker) Replace the contains test used by this artist. set_dashes(ls) alias for set_linestyle set_edgecolor(c) Set the edgecolor(s) of the collection. set_edgecolors(c) alias for set_edgecolor set_facecolor(c) Set the facecolor(s) of the collection. set_facecolors(c) alias for set_facecolor set_figure(fig) Set the Figure instance the artist set_gid(gid) Sets the (group) id for the artist set_hatch(hatch) Set the hatching pattern set_label(s) Set the label to s for auto legend. set_linestyle(ls) Set the linestyle(s) for the collection. set_linestyles(ls) alias for set_linestyle set_linewidth(lw) Set the linewidth(s) for the collection. set_linewidths(lw) alias for set_linewidth set_lod(on) Set Level of Detail on or off. If on, the artists may examine set_lw(lw) alias for set_linewidth set_norm(norm) set the normalization instance set_offset_position(offset_position) Set how offsets are applied. set_offsets(offsets) Set the offsets for the collection. set_paths() set_picker(picker) Set the epsilon for picking used by this artist set_pickradius(pr) set_rasterized(rasterized) Force rasterized (bitmap) drawing in vector backend output. set_snap(snap) Sets the snap setting which may be: set_transform(t) Set the Transform instance set_url(url) Sets the url for the artist set_urls(urls) set_visible(b) Set the artist’s visiblity. set_zorder(level) Set the zorder for the artist. to_rgba(x[, alpha, bytes]) Return a normalized rgba array corresponding to x. update(props) Update the properties of this Artist from the update_from(other) copy properties from other to self update_scalarmappable() If the scalar mappable array is not none, update colors
- class mmf.utils.mmf_plot.Figure(*varargin, **kwargs)[source]
Bases: mmf.objects.StateVars
This class represents a single figure and allows customization of properties, as well as providing plotting facilities.
Figure(num=None,
       filename=None,
       width=columnwidth,
       height=1.0,
       plot_properties=None,
       axes_dict={'labelsize': 'medium'},
       tick_dict={'labelsize': 'small'},
       legend_dict={'isaxes': False,
       'handlelength': 4.0,
       'fontsize': 'medium',
       'frameon': True},
       tight_layout=False,
       margin_factors={'top': 0.5,
       'right': 0.5,
       'bot': 3,
       'left': 2.8},
       autoadjust=False)
Notes
Units are either pts (for fonts) or inches (for linear measurements).
This gives:
  > 345.0pt.
  l.3 \showthe\textwidth

  ?
  > 345.0pt.
  l.4 \showthe\columnwidth

  ?
  > 12.0pt.
  l.5 \showthe\baselineskip

.. plot::
   :include-source:

   x = np.linspace(0,1.01,100)
   y = np.sin(x)
   plot_prop = LaTeXPlotProperties(textwidth_pt=345.0,
                                   columnwidth_pt=345.0,
                                   baselineskip_pt=12.0)
   fig = Figure(filename='tst_book.eps',
                width='0.5*textwidth',
                plot_properties=plot_prop)
   plt.plot(x, y, label="r'\sin(x)'")
   plt.axis([-0.02,1.02,-0.02,1.02])
   plt.ylabel(
       r'$\int_{0}^{x}\left(\frac{\cos(\tilde{x})}{1}\right)d{\tilde{x}}$')
   #fig.savefig()

Here is another example using a two-column article::

   \documentclass[twocolumn]{article}
   \begin{document}
   \showthe\textwidth
   \showthe\columnwidth
   \showthe\baselineskip
   \end{document}

This gives::
   > 469.0pt.
   l.3 \showthe\textwidth

   ?
   > 229.5pt.
   l.4 \showthe\columnwidth

   ?
   > 12.0pt.
   l.5 \showthe\baselineskip

.. plot::
   :include-source:

   x = np.linspace(0,1.01,100)
   y = np.sin(x)
   plot_prop = LaTeXPlotProperties(textwidth_pt=489.0,
                                   columnwidth_pt=229.5,
                                   baselineskip_pt=12.0)
   fig = Figure(filename='tst_article.eps',
                plot_properties=plot_prop)
   plt.plot(x, y, label="r'\sin(x)'")
   plt.axis([-0.02,1.02,-0.02,1.02])
   plt.ylabel(
       r'$\int_{0}^{x}\left(\frac{\cos(\tilde{x})}{1}\right)d{\tilde{x}}$')
   #fig.savefig()
Attributes
- mmf.utils.mmf_plot.imcontourf(x, y, z, contours=None, *v, **kw)[source]
Like matplotlib.pyplot.contourf() but does not actually find contours. Just displays z using matplotlib.pyplot.imshow() which is much faster and uses exactly the information available.
Parameters : x, y, z : array-like
Assumes that z is ordered as z[x,y]. If x and y have the same shape as z, then x = x[:,0] and y = y[0,:] are used. Otherwise, z.shape == (len(x), len(y)). x and y must be equally spaced.
- mmf.utils.mmf_plot.contourf(*v, **kw)[source]
Replacement for matplotlib.pyplot.contourf() that supports the rasterized keyword.
- mmf.utils.mmf_plot.plot_errorbars(x, y, dx=None, dy=None, colour='', linestyle='', pointstyle='.', barwidth=0.5, **kwargs)[source]
- mmf.utils.mmf_plot.xticks(ticks)[source]
Replace ticks with real text so psfrag works. There was an API change somewhere along the line that broke this...
- mmf.utils.mmf_plot.error_line(x, y, dy, fgc='k', bgc='w', N=20, fill=True)[source]
Plots a curve (x,y) with gaussian errors dy represented by shading out to 5 dy.
- mmf.utils.mmf_plot.plot3d(x, y, z, wireframe=False, **kw)[source]
Wrapper to generate 3d surface plots.
- mmf.utils.mmf_plot.plot_err(x, y, yerr=None, xerr=None, **kwarg)[source]
Plot x vs. y with errorbars.
Right now we support the following cases: x = 1D, y = 1D