Findings
Shoreline Productivity
Hypothesis: Local shoreline productivity (growth rates of both plants
and animals) is closely linked in space and time with
food supply rather than with other factors such as temperature.
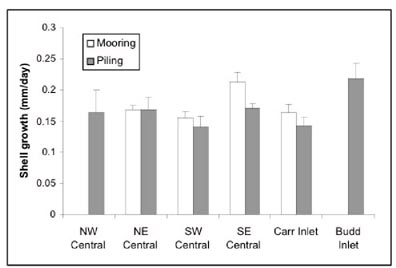
Results: i) Oysters
grew faster at the southern sites. ii) Barnacles and seaweed
show no north-south growth rate pattern.
Figure
1. Daily growth (mm shell length/day) of juvenile
oysters (Crassostrea gigas) transplanted to
six sites in Puget Sound, July-September 2002. Bars
are means (± SE) of three tiles permanently
submerged (moorings) or placed at mean lower low water
(pilings). Moorings at two sites disappeared.
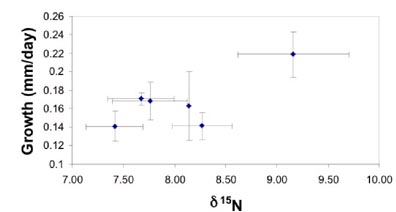
Figure
2. Daily growth (mm shell length/day) and
stable isotope ratios of juvenile oysters (Crassostrea
gigas) transplanted to six sites in Puget Sound,
July-September 2002. Oysters on ceramic tiles were
attached to pilings at mean lower low water. Bars
are means (+SE) of <3 tiles. Budd Inlet is the
site in the upper right hand corner, enriched in
15N and with relatively high secondary productivity.
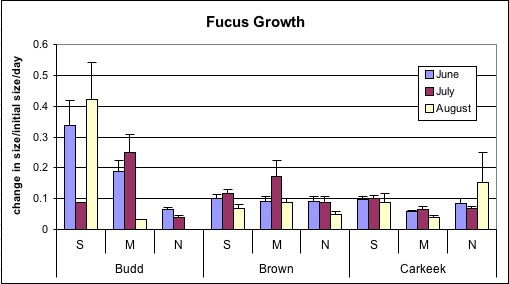
Figure
3. Relative growth
rates of Fucus plants set out at the 9 beaches during Summer
2005. Growth was highly variable both among plants and
among beaches, but overall there was little predictable
pattern. Plants at two of the Budd Inlet beaches grew faster
than at most of the other beaches, perhaps because of the
warmer water temperatures there.
Shoreline Species Diversity and
Biomass
Hypothesis: Sites
with higher shoreline productivity have higher species
diversity and higher biomass of organisms.
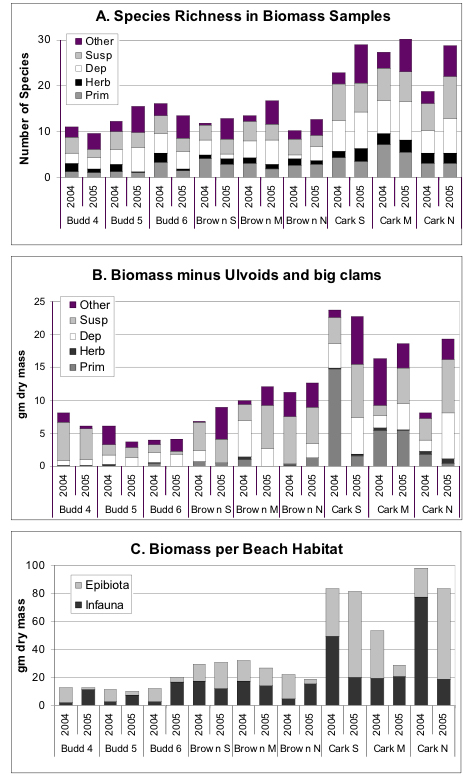
Results: i) Species
diversity is low at southern sites and high at northern
sites ii)Biomasses are much higher
at the northern sites.
Figure 4. Data
from the biomass samples done at the 9 main beaches in
2004 and 2005. A. Species richness
in these samples, divided by trophic categories. B.
Biomass (average per beach) divided by trophic categories,
with two disproportionately large taxa removed (see text). C. Biomass
including all taxa, categorized by surface vs. infaunal
taxa.
Recruitment |
 |
Hypothesis: Sites with higher rates of
recruitment, i.e. colonization of the shoreline by larvae
and spores of marine animals and plants, have higher
diversity.
Results: i) There is no north-south gradient in recruit
richness.
Figure 5. A. Number
of taxa of recruits found per site on each sampling date.
The value for each site is the mean and s.d. from the 3
beaches per site; each beach value is the average among
the 5 replicate sleeves. Only
one sediment type (Coarse) was used at Brown. B. Number
of individual recruits found per sleeve on each sampling
date. Means and s.d. calculated as in A. Values do not
include those of the very abundant polychaete Armandia
brevis.
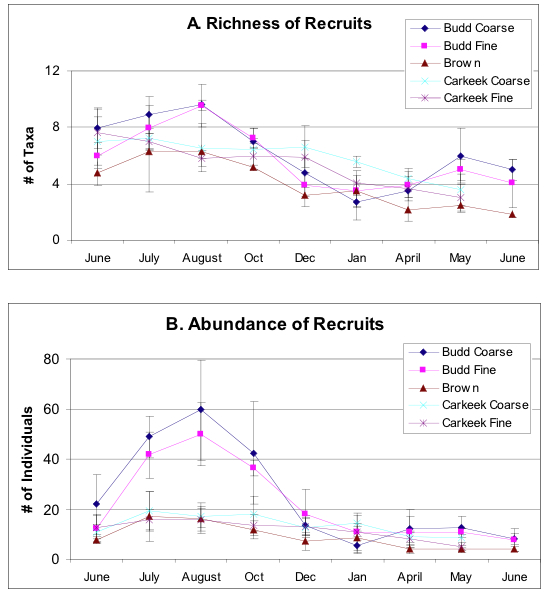
Figure 6 . A. Richness
of recruits found per beach in June 2005, with all 9 beaches
and 2 sediment treatments illustrated. Values are mean
and s.d. per beach among the 5 replicate sleeves per beach. B. Total
(summed) numbers of recruits per site on each sampling
date, categorized by trophic position (see Table 1). Sediment
treatments are pooled per beach.
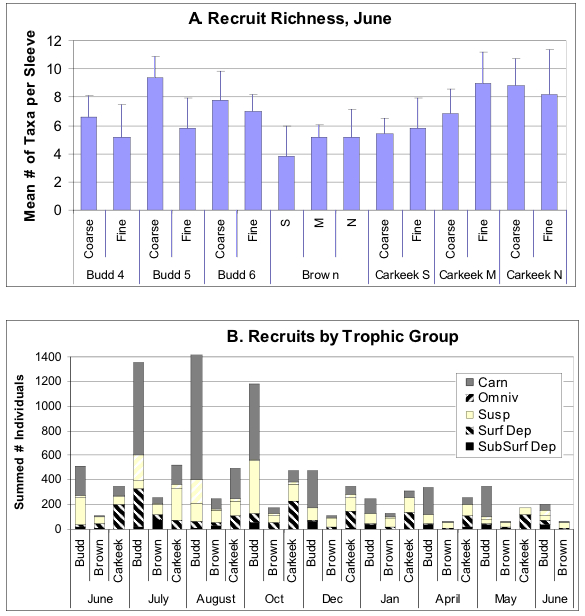
Table
1. Taxa identified as
lifestyle categories. In Trophic, Carn = carnivore, Omniv
= omnivore, Susp = suspension
feeder, Surf Dep = surface deposit feeder, Sun Surf Dep
= subsurface deposit feeder.
Shoreline Sediment Size
Hypothesis:
Sites with more fine sediments (i.e. more sand and mud,
fewer pebbles and cobbles) increase recruitment of organisms
that live in sediment but reduce recruitment of surface
species.
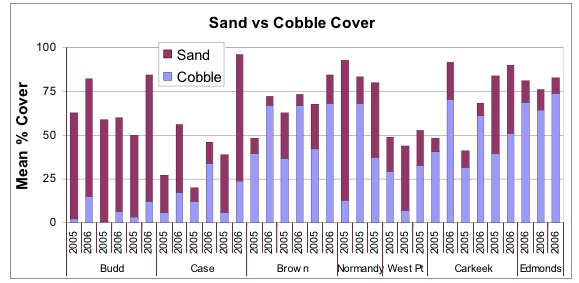
Results: i) South sites have fewer cobbles and more sand on
the surface. When cobbles are excluded however the sediment
sizes do not show a clear north-south pattern (e.g. Budd sites
don't really have more fines. ii) The south most site (Budd)
did however have the highest infaunal recruitment (See Figure
5 B).
Note:
Data on recruitment of surface species is still being analysed.
Figure 7. Percent covers
of surface sand and cobble in the years and beaches where
both these parameters were measured. All beaches are shown
from south (left) to north (right) (e.g. Normandy South is
the left-most of the 3 Normandy bars).
Predation
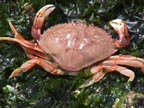 |
Hypothesis: Predation by a variety
of consumers, especially crabs and fishes, is higher
at the south sites than the north, reducing both diversity
and abundance of clams that recruit to these beaches.
This predation in the south is severe enough to result
in few clams (and other infauna) surviving for as long
as a year.
|
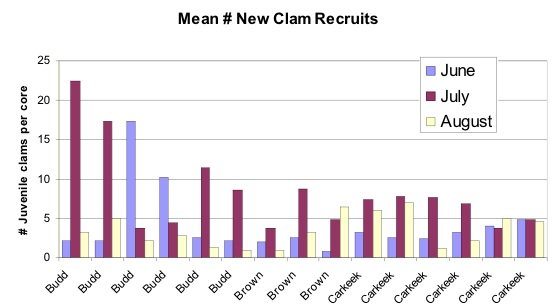
Results: i) There was a high mortality rate of clam recruits
at southern sites. ii) Sediment cores with mesh tops to prevent
predation did not increase juvenile clam richness.
Figure 8 . Mean number
of new clam recruits per sediment core at each site from
June through August.
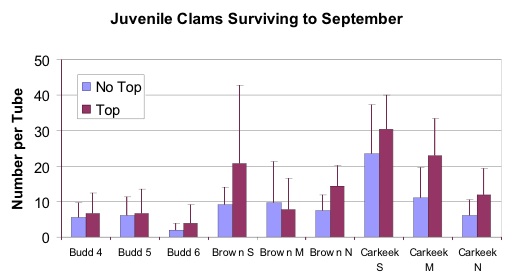
Figure
9. Number of juvenile clams survivng
until September in sediment
cores with (to keep out predators) and without mesh tops.
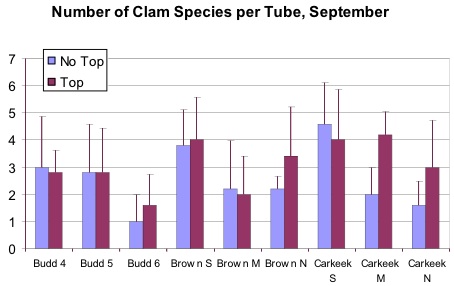
Figure
10. Clam diveristy
per tube survivng until September in sediment cores with
mesh tops (to keep out predators) and without mesh
tops.
Physical Stresses
Hypothesis: Relatively subtle increases in physical
stresses, especially from higher temperatures and lower
salinities, reduce survival of newly recruited organisms
on the southern beaches, resulting in lower diversity and
biomass of organisms there.
Note: We have not performed physiological
experiments on survival of young clams under different physically
stressful regimes; this research will necessitate detailed
lab experiments. Rather, we correlated differences in survival
and growth of clams among beaches with physical differences
among beaches, and also studied the timing of loss of young
recruits (e.g. over the course of the summer, in the predation
experiment).
Results: i) Nearshore temperatures are higher
and more variable at southern sites. ii) Beach surface temperatures
are higher and more variable at southern sites. iii) Nearshore
salinity is lower and more variable in the south Puget Sound.
iv) Beaches in south Puget Sound experience more extreme
temperatures and salinities, but it is subtle
Figure 11. Temperatures
from 3 sets of Tidbit dataloggers at each beach. Points
are weekly averages. Sediment Tidbits (panel C) were removed
earlier than the other sets.
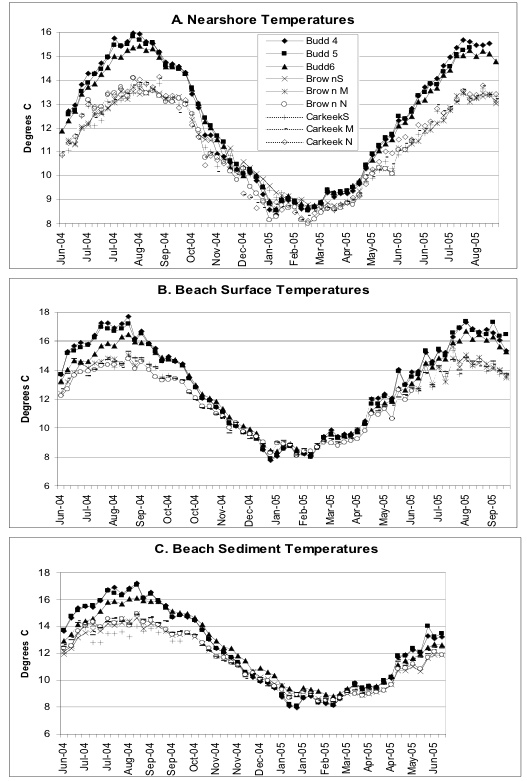
Figure 12. Porewater temperatures
and salinities at all 9 beaches during June sampling periods.
Data were taken in 3 holes dug per beach (at MLLW); values
given are averages among these 3 holes.
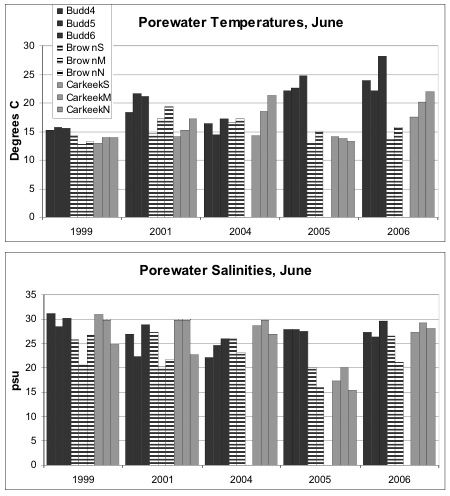
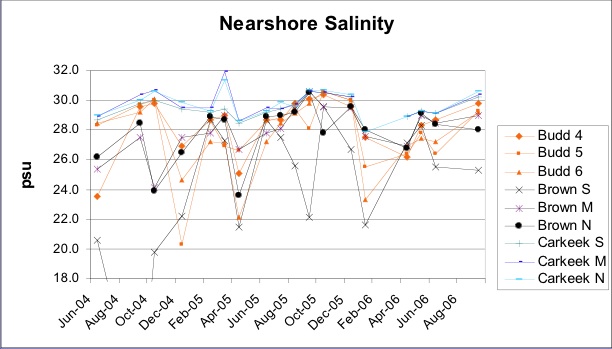
Figure 13. Nearshore salinities
measured just offshore of each beach approximately every
6 weeks over 26 months.
|