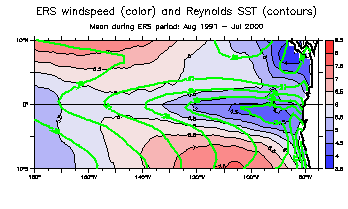
 Figure 1
The advent of satellite scatterometer winds has shown a previously-unknown pattern of wind stress curl in the near-equatorial east-central Pacific. Southeasterlies blow over the cold tongue, then across the SST front just north of the equator. SST cooling tends to isolate the boundary layer from stronger free-atmosphere winds aloft, leading to lower wind speeds over the cold tongue, then windspeed increases passing the front as vertical mixing is enhanced (Wallace et al 1989) (Fig. 1).
Click the reduced image to see it full-size.
 Figure 1
Because the winds in this region have a nearly-constant (southeasterly) direction, thus a particular tilt relative to the SST front, the speed changes produce a mean curl and divergence signature as well. This effect may be amplified because the front is distorted into cusps by the tropical instability waves (Chelton et al 2001) (however, the TIW are not required, and the same mean curl and divergence would occur if the SST front were always straight). The curl becomes negative approaching the cold tongue from the south, then positive over the SST front. A narrow, zonally-oriented band of positive curl lies over the SST front (Fig. 2, middle). By contrast, the comparable curl from FSU winds is negative over the entire eastern equatorial Pacific (Fig. 2, top).
Click the reduced image to see it full-size.
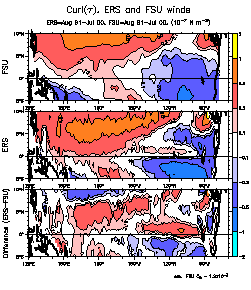 Figure 2
(Same figure 30°S-30°N)
This zonally-banded mean curl difference integrates west to produce a systematic difference in the Sverdrup streamfunction (negative curl produces positive streamfunction and vice versa).
Click the reduced image to see it full-size.
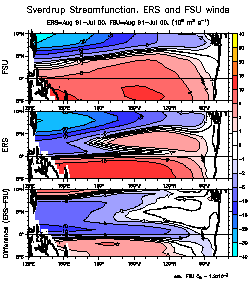 Figure 3
(Same figure 30°S-30°N)
While the FSU winds show only bland streamfunction gradients near the equator, implying relatively weak integrated transports, the ERS winds have strong streamfunction gradients near the equator (Fig. 3). The blandness of the FSU-derived streamfunction has been a question for a long time. One explanation has been that the EUC and SEC roughly cancel each other out in the vertical integral (I offered this during my PhD defense in 1989), but this does not account very well for the region just north of the equator (where westward surface flow increases to the north while eastward subsurface flow decreases. Even if the equatorial transports cancel, those just to the north should be strongly westward). Zonal transports found from the Sverdrup streamfunction (U=–d(Psi)/dy) (Fig. 4) are weakly eastward north of the equator from the FSU winds, but in the ERS winds have a narrow band of westward flow along about 2°N. This westward flow is entirely due to the positive curl associated with the windspeed change as southerlies pass across the SST front.
Click the reduced image to see it full-size.
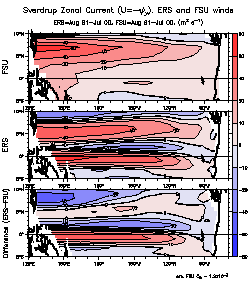 Figure 4
(Same figure 30°S-30°N)
The Johnson CTD/ADCP data set (Johnson et al, 2001; derived principally from TAO mooring cruises) describes the 3-dimensional structure of the SEC(N). The SEC(N) extends remarkably deeply into the water column (Fig. 5). Geostrophy may thus be preferable because the ADCP only reaches to about 400m. These meridional sections of ug show that westward shear is found all the way to the bottom of the gridded CTD fields at 900m. East of 140°W the SEC(N) is divided into two bands at roughly 1°N and 3.5°N (Fig. 5 or Fig. 6, bottom). Maps of ug at 0, 300 and 600m show that SEC(N) flow is greater than 2 cm/s even at 600m.
Click the reduced image to see it full-size.
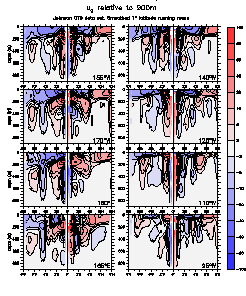 Figure 5
Vertically-integrated zonal transport found geostrophically agrees reasonably well with that found from the shipboard ADCP (fig. 6, middle and bottom panels). A well-defined vertically-integrated SEC(N) is found from about 1°N to 4°N east of about 170°W; the ADCPs show a ribbon of minimum eastward flow separating the NECC from the EUC all the way to 143°E, while Ug has actual westward transport at 2°N in the far west. These observed transports also agree with the Sverdrup transport from the ERS winds in showing a strong SEC(N) in the same location (Fig. 6, top), but not at all with that from the FSU winds (Fig. 4, top).
Click the reduced image to see it full-size.
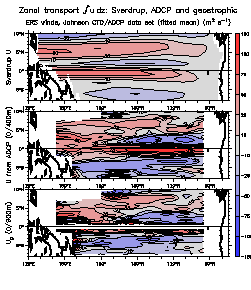 Figure 6