This is a miscellaneous list of figures that I put here instead of wasting paper that would only disappear under a pile on my desk until I eventually recycled it. It's easier to rootle through a pile of electrons.
Some things related to the heat balance at 170°W
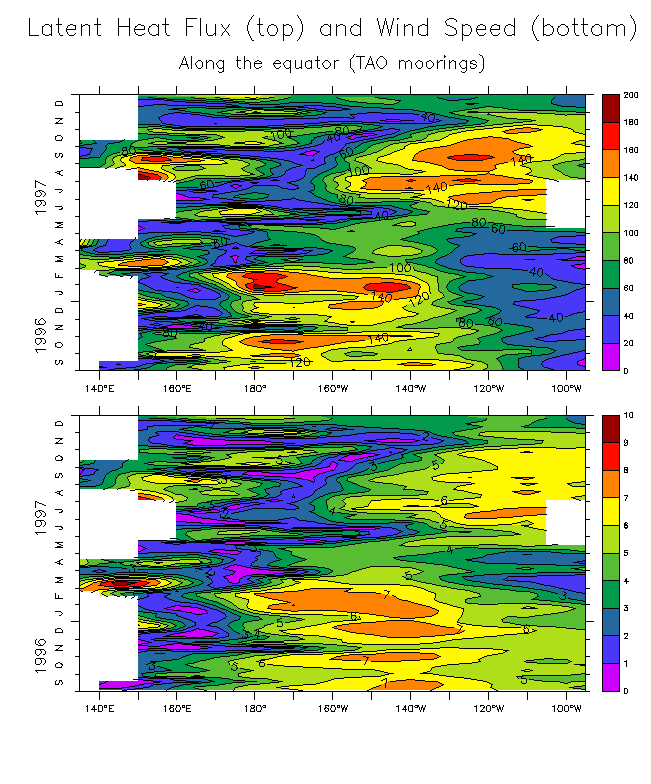
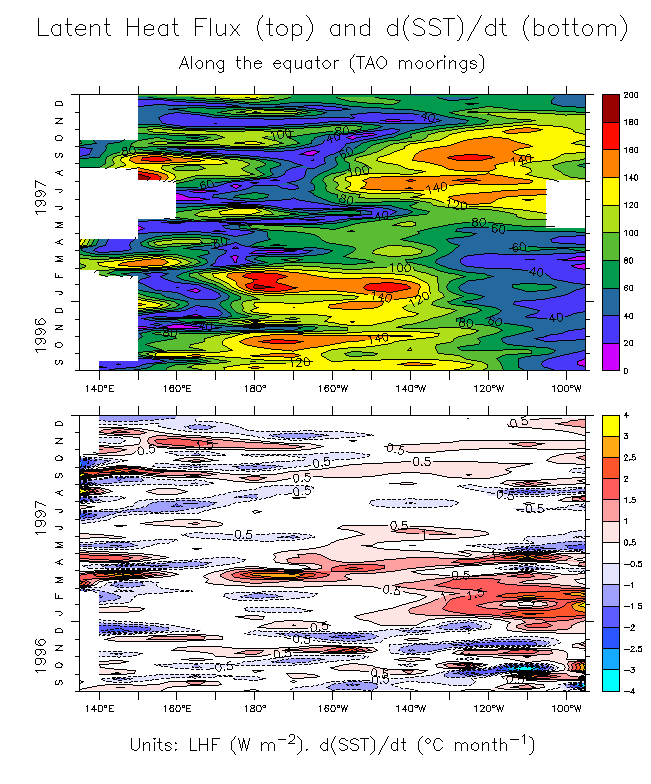
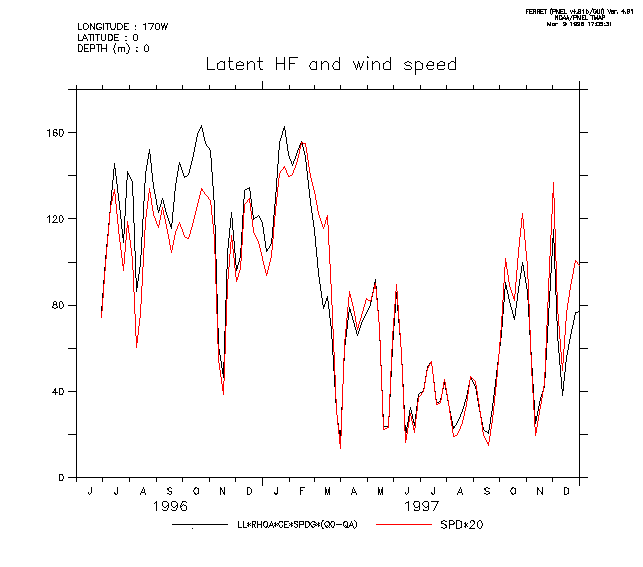
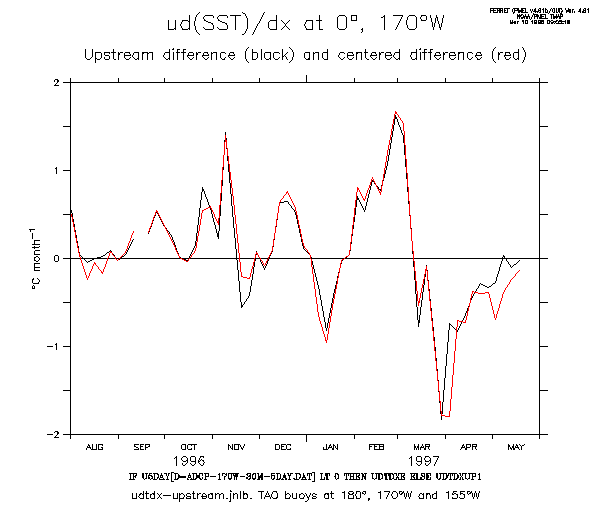
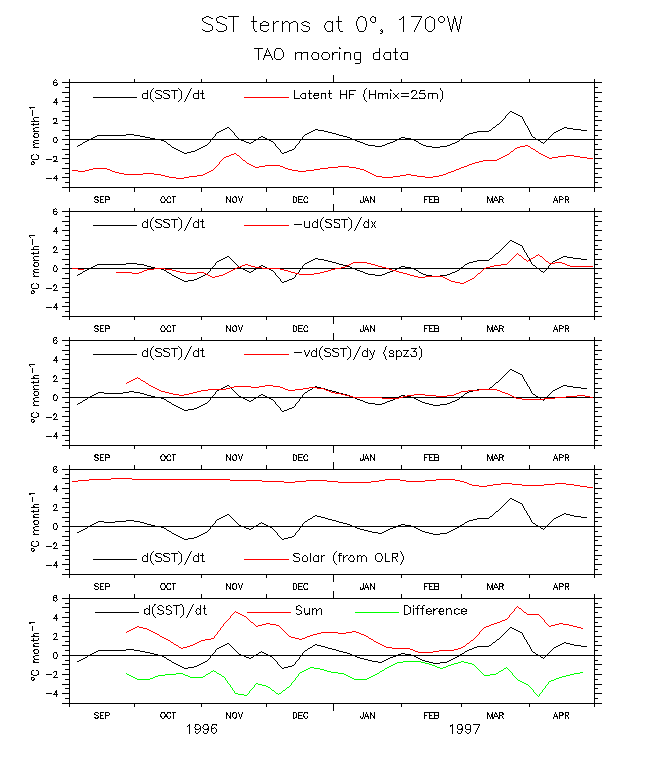
A few figures I saved while checking ways of doing the heat balance. Only figure 5 is probably of interest to anyone but me.
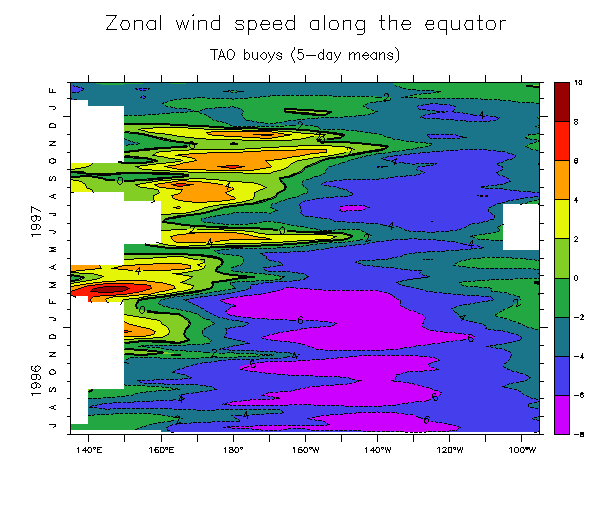
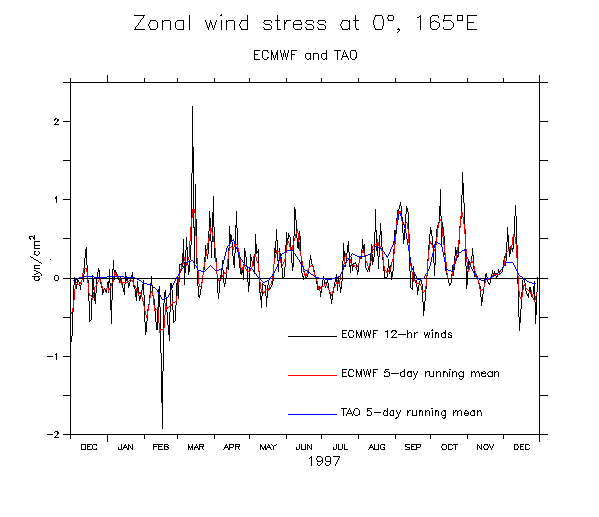
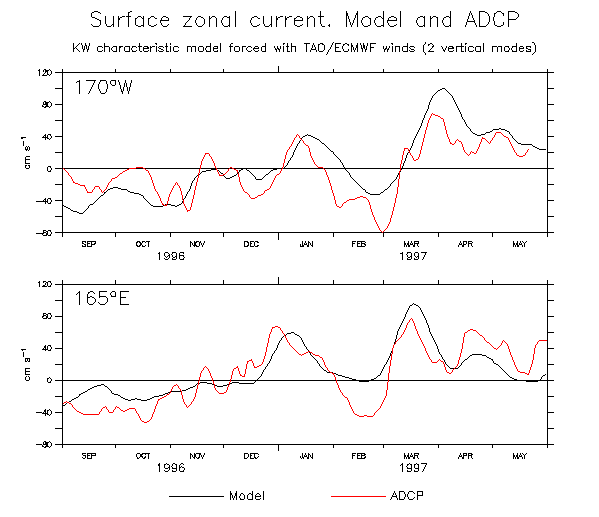
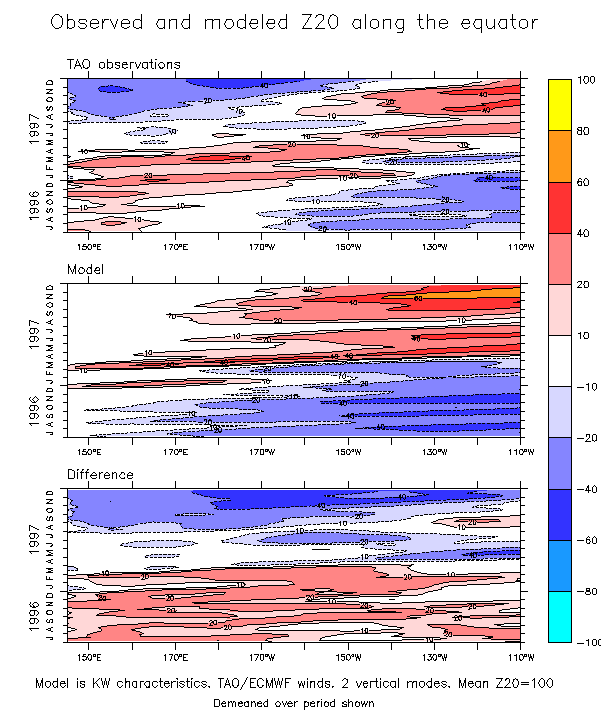
These show some results of an extremely simple Kelvin wave characteristic model that was used to look at intraseasonal Kelvin waves during the 1991-92 El Niño (Kessler and McPhaden, 1995; J.Climate). The model simply integrates Tau-x along the Kelvin wave characteristics. Since during the onset of the 97-98 event some of the westerly winds were found west of the TAO array, particularly the first westerly event in Dec 96 (Fig 1), I used ECMWF winds to fill in the white spots and west to 135°E. Fig 2 shows that this filling probably isn't too bad.
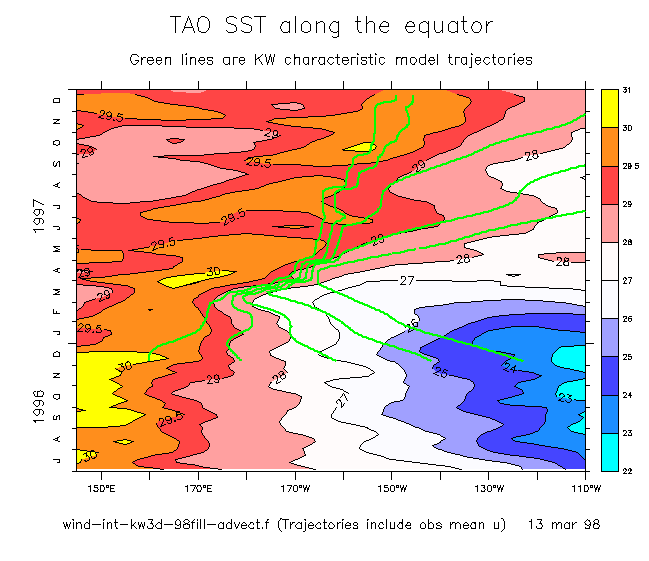
Figs 3-6 compare the model with various observed quantities. The real aim of this exercise is to see whether zonal advection due to intraseasonal Kelvin waves accounted for the steppy eastward advance of SST. The velocities themselves (Fig 3) aren't bad. Fig 6 shows that zonal advection probably had a lot to do with the SST advance. (But Fig 5 of the first set of figures shows that looking in detail at the terms of the SST balance gives a much more ambiguous picture, and that other terms also contributed).