Evaluating the Accuracy of Gridded
Satellite Wind Vector Maps
We evaluated several QuikSCAT based vector maps of near surface
winds, stress and pseudostress with respect to winds at the
research mooring from CLIMODE and from the KEO mooring near the
Kuroshio Extension in the North Pacific. The analyses were done
with the versions of the products listed below that were available
in May 2010.
The evaluations focused on the accuracy of the wind product in
reproducing the anemometer wind anomalies. An additional
goal was to determine the temporal and spatial resolution of the
product in comparison with the product's grid. We also show a
comparison of the temporal means.
| Product Name | Variable | Temporal Grid | Spatial Grid | Color (plots) | Source |
| Kelly & Dickinson | Wind |
daily | 1/2o | cyan | suzanne@apl.washington.edu |
| Ifremer | Wind | daily | 1/2o | blue | ftp.ifremer.fr |
| NCEP2 Reanalysis | Wind | daily | gaussian, ~1.9o | gray | ftp.cdc.noaa.gov |
| ECMWF | Wind | daily | gaussian, ~1.1o | orange | http://dss.ucar.edu/datasets/ds111.1/ |
| Tang & Liu | Wind | 12-hourly | 1/2o | purple | http://airsea-www.jpl.nasa.gov/seaflux/ |
| CCMP | Wind | 6-hourly | 1/4o | magenta | http://podaac.jpl.nasa.gov/ |
| Milliff | Wind | 6-hourly | 1/2o | green | http://dss.ucar.edu/datasets/ds744.4/ |
| NCEP2 Reanalysis | Wind | 6-hourly | gaussian, ~1.9o | black | ftp.cdc.noaa.gov |
| Kelly & Dickinson | Stress | daily | 1/2o | cyan | suzanne@apl.washington.edu |
| Ifremer | Stress | daily | 1/2o | blue | ftp.ifremer.fr |
| COAPS | Pseudostress | 6-hourly | 1o | olive | http://coaps.fsu.edu/scatterometry/ |
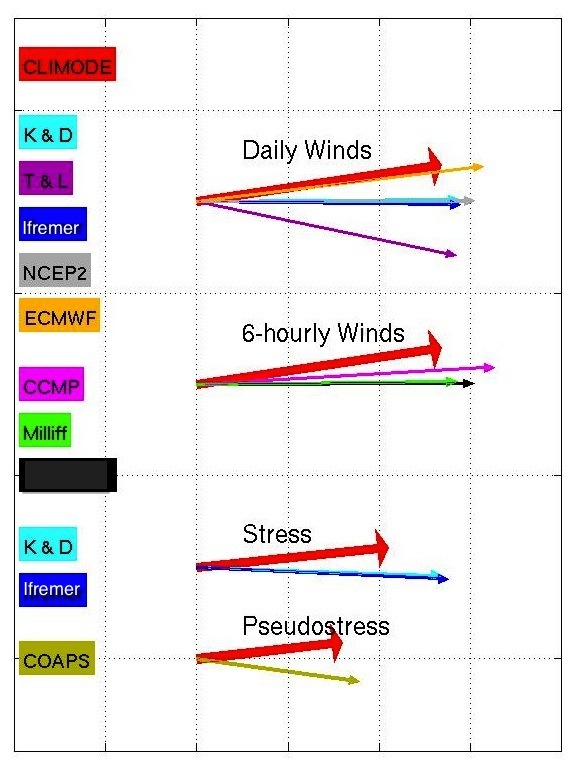
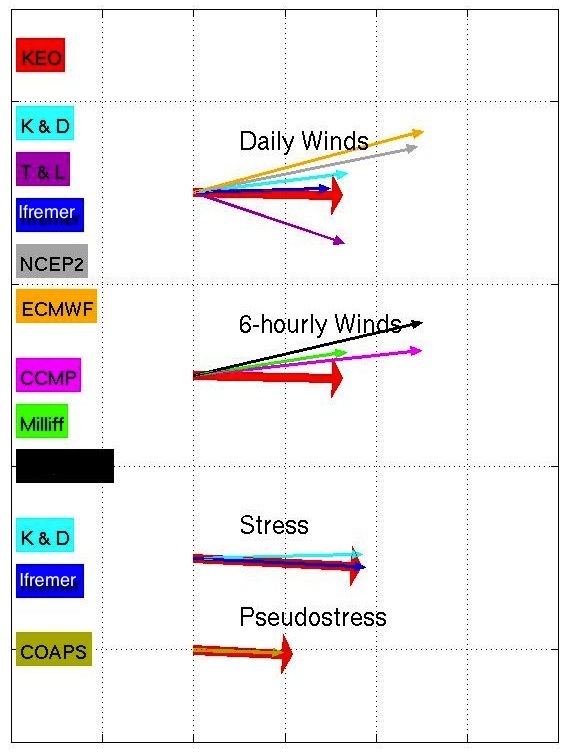
Comparison of the mean vectors (wind/stress/pseudostress) from CLIMODE (elft) and KEO (right) anemometers. The product vectors below are shown in four groups from top to bottom: daily wind, 6-hourly wind, stress and pseudostress. The Tang & Liu product is in the daily wind group. The colors are the same as indicated in the above Table.
|
|
| Mean vectors at CLIMODE Mooring | Mean vectors at KEO Mooring |
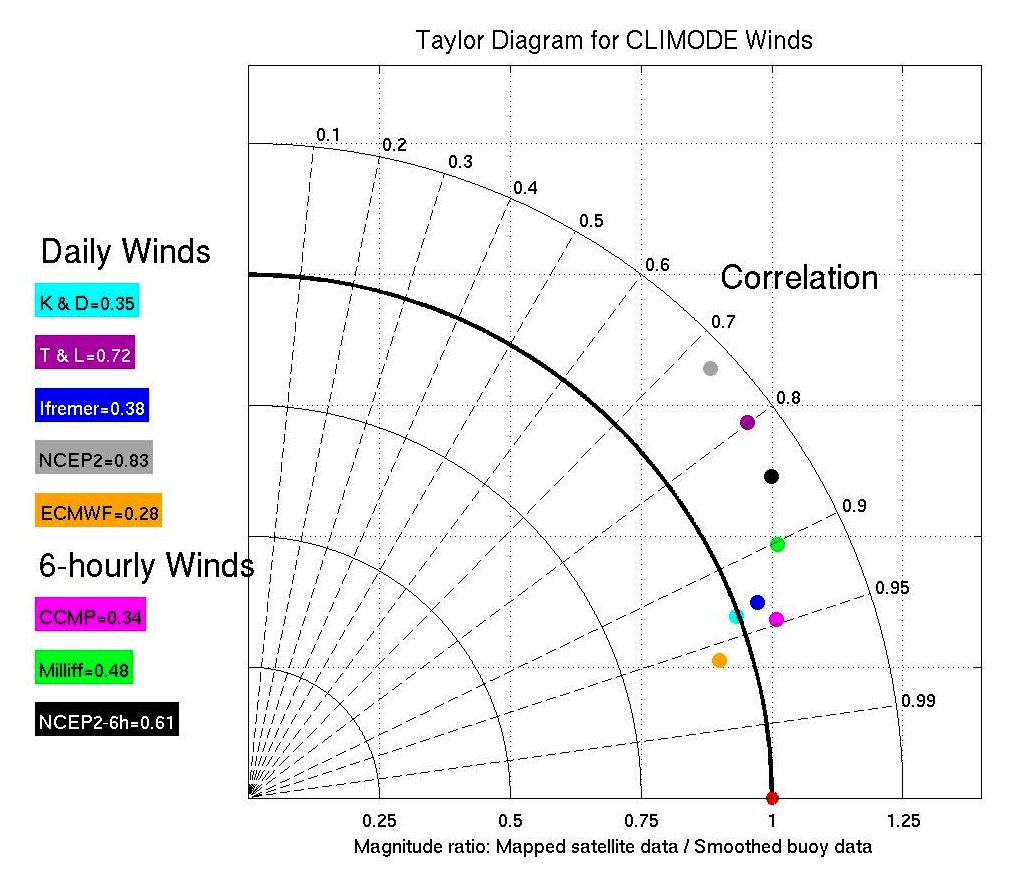
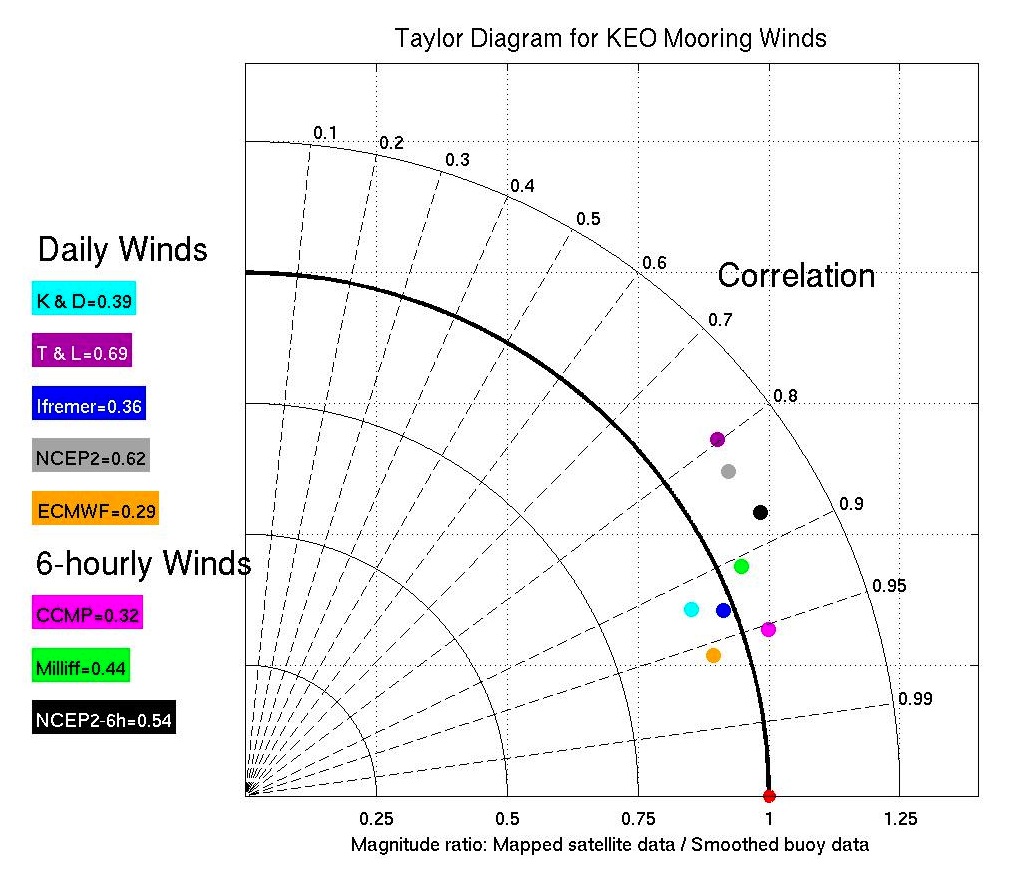
We use a Taylor diagram to
compare the products with the "truth," here, the anenometer
mooring winds. For the correlations we use the magnitude of the
complex correlation between vectors. The complex correlations also
give a mean angle difference for the product relative to the
anemometer anomaly (not shown here). The distance between the
color dot for each product and the red dot on the x-axis is the normalized
error, a simple measure of the accuracy of the wind product
anomalies. For the CLIMODE comparisons the best products are
EDMWF, K&D, Ifremer and CCMP. Results are similar for wind
products at KEO, except that the Milliff product is similar to the
other four products. The T&L and both NCEP products have
magnitudes that are too large and lower correlations.
 |
 |
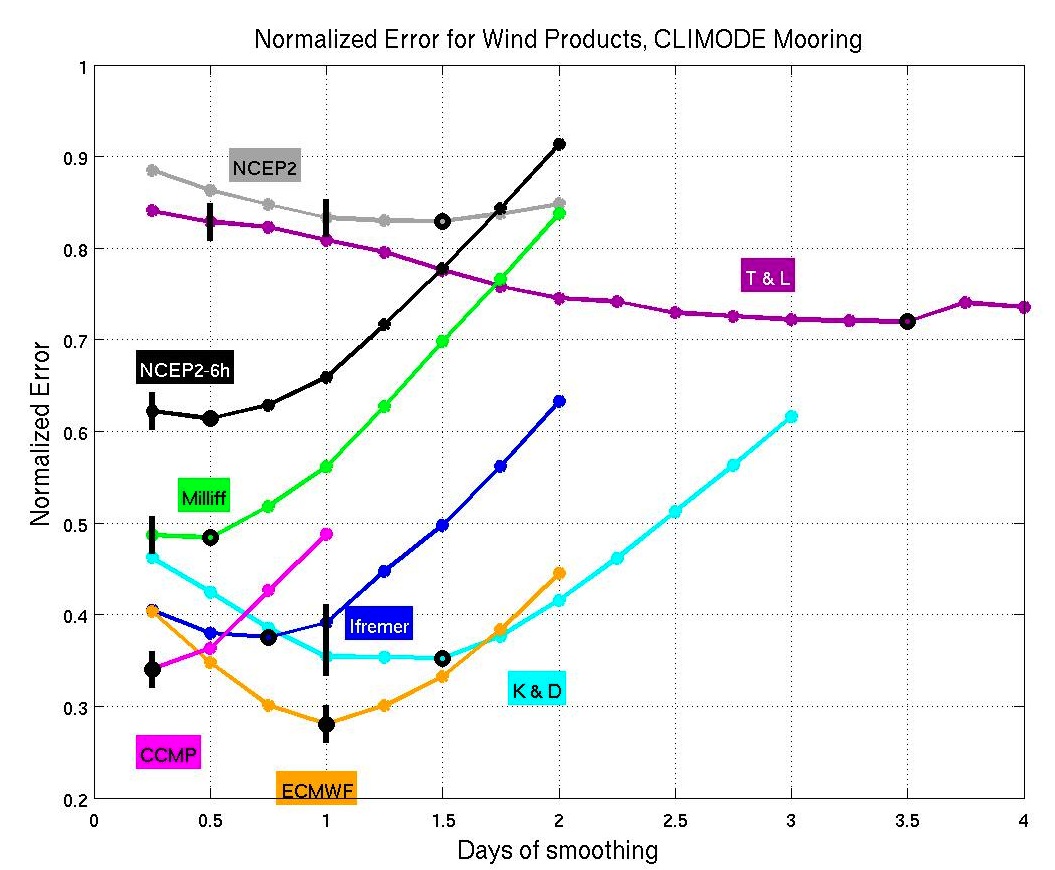
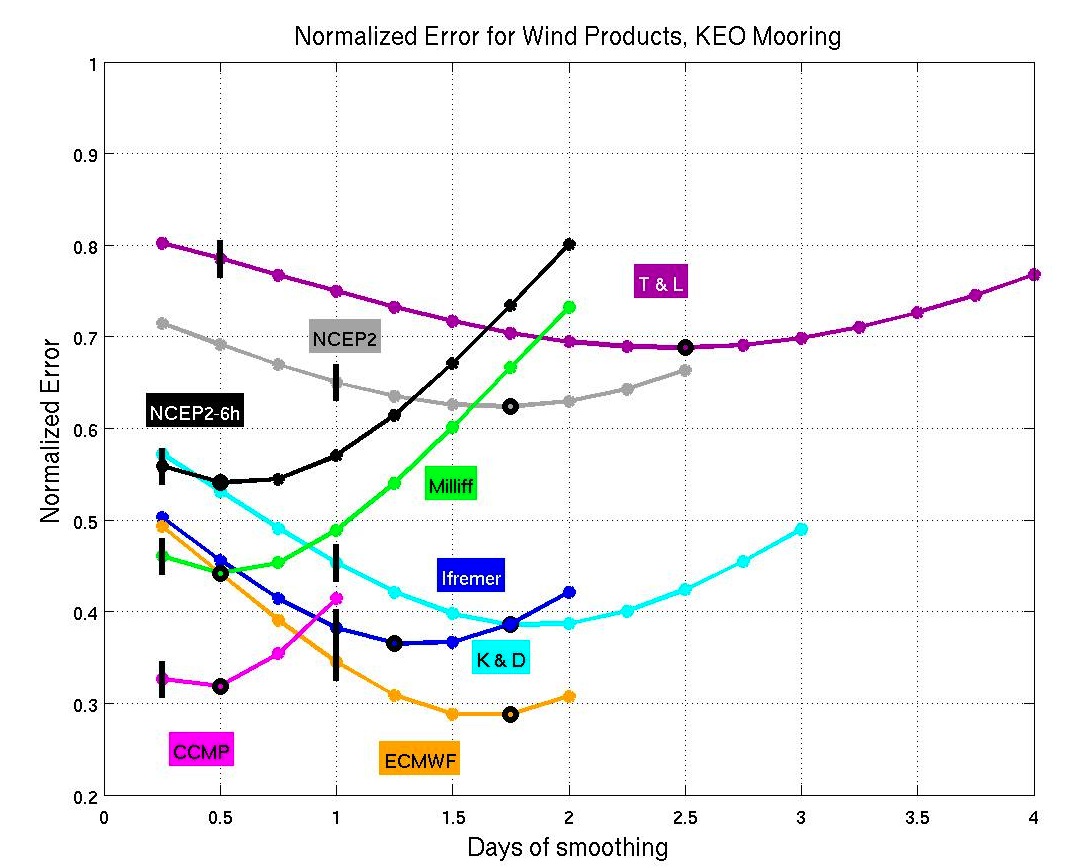
Wind products have a fixed temporal grid,which is often
(incorrectly) assumed to correspond to the temporal resolution of
the fields. To find the actual product temporal resolution, we
computed the normalized errors relative to smoothed anemometer
winds. The amount of smoothing required to attain a minimum in
normalized error is a measure of the product's actual temporal
resolution. By this test ECMWF products attain the lowest errors
when compared with anemometer winds smoothed over one day for
CLIMODE; CCMP has a temporal resolution of 6 hours, consistent
with its grid, somewhat lower for KEO. The K&D winds have a
temporal resolution between 1 and 2 days for either site.
The T&L winds have a temporal resolution of 2-3 days, compared
with its 12-hr grid. The accuracies are consistent with the
results above: CCMP, Ifremer, K&D and ECMWF have the lowest
errors overall.
 |
 |