Basic Plotting in IDL
This exercise is intended to go through basic commands in IDL to make basic plots, sort data based on specific parameters, and make a for-loop.
Datafile for assignment:
idlplot.dat
To start IDL, open up a terminal window. Then type IDL in the command line.
Before we start doing any work, I'll list the most useful command in IDL, the "?"
? : The ? opens up the IDL help window, allowing you to search through the manual and the list of commands. This should be your first step on anything if you get stuck.
readcol : This reads in the columns of the file you want to use. You want to specify the filename after readcol, and then all the column names so you can call them later on. An example of the basic format, using the datafile. Remember, our file has 3 columns, a/b/c in order, so:
readcol,'idlplot.dat',a,b,c
Now we want to try and plot our data. The command to plot things is...plot, you guessed it. We have to tell IDL what our variables are, and we can also tell it how we
want our axis labeled, or what color we should use. Let's try plotting column B versus column A:
plot,a,b,title='B vs. A', xtitle='A',ytitle='B',color=250
Your plot should look like this:
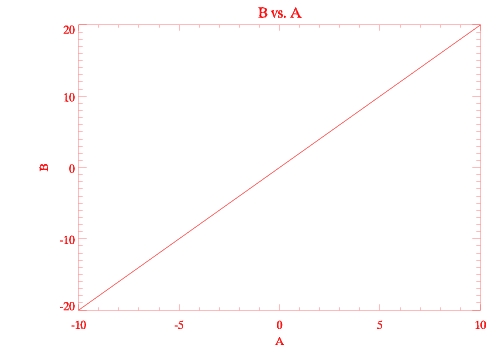
If you notice, we have to read our "X" variable first, then Y. To add commands, we just add a comma and then add whichever command we want. For colors, it is done by a number system, with 250 being red. You can find a complete list of the colors by typing in "?" into idl, and then typing in color in the search window. You can also change the symbol used to plot the data, using the "psym=#", where # is any number 1-10. Use the "?" help feature, and type in plot to get a complete list of commands.
Another command that you are going to use a lot is the "WHERE" command. Using this command you can restrict your data to certain ranges. Looking at our column A, it runs from 0 to 15. If we wanted to pull out just the numbers between 5 and 10, we could do something like this:
arevised=where(a ge 5 and a le 10)
ge stands for greater than or equal to, and le stands for less than or equal to. "a" is the column name that we are restricting, and the arevised is just the title for this restricted data. You can also use this command to count the total amount of numbers/elements in your restricted data. You can also restrict one column and use data from the other columns that match up with your restricted columns data. Examples of this:
arevised=where(a ge 5 and a le 10,countsa)
brevised=b[arevised]
What this does is whichever row for A contains the numbers between 5 and 10, it restricts column B to those same rows. This is very important for our other exercises, where if one column is a certain number, we want the output of another column in the same row.
Print: this command outputs your request into the IDL terminal window. The syntax looks like this:
print,a
This prints column A into the terminal. Or if we use an above example, and want to print out how many numbers are in our restricted data, we could do this:
print, countsa, brevised
This should return the number "6", telling us that there are 6 numbers in our restricted data set (which happen to be 5,6,7,8,9,10), and then the B column that corresponds to our restricted range. Just as an asise, you can name your restricted range variable whatever you want, but you want to be careful not to override your original column-
a=where(a ge5 and a le 10)
Doing this will override the original a variable, so you wont be able to use the old data anymore. This is why i added the revised to the end of the variable name, but it can be anything you want.
The next page will take about writing these commands into a program, making a for-loop, and then outputting our plots to files.