Finding the distance
The H-R diagram
The H-R diagram (or color-magnitude diagram) is a standard tool astronomers use to analyze star clusters. With it, we can study many different characteristics of clusters, such as distance.
To construct an H-R diagram, we use the apparent magnitudes of the cluster’s stars in several different filters. Astronomers usually use the Johnson “B” (blue) and “V” (visual) filters, but since we are working with data from Sloan, we will use the r, g, and i filters. Fortunately, we already have the data we need, so we can go straight to plotting. Below is an H-R diagram of the globular cluster M3, obtained by plotting r vs g-i. Labeled on the graph are several important features: the main sequence, the main sequence turn off, the supergiants, and the giant branch. However, the main sequence turn off is what we are most interested in.
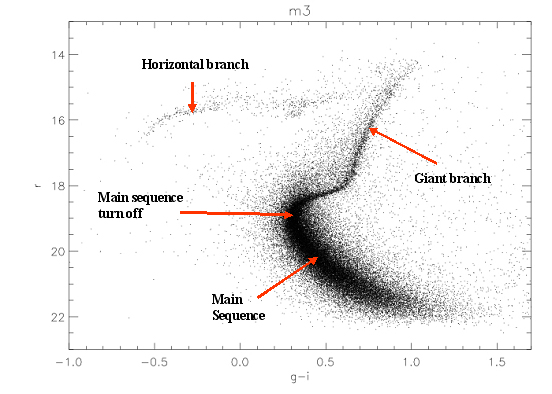
The main sequence turn off is defined as the point where stars turn off the main sequence (obviously) and begin the end of their life. On the H-R diagram of M3, we can see that the turn off point is where stars begin veering off to the right. What we want are the “r” and the “g-i” values of the turn off point. There is no exact point where the stars turn off the main sequence, so we'll have to estimate. Looking at M3, we find the turn off point has an apparent magnitude of about 19.25 and a g-i value of about 0.3.

Figure 3: H-R diagram of M3. The main sequence turn off has an apparent value of r = 19.25, and a g-i value of 0.3.
Remember that apparent magnitude, absolute magnitude, and distance are related by the equation
M - m = 5·log(d) - 5where m = apparent magnitude, M = absolute magnitude, and d = distance in parsecs. We have the apparent magnitude of the main sequence turn off, and if we can find its absolute magnitude, then we can calculate the cluster’s distance.