
 Next Page
Note: In all figures below, the ‘X’ direction referred to in the figure text corresponds to the ‘Z’ direction in the channel geometry drawing.
Velocity down channel
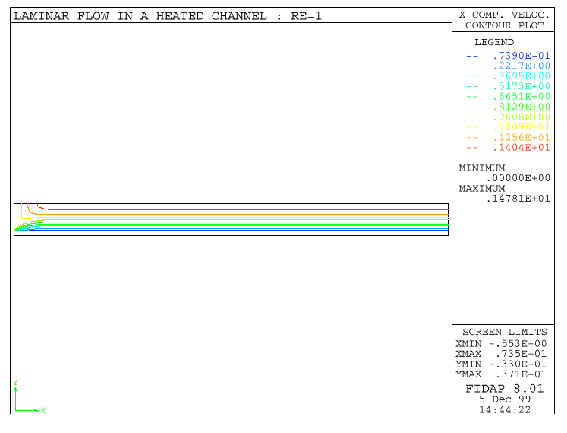
The z-component of the velocity in the channel is shown below in a contour plot:
Note that at the inlet of the channel (far left), all contour lines originate from a single point, which corresponds to the condition of uniform flow rate at the inlet. As the fluid moves down the channel, the parabolic flow profile develops. The fluid along the walls moves more slowly than the fluid in the middle of the channel, as shown by the lines of red (fastest velocity) at the center of the channel and lines of blue (slowest velocity) at the bottom of the channel along the wall.
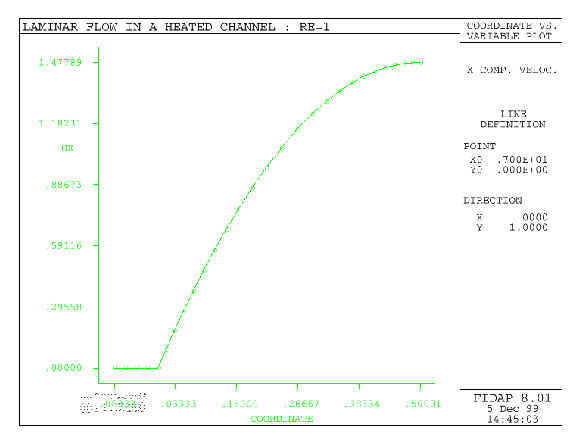
This velocity distribution can be seen in the figure below, in which the z-component of the velocity is plotted against the height of the channel (y) at the channel outlet:
The flow is uniform within the walls, as expected, and then gradually increases to a maximum velocity at y=0.5 (center of the device).
The contour plot also shows that the velocities reach a constant distribution soon after entering the device.
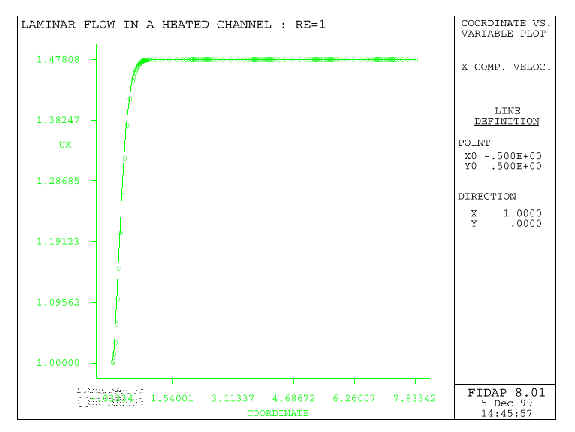
The time to reach a constant velocity distribution can be better seen in the figure below, which shows the z-component of the velocity at the upper wall (y=0.5) vs. distance down the channel.
Consumption of ammonia
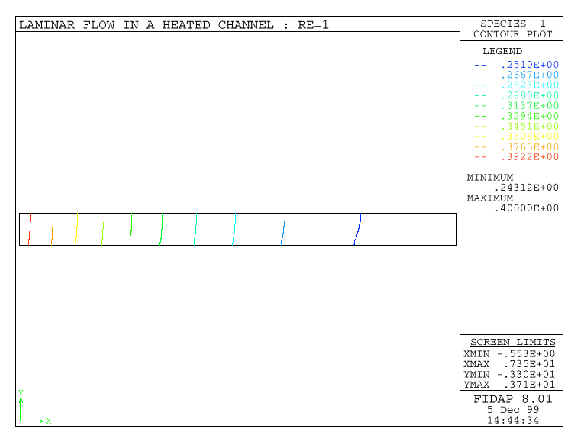
Recall that only the first of the three reactions described earlier is modeled in Model 4 and that ammonia is the only species tracked. So, to monitor the extent of reaction, we monitor the decreasing concentration of ammonia down the channel, as seen in the contour plot below. Note that the color goes from red (maximum concentration) to blue (minimum concentration) down the channel, as expected.
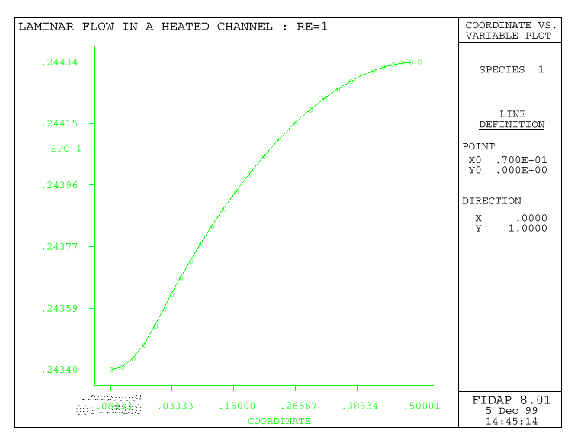
As with the z-component of the velocity, as the fluid moves down the channel, the ammonia concentration is not uniform along the y-direction. This non-uniformity is due to both the parabolic flow profile and to diffusion-limited transport, since the ammonia consumption occurs only at the walls. The figure below, which shows the concentration of ammonia is plotted vs. height of the channel (y) at the channel outlet, demonstrates this non-uniformity.
The concentration of ammonia should be zero from y=-0.8333 to y=0, since that’s the wall, but it’s not. This irregularity is due to errors in model construction.
Temperature
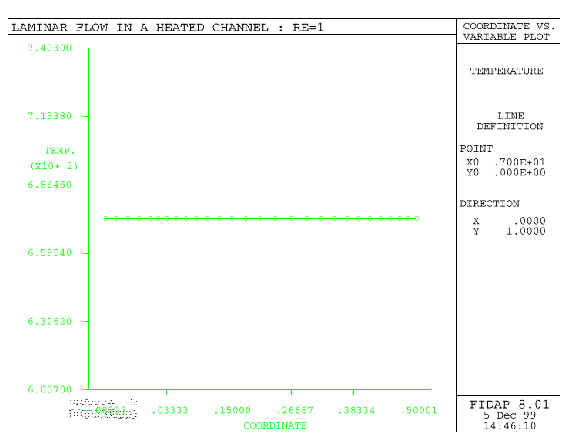
Since the standard model does not include any heat generation, the temperature in the reactor remains constant, as seen in the figure below, which plots temperature vs. height of the channel (y) at the channel outlet: