Reading: AB, chapter 7, section 4.
Increase in the nominal money supply (M)
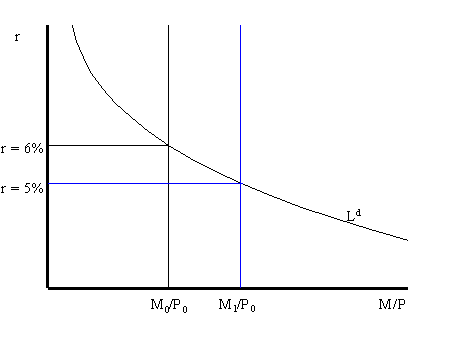
Consider the money market initially in equilibrium at r = 6% as illustrated in the above graph.. Suppose the Fed increases the nominal money supply by an open market purchase of government bonds. This increases the money supply from M0 to M1. Holding the price level fixed, this increases the supply of real balances from M0/P0 to M1/P0. If the real interest rate stays at 6% then the supply of real balances will be greater than the demand for real balances: there will be an excess supply of money in the money market. Consequently, individuals will try to get rid of the excess money by buying bonds which puts downward pressure on the real interest rate (holding expected inflation fixed). As r drops we move along the liquidity demand curve toward the new equilibrium at r = 5%.
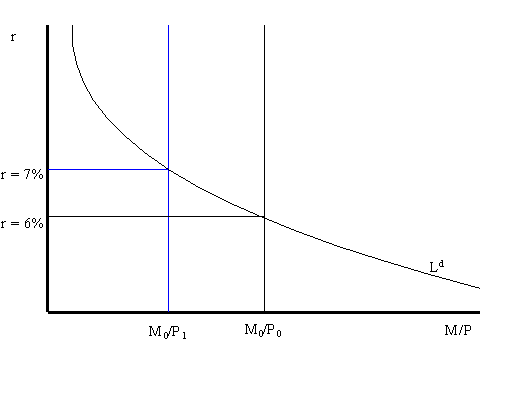
Consider the money market initially in equilibrium at r = 6% described in the graph below. Now
suppose that the aggregate price level increases from P0 to P1. Holding the nominal money supply
fixed, this reduces the supply of real balances from M0/P0 to M0/P1. If the real interest rate stays
at 6% the supply of real balances will be less than the demand for real balances: there will be an
excess demand for money. The excess demand for money will prompt individuals to sell bonds
(demand for bonds falls) and so the real interest rate on bonds will rise. As r rises, we move up
along the liquidity demand curve toward the new equilibrium at r = 7%.
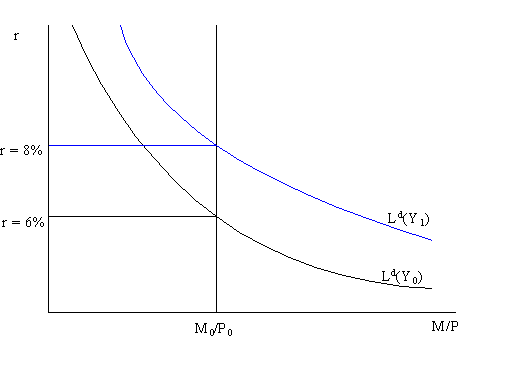
Consider the money market in equilibrium at r = 6% as illustrated above. Suppose that current income (Y), which is the same as current output (GDP),. Increases from Y0 to Y1. This increases the transactions demand for money as so the real money demand curve shifts up and to the right. If the real interest rate stays at 6% there will be an excess demand for money which puts upward pressure on the real interest rate. As r increases, we move along the money demand curve up towad the new equilibrium at r = 8%.