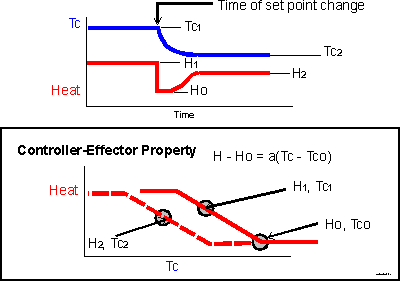
Let's look at what happens when set point does change.
Suppose that the system starts in equilibrium at Tc-one, where the error signal resulted in the heat output level H-one. Then you drop the set point, shifting the curve to the left -- the dashed line in the lower panel. Now the system is out of equilibrium, because the temperature is still at Tc-one, but the heat output associated with Tc-one is now reduced.
Consequently, temperature will fall. A progressively greater error signal will develop relative to the new set point and a new equilibrium will be approached. I have indicated the equilibrium heat as H-two. Note: these points H-one, Tc-one, H-two and Tc-two are not intended to represent the same points as in the illustrations in previous pages.

In the upper panel, you will notice that the pattern of temperature change is nearly the same as illustrated on the previous page, particularly in the equilibrium levels. The effect of a set point change can look just like the effect of a change in thermal load. However, the record of effector output is quite different. You could infer from it where the threshold is, especially if a distinct period of baseline level is established for a while.
So, with this level of system complexity, you could expect to identify a set point shift from the effector response pattern especially if you were sure that the thermal load had not changed. The change in equilibrium temperature is pretty near to the change in set point temperature.
But if you are looking at the system from outside and
1. you see an altered equilibrium temperature and some associated changes in
effector state
and
2. you are inclined to say that the difference in equilibrium temperature reflects a difference in set points
you are overlooking the possibility that another equally important parameter of the system changed. Very nearly the same pattern will result if the slope of the proportional response changes. That is illustrated on the next page