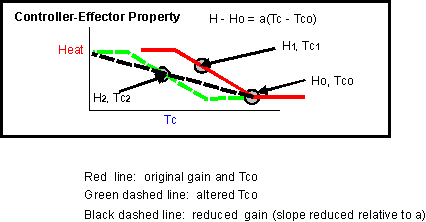
The black dashed line in this graphic represents a change in system properties in which the threshold was unaffected, but the gain, that is, the slope of the proportional response, was reduced. If the graphic is doing its job, it should be clear that the H-two, Tc-two equilibrium point of the previous page (on the dashed green line showing the effect of a threshold, i.e., set point shift) could also be the consequence of the reduced gain shown by the dashed black line. Equilibrium temperature will fall after the gain is reduced because heat output falls pretty much like it did in the previous example of the shift in threshold.

If you are inclined to interpret a change in equilibrium body temperature as due to a change in set point in the context of this simple model, you are allowing the possibility that a parameter of control is actually a variable. Why assume automatically that it is the reference level that varies? Can't it equally well be the gain? How can you tell the difference? You would have to have detailed information on a range of effector output relative to core temperature to make the distinction.
If you are concerned with changes in equilibrium temperature in actual humans, it is even more absurd to single out one parameter that might be changing. Body temperature regulation in humans is at least one stage more complicated than the simple proportional control system illustrated so far in these pages. To start with, our effector systems are influenced by skin temperature as well as core temperature. The next page begins the discussion of proportional control based on input from two sources of temperature information.