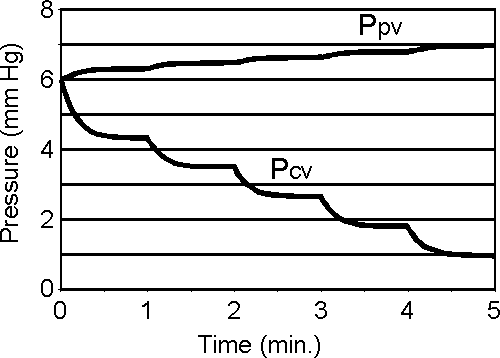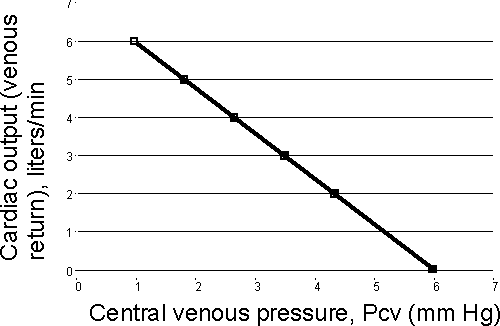


Figure 5. Predicted relationship between pressures and cardiac output.
Upper panel.
Central venous pressure and peripheral venous pressure as cardiac output, initially at zero, is set at levels of 2 (0 to 1 min), 3 (1 to 2 min), 4 (2 to 3 min), 5 (3 to 4 min) and 6 (4 to 5 min) liters/min. Simulation according to model in Figure 4, with resistances Ra and Rv set at 20 and 1 mm Hg per liter/min, respectively. Capacitances Ca, Cpv, and Ccv, respectively, are 0.002, 0.8, and 0.2 mm Hg/liter.
Lower panel.
Data from simulation plotted in the format of a venous return curve. Zero intercept, Pmc, is at 6 mm Hg. Negative reciprocal of slope of line is 0.84 (mm Hg)/(liter/min). Note that this apparent resistance is not equal to the value of Rv chosen for the simulation.