 |
Bioengineering Department, Box 355061, University of Washington, Seattle, WA 98195, USA |
 |
Progress in
|
|
Bioengineering Department, Box 355061, University of Washington, Seattle, WA 98195, USA |
|
Motivation for producing such instruments are:
However, development of such tools requires broadly interdisciplinary research and development, which, in turn, requires very diverse training. We therefore assembled an interdisciplinary team from several departments to carry out this project.
The original project funded by DARPA and Senmed was referred to as the "Portable Stat Lab", the idea of which is diagrammatically presented below. The idea was to create a portable device for use in triage in far-forward military medicine.
|
|
|
|
pH |
Fluorescence |
|
PO2 |
Fluorescence |
|
Bicarbonate/PCO2 |
Fluorescence |
|
Na+ |
Fluorescence |
|
K+ |
Absorption |
|
Cl- |
Absorption |
|
Ca2+ (ionized) |
Fluorescence |
|
Hemoglobins, SaO2 |
Absorption |
|
Bilirubin |
Absorption |
|
Hematocrit |
Flow Cytometry |
|
Leucocyte Count |
Flow Cytometry |
|
Lactate |
Absorption |
|
Glucose |
Fluorescence |
|
Albumin |
Fluorescence |
Miniaturization can buy you more than just the anticipated:
However:
Re is a measure of the ratio of inertial forces to viscous forces
![]() , where
r = density u = a
characteristic fluid speed, l = length (for example, a channel
diameter) h = viscosity
, where
r = density u = a
characteristic fluid speed, l = length (for example, a channel
diameter) h = viscosity
We live in a world in which most of our experience reflect high Re (Re >>1). However, in small channels Re is generally much less than 1, so you get the following conditions:
Microfabricated valves have been a major disappointment for use with particle-laden fluids. However, at low Reynolds numbers microfabricated James Brody has shown that valves are not really necessary. Changes in hydrostatic pressure alone (controlled by external valves) can control flow of fluids without appreciable leakage.
|
|
Shown are fluorescent beads in a 4-way valve. By controlling hydrostatic pressure or flow from off-chip, the amount of mixing from the non-driven channels is kept to an absolute minimum.
|
|
|
From the beginning of the Portable Stat Lab project certain design goals were built into the system. These have influenced our future work . The first was the use of silicon, since we have ready access to Si microfabrication at the Washington Technology Center's Microfabrication Laboratory at Fluke Hall. Optical access is on one side of the modules. All wet connections are made from the back side of the module. The modules are sandwiched between the permanent optical devices and the wet delivery systems. Very precise alignment required for fluorescence and flow cytometer modules. Face-to-face connection with flat gaskets allows far simpler optical and fluid connection technology |
|
|
|
|
|
The H-Filter™ embodies aspects of Field Flow Fractionation as developed by the late J. Calvin Giddings of the University of Utah. It can be used for extraction of molecules from blood (and other particle-laden fluids). The device allows the components of a fluid to be separated on the basis of their diffusion coefficients--the smallest molecules readily cross from their "starting solution" into the "extraction solution". For precise use for measuring concentrations of small solutes controlled flow rates on both inputs are required so that partial clogging of the channels does not alter the "mixing ratio". To use the device for simple removal of small molecules from a fluid, pressure control may be adequate. |
|
|
|
|
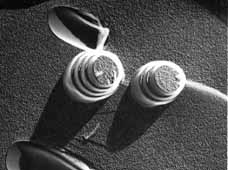
SEM of the Si portion of an early prototype "mock" H-filter™. The two outlets have been combined for simplicity of testing. Use of anisotropic wet etching causes walls shapes to be nonideal, particularly at corners. These facets act as optical mirrors. RIE and LACE can solve these shape problems. |
H-filter™ in Action: The "mock H-filter™" sealed by a Pyrex cover slip is shown in a fluorescence optical micrograph functioning to separate fluorescent dye from a mixture of beads and dye. Beads and dye enter from inlet 1, and buffer from inlet 2. After the diffusion channel all beads remain in the upper channel; fluorescent dye is distributed between the upper and lower channels. |
By rotating the flow direction of the H-filter™, much greater contact area between the adjacent streams is possible, and scaling up throughput is just a matter of increasing the device width. It can be fabricated in Si or moldable materials.
|
Using ab- (or ad-)sorbents for a diffusible species can greatly enhance the efficiency of the H-filter™. A schematic comparison between the H-filter/FFF and AEFFF performance in reducing the concentration of a diffusible species (dark color) in the right channel. Concentration gradients are shown as a curve. Note that the final concentration in 1d on both sides of the channel is the same and is 50% of the initial concentration on the right side of the channel, whereas at the same time in AEFFF (2d) the concentration on the right side of the channel is much lower. If an excess of binding beads is used in AEFFF, the ultimate concentration of the diffusible analyte that can be achieved is only limited by the binding affinity of the analyte for the beads. |
|
Giddings' FFF can be particularly well applied using our Flat Filter design.
Any field applied perpendicular to the flow direction can be used to concentrate dilute analytes many-fold. For example, consider concentration of DNA from cellular lysates by forcing DNA to one wall of the channel by electrophoresis, followed by removal in a reduced flow from that side of the channel. At small distances involved, only small voltages need be used.
Fields Applicable for Sample Extraction and Fraction (as in FFF)
Discovery of the H-Filter™ and its observation by optical microscopy led to the development of a novel sensor based on controlled diffusion of analytes in small spaces. The T-Sensor™ can be used to measure analytes in simple or particle-laden fluids. It is particularly well suited to optical detection, although other sensing modes are also possible.
Analyte from a sample stream diffuses into an indicator steam. Approach to steady state down the channel creates a pattern of indicator color or intensity change. The position of the boundary is sensitive to flow rate and changes in analyte concentration. The indicator can be free, complexed with a slowly-diffusing polymer, or immobilized on particles.
|
|
Micrograph of the T-Sensor™ in ActionA fluorescence image of a T-Sensor™ in which buffer at pH 9 (right inlet) and a pH sensitive fluorescent dye (SNAFL, pKa 7.6) in a weakly buffered solution at pH 5 (left inlet) are brought together and allowed to interdiffuse. The dye SNAFL fluoresces yellow in acid, and red in base. Note that in this case the analyte (pH) diffuses much faster than the free dye. This channel is about 200µm wide and 20 µm deep, so equilibration along the line of sight is rapid. Note that the pH transition line is quite sharp. The boundary moves in response to changes in pH of the sample like an indicator needle. |
|
|
|
|
pH measurement can be made in whole or diluted blood, as shown above. |
How to Pack a Lot of T-Sensor™ into a Small Space. Microfluidic devices don't have to be straight to have orderly laminar flow. Compact forms of devices can use less Si real estate. |
|
The same microfluidic devices allow one to bring into adjacent interdiffusive flow more than two streams, allowing sequential processing of analytes without mixing of various components.
|
|
|
|
|
For example, one could bring together sample, a non-diffusing enzyme solution, and an indicator stream, so that only the small molecule product of an enzymatic reaction would reach the indicator region of the device. The intermediary fluid stream can act as a continuously renewable enzyme-containing membrane! |
|
Alternately, a central indicator stream could be flanked by the sample and a reference stream This "Control T-Sensor" allows real-time calibration with a single image. This is a particularly important advantage for biomedical instrumentation.
|
 |

|

|
|
|
|
|
We are currently using optical microscopy to monitor the concentrations of analytes and controls in T-sensors.
|
|
|
|
The channels are imaged using a color or B&W camera, the images digitized and processed to produce a data set consisting of intensity vs. position across the channel. Often a finite length along the channel is imaged to improve the S/N ratio. |
To calculate the concentration of the unknown we collect values for:
|
|
|
By combining knowledge of the absorption and/or fluorescence intensities of each species, their respective diffusion coefficients, and the chemical reaction stoichiometry and kinetics, it is possible to model the peaks observed in the T-sensor™ and Control-T-Sensor™. Shown are an example of real data (green) and a modeled fit (blue). |
Several different types of biomedically relevant analytes have been measured using the Control-T-Sensor™. These include pH, Ca++, as well as small molecules, enzymes and antibodies.
The T-Sensor™ also converts reaction kinetic data into spatial information. Time-independent kinetic concentration determinations can be made long T-sensors under continuous flow. Reaction rates are determined by measuring the dye absorption as a function of distance from the T-joint. This has been applied to measurement of alkaline phosphatase in serum.
|
|
|
|
Most standard fluorescent or absorption methods applicable which were designed for macro-scale serum analysis are applicable for µ-quantities directly in whole blood Applicability to wide range of particle-laden samples Multiple reactions can be carried out side-by-side. Experimental controls and calibration possible in real time. |
An optical path length of <50 µm requires adjustment of some reagent concentrations from those used in larger samples Precise flow control is advantageous Control of surface adsorption is required for low-concentration analytes. |
Additional technologies have also been developed for the original Portable Stat Lab concept. Among these is the use of a v-groove in silicon as the basis for a low-volume flow cytometer, as shown below. Cells are confined in a groove etched in silicon using an anisotropic etchant. Subsequently the addition of a glass cover by anodic bonding creates a defined cavity large enough to pass all blood cells. These can be monitored by light scattering (both near-forward and 90°) or fluorescence, if the cells are labeled.
Demonstration of Cell Discrimination Capacity of the Flow Cytometer
Cells can be discriminated by their unique ratio and absolute intensities of angular scattering. Below is a 2-D histogram of cell counts in a red cell-depleted sample of blood taken with the instrumentation shown above.
This sample of blood was sedimented to decrease the proportion of RBCs before sending it through the V-groove. Note that platelets (Plts), red blood cells (RBCs) lymphocytes (L), monocytes (M) and neutrophils (N) are distinguishable.
The flow cytometer technology can also be used in conjunction with chemically sensitive beads to create a high-throughput chemical monitor.
For further information, consider linking to the home page of Micronics, Inc, to which these technologies have been licensed.
|
|
Return to Yager's Home Page Return to PY Research Page |