Transverse Electrophoresis and Isoelectric Focusing (IEF)

|
|
Transverse Electrophoresis and Isoelectric Focusing (IEF) |
|
From 1997 until July 2000, a DARPA MicroFlumes program was in place with the aim of developing sample preconditioning systems for monitoring of biological warfare agents. As part of this project we took initial steps to develop a microfluidic embodiment of isoelectric focusing (µIEF) and zone electrophoresis (µZE). We proposed its use for concentrating and separating soluble and suspended components of a liquid. Proteins and bacteria have been focused and separated in flowing streams in the channels, allowing the possibility of continuous or batch fractionation and concentration of particles ranging in size from a new nanometers to tens of micrometers. This DARPA project focused on detection of pathogens, but the same methodology is applicable to other separation tasks.
Principles of Microfluidic Isoelectric Focusing (µIEF)
Complex biological particles, including, for example, proteins, carbohydrates, polystyrene latex microspheres, silica particles, viruses, pollen grains and bacteria have characteristic chemical groups on their surfaces. These chemical groups, typically amines and carboxylic acids, have characteristic pKs that define the pH at which they convert from protonated to unprotonated forms in water. As a consequence, as the pH of a solution is varied from acid to basic, the charge on the particle will become more negative. However, for any such particle there is a pH characteristic of the chemistry of that particle at which the particle will have no net charge&endash;-this is the "isoelectric pH", isoelectric point, IpH, or pI. Note that for this introduction, we focus on protein IEF.
|
|
Figure 4. In a microfluidic channel between two electrodes, into which a buffer solution is pumped, we predicted (and now confirmed by experiment and model) that the initial uniform pH of the solution will be converted to a stable pH gradient as the rate of creation of acid and base would be just matched by their rates of recombination along the channel midline. The low pH is near the positive electrode (anode) and high pH near the cathode. The gases O2 and H2 are also formed, but by keeping the current low and moving the fluid through the channel, bubble formation is prevented. Fractionation of particles, particularly proteins, by isoelectric focusing has been known for decades, although it is generally practiced in macro-scale devices. If the isoelectric pH of a particle exists between the two electrodes, the particle will migrate toward its isoelectric point, and effectively stop when it reaches its isoelectric pH. Shrinking the apparatus to microfluidic dimensions should allows fractionation of particles with a small voltage perpendicular to the flow in an H-filter. The proteins, bacteria, or other charged particles would then be sorted into separate outlet streams for analysis or storage. It is also possible that they could be identified optically by their position between the two electrodes. |
The mobility of the protein µ, which is the velocity divided by the field E, is:
where r is the particle radius (assuming a spherical protein), Q is the charge on the protein, and h is the viscosity of the buffer. If the pH of the medium is inhomogeneous, the protein will migrate to the IpH region of the solution, decelerate, and become trapped there. This process of migration from any starting point in a pH gradient to the isoelectric or IpH point is called IEF.
If particles had no thermal motion, the resting place of all particles in the electric field E would be a surface perpendicular to the field, as shown in Figure 4. The time it took to arrive at that surface would depend on the pH gradient, the initial location of the protein in that gradient, and the dependence of µ on pH. Since proteins do experience random diffusion (as quantified by the diffusion coefficient D), there is a tendency of proteins to try to escape from their minimum energy positions, so they ultimately focus to a nearly Gaussian distribution around their isoelectric points.
While the simple theory a is a useful starting point for instrument design, the numerous assumptions are problematic. For example, the dependence of the protein charge on pH is specific to the distribution of the pK values of each titratable group on the protein, as well as the number of such groups. In the case of a well-studied protein like bovine serum albumin (BSA), this information is available, but this depth of data is not generally available for proteins. No commercially available computational modeling code exists that encompasses the processes in µZE or µIEF. Further, a microfluidic embodiment of IEF adds complexities such as the proximity of the electrodes and the steep concentration gradients they produce that are not a factor in macroscopic IEF.
One advantage of performing isoelectric focusing in microchannels like the H-filter is that the small distance between the electrodes allows a high field to be supported at low applied potentials. This high field causes rapid movement across a large fraction of the channel width. At low Reynolds numbers it should then possible to route the particles in adjacent streamlines into separate outflow streams, thereby segregating the particles by their isoelectric points. The pH gradient could be established by any of several means. For example, it is possible to bring into the entrance port of the H-filter multiple fluid streams at different pH values, with or without buffering. To the extent that the pH values do not become uniform across the channel before the particle separation is achieved, this approach is acceptable.
However, there are unique features of electrophoresis performed across microchannels. At relatively low potentials (depending on the pH), electrodes in water will cause electrolysis&endash;-the breaking of water into the gases H2 and O2, with accompanying generation of H+ at the anode and OH- at the cathode. Normally these electrolysis products are kept as far as possible from the sample. This generation of acid at the anode and base at the cathode, their interdiffusion and recombination at the device midline creates a pH gradient across the channel in either a static or flowing system. The steepness of the gradient and its central pH value are determined primarily by the chemistry at the electrodes, the buffering capacity of the solution, its initial pH, and the current flow. The pH gradient is established rapidly with virtually no extraneous support equipment, and can be altered within seconds. Formation of bubbles in microchannels would be so serious a problem as to make a device unusable. Fortunately, have found that at voltages of less than ~2.5 V between the two electrodes, ample changes in pH are observed, but no evolution of bubbles occurs in flowing systems. Even in static systems (which we use to test processes without the complications of flow) at least 5 minutes pass before the first bubbles appear; our separations can be completed in less time.
Note that if the solution in the channel is heavily buffered, no appreciable pH gradient will evolve. The particles will rapidly reach a terminal velocity in the applied electrostatic field, and the device will revert to operating in a ZE mode. It is the generation of the pH gradient in the channel produced when the solution is only lightly buffered (or has a pre-existing gradient imposed by use of multiple input streams) that causes the same device to perform in IEF mode. A single device can switch from one mode to the other in seconds.
In IEF the particles move to pH planes within the channel and remain at those planes relative to the electrodes through the channel. Large swings in flow rate will have little effect. If the particles have relatively small diffusion coefficients, they will remain at these relative locations relative to the field even if the electrodes do not extend the full length of the channel, and the pH gradient subsequently changes. These are major advantages for use of microfluidics for separation of particles. While other laboratories have studied various aspects of IEF in small volumes and the generation of pH gradients by electrolysis, and certainly others have both studied and commercialized CE on a chip, we have not found any group to have put together all of these aspects to study or exploit what we call transverse µIEF.
Development of Microfluidic Electrokinetic Device Fabrication Techniques
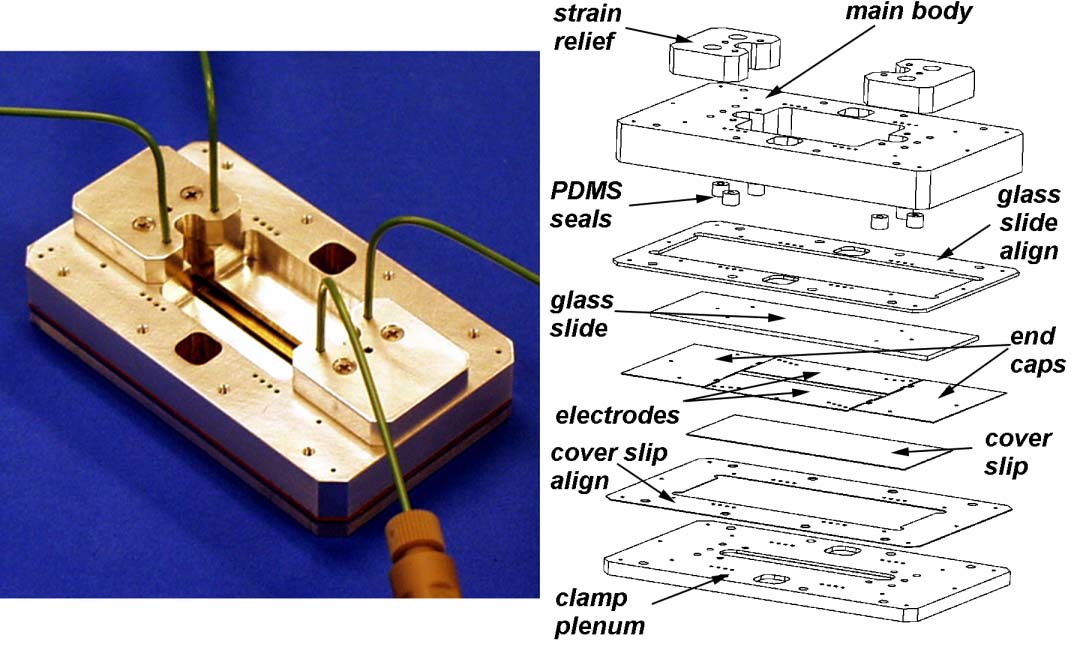
Since 1997 we have fabricated a series of H-filter-like microfluidic devices that allow application of electric fields perpendicular to the flow in microchannels (Figures 5-8). We developed a process for depositing gold directly on our Mylar substrates. The method requires that the Mylar be first masked, treated with an O2 plasma, and sputter-coated with gold. These flat gold-coated Mylar films were then folded onto a core of adhesive-coated Mylar and sandwiched into the device shown in Figures 5 and 6. This all-Mylar design solved the electrochemical problem and proved relatively robust, particularly in combination with the interconnect device designed for it (Figure 8). However, this design put the gold film under tension, shortening its useful lifetime. In the last 18 months the design was modified to employ solid palladium electrodes (Figure 7), which increased the coverage of the channel walls to 83%. Figure 7 show the parts required to assemble and use this flow cell.
|
|
Figure 5. Schematic design of the first Mylar laminate-based devices for ZE and IEF developed in our laboratory under support of the DARPA MicroFlumes program. They consist of a series of layers of Mylar, some of which are pre-coated with an acrylate adhesive. They were cut from flat sheets using the aforementioned CO2 cutting tool and assembled by stacking. The device shown has electrodes made by sputtering of gold on Mylar. |
Once electrodes are assembled, they are used with Mylar or glass end caps to assemble flow cells.
|
|
|
|
Figure 6. An example of the electrokinetic laminate device shown in Figure 5. The inter-electrode gap was either 2.5 or 1.27 mm. Versions with glass and Mylar windows have been made, separated by ~400 µm. |
Figure 7. The current version of the electrokinetic laminate device in which the gold electrodes were replaced by precut Pd foil sandwiched between 5 layers of Mylar. Pd is a catalyst that converts the O2 and H2 formed by electrolysis back to water, allowing higher currents without bubble formation. |
|
|
Figure 8. Connectorization is often a problem in microfluidics. Our flow cells are held on the inverted microscope stages in 6-port manifolds made of aluminum or polycarbonate like the one shown at left. These allow direct 0-dead-volume connection between the laminate devices and fluidic manifolds assembled from commercial HPLC tubing made of PEEK. Fluid flow is driven by banks of syringe pumps (Kloehn Instruments) that are, themselves, driven by custom code running on a PC. This allows rapid alteration of running protocols. Careful exclusion of bubbles allows rapid starting and stopping of flow. |
Demonstration of pH Gradient Formation
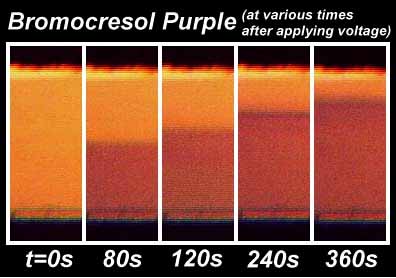
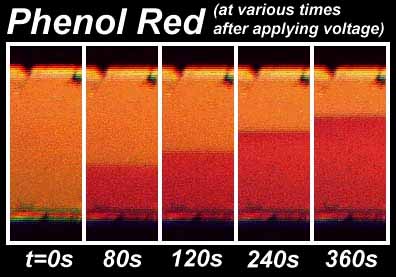
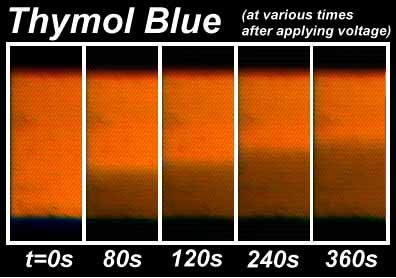
Conventional pH indicator dyes were used to monitor the pH in channels thinner than 400 µm. We developed a fully quantitative method for mapping the channel pH using optical absorptive dyes. We found that when the concentration of the buffer was kept at or below about 1 mM, it was possible to generate pH gradients with wide ranges. The "color change front" was tracked for each indicator. A 0.2 mM solution of indicator in 5 mM NaCl in water was used at a starting pH of about 3.8. A potential of +1.2 V was applied and the current density during these measurements was about 10 µA/mm2. The gap between the electrodes was 1.27 mm.
|
|
|
|
|
Fig. 9A: Development of pH gradient for Bromocresol Purple (pKa = 6.3): |
Fig. 9B: Development of pH gradient for Phenol Red (pKa = 7.9). |
Fig. 9C: Development of pH gradient for Thymol Blue: |
We had originally hypothesized that the pH gradients would evolve until a steady state was reached, and this was, in fact, observed by about 10 minutes in devices with a gap of 2.5 mm between the electrodes. (More rapid attainment of a steady state is found when the gap is smaller.) We found that as long as the potential between the electrodes was kept below ~2.3V, bubbles did not form in the first 5 minutes. Conversion from Au to Pd electrodes increased the current almost 10-fold, with no apparent negative effects. This does not mean that O2 and H2 were not present. In fact, we found evidence (from quenching of fluorescent dyes) of high partial pressures of O2 near the anode, particularly in static fluid. However, if the partial pressures do not reach very high levels, bubble nucleation does not begin. In flowing fluid, washout of the soluble gases is efficient. We soon found that pH gradients were formed not only in static fluid, but in flowing buffer as well.
|
|
|
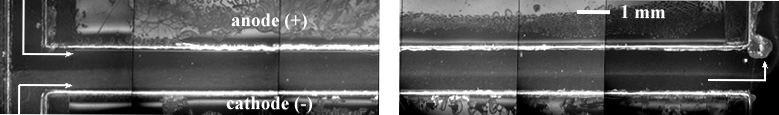
Figure 10. A mosaic of images of a steady-state pH gradient under flow (inlet at lower left and exit at lower right). Note the change from yellow to red of Phenol Red (0.2 mM in 5 mM NaCl) at the cathode. The 40 mm long channel was formed by two gold electroplated electrodes with a thickness of 0.127 mm and an inter-electrode gap of 2.54 mm. Flow rate 0.083 µl/s (99.3 µm/s, potential 1.2 V; current density ~ 1 µA/mm2. Note that the pH gradient stabilized in the third window, and remained steady until the flow was distorted by exit effects. |
µIEF of Proteins
Focusing and concentration has now been demonstrated with the following types of analytes: synthetic microparticles, bacteria (both vegetative and in spore form), DNA, and proteins. Work with fluorescently labeled proteins was aimed both at using the protein's well-defined pI to map the pH gradient, as well as, ultimately, fractionating protein mixtures.
|
|
Figure 11. A comparison of positions of the protein bovine serum albumin (BSA) during IEF at different initial values of the buffer pH. The pI of BSA is 4.6; focusing is sharpest when the starting pH is near the pI of the protein, and the pKa of the buffer is close to that of the initial pH. |
Flowing Transverse IEF Separation of Proteins
If each protein is focused to its own optimal location between electrodes, it should be possible to separate proteins. Initial efforts to do this were encouraging, but the resolution was not as good as had been hoped.
|
|
|
|
Figure 12. Three fluorescence images (above) near the outflow of a flowing stream. Note that while some separation is evident, there is strong overlap of the two labeled proteins, which differ by 1 pH unit in their reported isoelectric points. A TRITC filter set allows visualization of bovine serum albumin (BSA) with Alexa-594 (pI=~4.6, by gel IEF) B Fluorescein filter set sees streptavidin with Bodipy-Fl (pI=~5.6) C Dual band pass filter set sees both proteins simultaneously Mean retention time of 4 min, total flow rate 4.8 µl/min. 1 mM MES, initial pH 5.41, 2.3 V, 7-8 µA, electrode gap 1.25 mm. |
Figure 13. Image of enhanced separation (using the dual band pass filter set) of protein produced by flipping the polarity of the field (and, thence, the pH gradient). Separation of BSA-Alexa 594 (orange) from neutravidin-Bodipy-Fl (green, pI=~7) is seen soon after polarity switched. This suggests that using two sets of electrodes with opposite polarities down the channel would lead to better separation. |
The separation between proteins was often found to be best shortly after turning on the voltage, and then to deteriorate over time (and space) (see below). To our surprise, transient excellent separation was often found if the potential on the channel was flipped in polarity after establishment of a steady state separation. This was found to be true whether the fluid was static or flowing.
|
|
|
Figure 14. Separation of the proteins bovine serum albumin (BSA)(orange) and wheat germ lectin (green) by IEF. All images were taken at a point immediately upstream of the channel exit, at the times shown after application of the potential. Note that excellent separation at 60 seconds appears to worsen with time, and the intensity of the BSA fluorescence grows. Conditions: 0.3 µM protein in multiple buffers with initial pH of 5.48, three-inlet configuration to keep proteins off the electrodes; flow rate 0.042 µL/s for the middle stream; buffer concentration 1 mM; mean flow velocity 324 µm/s; applied potential 2.0 V, current density 2.86 µA/mm2. |
µIEF of Bacteria
Bacterial cells (Figure 15) and spores (not shown) were also found to focus and concentrate well using IEF; they could also be concentrated when the buffer strength was high enough that ZE occurred instead of IEF.
|
|
|
Figure 15. Composite fluorescence optical microscopic images of the two ends of a µ IEF device in which a suspension of bacteria (E. herbicola) in 1 mM MES enters from bottom left and the pure buffer enters at top left. Bacteria were stained with Syto 13, a DNA intercalating fluorescent dye. Experiment performed in gold/Mylar device with 1.27 mm electrode gap. Channel height of 0.4 mm, total length 40 mm, total volumetric flow rate of 84 nL/s. Applied 2.3V, current of 5-8 µA. These bacteria are rods about 5 µm in length. |
Successes and Challenges
We have now repeatedly demonstrated concentration of bacteria, proteins, and nucleic acids using IEF into narrow streams in <5 minutes in low fields. However, we have by no means solved all the problems involved with using µZE or µIEF. One mystery is the apparent worsening in protein separation after a certain distance/time in the channel (if the voltage is not switched). One candidate for a process that can worsen results is parasitic electroösmotic pumping perpendicular to the flow direction. We have captured such pumping on video, particularly at very low ionic strength. Electroösmotic pumping is caused by electrophoretic flow of the surface layer of counterions proximal to the charged surface of the channel wall. The 3D flow created is very complex, particularly in a pH gradient. Such flow produces a reproducible distortion of what would otherwise be orderly layering of analytes, reducing the resolution of the technique. We have considered the many possible approaches to suppressing such surface-charge-based pumping. Of the methods tried, we are most happy with preconditioning the channel with quaternary ammonium surfactants such as CTAB. CTAB appears to adhere to the polymeric surface and counterbalance its intrinsic negative surface charge, effectively eliminating the electroösmotic pumping. For focusing of bacteria the improvement has been remarkable. Such a surface coating is ephemeral; continuous addition of µM CTAB to the perfusing solution is also possible. We are now examining whether protein focusing can be similarly improved by addition of detergent.
Modeling of IEF
We knew from the outset that µIEF would be complex. Consequently, integral to our experimental work has been an effort to model the processes to validate our understanding and to optimize device design and buffer conditions.
|
|
Figure 16. We have developed a 1-D finite difference model of the electrochemical and transport processes occurring in µIEF. The line between the electrodes is modeled as a series of nodes offset from the electrodes to facilitate modeling of the ionic fluxes at the electrodes. Also taken into account is the titration of the proteins. This model is evolving as part of Catherine Cabrera's Ph.D. dissertation. |
The model is similar in concept to that of Bier and colleagues, but has the additional complications of a non-uniform flow profile and production of H+ and OH- at the anode and cathode, respectively. The basic theory is developed as described by Lindgren and colleagues. No reports were available in the literature of mathematical models that included the contributions of hydrolysis products to pH gradient formation or the implications of a non-uniform flow profile. In the 'real world' and therefore in our model as well, the conductivity, and thus the electric field, can vary with both time and position in the channel. The current density is assumed to be constant, which is consistent with experimental data after the first 10-30 seconds of an experiment. By assuming a constant current density we implicitly impose the condition of electroneutrality, which is expressed in the model by allowing the electrophoretic mobility of a species to vary with the local charge gradient as well as with the overall local field. We also assume a constant temperature in the channel, which leads to assumptions of constant diffusion coefficients, absolute mobilities, and equilibrium constants. This assumption neglects Joule heating, which is valid given the low power and high surface area-to-volume ratio (which facilitates heat transfer). The initial 1D model, in which the distance down the channel functions as a pseudo-time dimension (Figures 17,18), is now supplemented by a 2D model. The preliminary results of that modeling are encouraging.
Simulation Validation
|
|
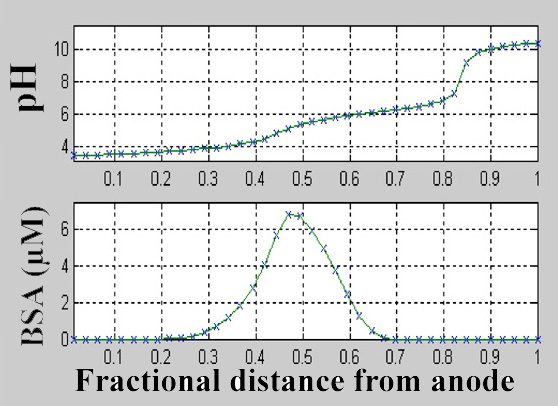
Figure 17. Predictions of a "simple" 1D model for the pH gradient (a) and concentration of the protein bovine serum albumin (BSA) (b). Both are modeled for a plane at L = 20 mm down the channel, for 3 µm BSA in 1 mM MES buffer introduced from the cathodic inlet, and buffer only at the anodic inlet. Initial pH 5.75, total flow rate of 84 nL/s, current density of 0.61 A/m2, which is achievable at our voltages. Compare this image to Figure 11, which was performed without suppression of electroösmotic pumping. The model accommodated the variation in electrophoretic mobility with pH. Published data on the pH dependence of the net charge of BSA were used to construct a look-up table that, for a given pH value, returned the corresponding net charge and degree of protonation. |
|
|
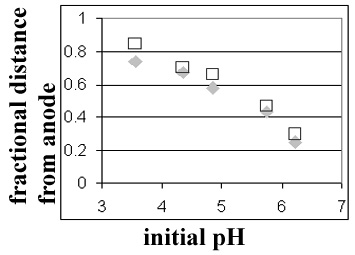
Figure 18. Comparison of model predictions (squares) to experimental data (diamonds) for the steady-state position of the BSA band during flowing IEF. A similar figure was included in a recently submitted manuscript. As noted above, the charge on the protein was therefore allowed to vary with the local pH, which facilitated accounting for the buffering capacity of the protein during the acid/base equilibrium step of the model. Overall we are encouraged that the model as it now exists will perform excellently for prediction of device resolution at steady state. Achieving correspondence between model and experiment with respect to the rates at which the steady state profile is achieved requires further work. |
Applying microfluidic chemical analytical systems to imperfect samples, Yager, P., Bell, D., Brody, J.P., Qin, D., Cabrera, C., Kamholz, A., and Weigl, B.H., in Micro Total Analysis Systems '98, D. J. Harrison and A. van den Berg, eds., Kluwer Academic Publishers, Dordrecht, 207-212 (1998)
Design of microfluidic sample preconditioning systems for detection of biological agents in environmental samples, Yager, P., Afromowitz, M.A., Bell, D., Forster, F.K., Brody, J.P., Qin, D., Cabrera, C., Holl, M., Kamholz, A., and Weigl, B.H., SPIE Proceedings, 3515, 252-259 (1998)
Analytical devices based on transverse transport in microchannels, Yager, P., Cabrera, C., Hatch, A., Hawkins, K., Holl, M., Kamholz, A., Macounova, K., and Weigl, B.H., in Micro Total Analysis Systems 2000, van den Berg, Olthuis and Bergveld, eds., Kluwer Academic Publishers, Dordrecht, 319-322 (2000)
Generation of natural pH gradients in microfluidic channels for use in isoelectric focusing, Macounová, K., Cabrera, C.R., Holl, M.R. and Yager, P., Analytical Chemistry, 72(16), 3745-3751 (2000).
Use of isoelectric focusing for sample preconditioning in a microfluidic electrochemical flow cell, Cabrera, C.R., Macounová, K., Holl, M.R., and Yager, P., Proceedings of the IEEE 1st Annual Conference on Microtechnology in Medicine and Biology, Lyon France, October, 2000, D. Beebe, Ed.,IEEE Press (2000)
Formation of natural pH gradients in a microfluidic device under flow conditions: Model and experimental validation, Cabrera, C.R., Finlayson, B.A., and Yager, P., Analytical Chemistry, 73(3), 658-666 (2001)
Continuous concentration of bacteria in a microfluidic flow cell using electrokinetic techniques, Cabrera, C.R. and Yager, P., Electrophoresis, 22(2), 355-362 (2001)
Concentration and separation of proteins in microfluidic channels on the basis of transverse IEF, Macounová, K., Cabrera, C.R., and Yager, P., Analytical Chemistry, 73(7), 1627-1633 (2001)
|
|
Return to Microfluidics Home Page Return to Yager Group Home Page
|