Wallace S. Broecker, "Will Our Ride into the Greenhouse Future be a Smooth One?" GSA Today 7(5):1-7 (May 1997). Converted from 2mb .pdf file at http://www.geosociety.org/pubs/gsatoday/gsat9705.htm

ABSTRACT
The climate record kept in ice and in sediment reveals that since the invention of agriculture some 8000 yr ago, climate has remained remarkably stable. By contrast, during the preceding 100,000 yr, climate underwent frequent, very large, and often extremely abrupt shifts. Furthermore, these shifts occurred in lockstep across the globe. They seem to be telling us that Earth's climate system has several distinct and quite different modes of operation and that it can jump from one of these modes to another in a matter of a decade or two. So far, we know of only one element of the climate system which has multiple modes of operation: the oceans' thermohaline circulation. Numerous model simulations reveal that this circulation is quite sensitive to the freshwater budget in the high-latitude regions where deep waters form. Perhaps the mode shifts revealed in the climate record were initiated in the sea. This discovery complicates predictions of the consequences of the ongoing buildup of greenhouse gases in the atmosphere. If the major climate changes of glacial time came as the result of mode shifts, can we be certain that the warming will proceed smoothly? Or is it possible that about 100 years from now, when our descendants struggle to feed the 15 or so billion Earth inhabitants, climate will jump to a less hospitable state. It is difficult to comprehend the misery that would follow on the heels of such an event!
INTRODUCTION
The debate regarding the eventual consequences of the ongoing buildup of greenhouse gases in the atmosphere concerns the magnitude of the coming changes. Most atmospheric scientists agree that the warming during the coming century will be sufficiently great to pose serious difficulties, but because to date the warming has been smaller than predicted by most general-circulation models, a vocal minority dismisses this supposed threat. On the other hand, little debate has occurred regarding the shape of the path climate will follow as CO2 and other infrared-absorbing gases build up in our atmosphere. Whether the warming is great or small, nearly everyone assumes that it will be a smooth climb, and that climate will keep pace with the ever-increasing strength of the greenhouse blanket. But will it? Certainly the Earth climate system has proven beyond any doubt that it is capable of jumping abruptly from one state of operation to another. Can we be sure that it won't respond to our push by lurching into another of its operational modes?
A MESSAGE FROM GREENLAND
A clear demonstration that the climate system can jump from one state to another comes from a record kept in Greenland ice (see Fig. 1). European and American teams have drilled through the entire thickness of the Greenland ice cap. The most recent and best documented of these records is a pair of 3-km-long ice cores from the summit of Greenland. These cores provide not only a record of climate in Greenland but also implications regarding climate in other places on the globe as far back as 110,000 yr ago. Because precise counting of individual couplets of winter and summer snow extends back to at least 45,000 yr ago, there are few questions regarding the chronology of this ice core (Meese et al., 1994).
The isotopic composition of this ice is related to the air temperature over Greenland. For the past 10,000 yr, Green-land has had a very stable climate, at least compared to the previous 100,000 yr. There was one cold blip 8000 yr ago, but otherwise its climate has remained pretty much unchanged. Prior to 10,000 yr ago, though, the climate leaped back and forth between states of intermediate cold and extreme cold. The median temperature at this site during the ice age has now been well established, through thermal profiles in the ice itself, to have been on the average 16°C colder than during the past 10,000 yr (Cuffey et al., 1995).
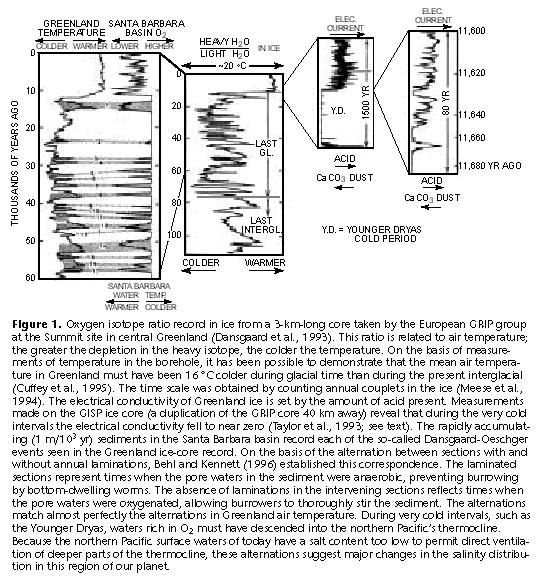
Further, during the past five years, evidence from a variety of investigations has clearly demonstrated that these changes were not confined to Greenland; rather, they were global! Before reviewing the evidence for these far-reaching impacts, let us consider the rapidity of these changes. This is best done by focusing on the most recent warming, the one that ushered in the present interglacial. Electrical conductivity for one of the Greenland ice cores (Taylor et al., 1993; Fig. 1 here) was measured in great detail by scratching a fresh surface of the ice with a pair of electrodes. This record pro-vides a measure of the ratio of the fallout of acids to that of calcium carbonate-bearing dust. During the Younger Dryas cold event, the rate of CaCO3 Annual layer counting allows the duration of the transition interval to be well documented (Fig. 1, far right). The initial change took place in only two or three years, but then the climate flickered, and the dust came back in spurts before the situation stabilized in the low-dust state. The entire transition took place in less than three decades (Taylor et al., 1993). Ice cores also tell us something about tropical climates, because air bubbles trapped in the ice contain methane. Prior to the invention of agriculture, the major source of methane was swamps. Currently, many of these swamps are located in the temperate latitudes of the Northern Hemisphere. During glacial time when the planet was very cold, all these northern swamps were either covered by ice sheets or frozen into tundra. Hence, they could not have been methane producers. So during the Younger Dryas, most methane must have been produced in the tropics. In concert with the big warming at the end of this last cold event, the methane content of Earth's atmosphere jumped from slightly below 500 up to about 750 parts per billion. I think that this rise was driven, at least in part, by a wetting of the tropics--i.e., to an increase in the size and number of methane-producing swamps and soils. It's therefore interesting to explore the relation between the timing of this methane jump and the abrupt warming in Greenland. My former graduate student, Jeffrey Severinghaus, working in the laboratory of Michael Bender at the University of Rhode Island, made a major discovery when he found a means by which in these same air bubbles he could obtain a measure of air-temperature change in Greenland. He used these measurements to show that Greenland's warming began no more than a decade or so before the onset of the increase in methane. Somehow when Greenland suddenly got much warmer, the tropics suddenly got wetter. So the impacts of this mode change extended, from Greenland at least, down into the tropics.
CLIMATE CHANGE: GLOBAL AS WELL AS LARGE AND ABRUPT
George Denton, of the University of Maine, working with a colleague, Chris Hendy, studied a very interesting moraine left behind by a major advance of New Zealand's Franz Josef Glacier. The expansion extended down the steep valley toward the Tasman Sea and created at its outer limit the Waiho Loop moraine (see photo). The rock rubble making up this moraine is underlain by lots of wood. Denton and Hendy (1994) postulated that as the glacier advanced, it moved through a forest, tearing out trees and bulldozing them to its terminus. They obtained 25 radiocarbon measurements on separate pieces of the wood and determined the age of this basal wood deposit to be 11,150 Ý~50 14C yr. This is very close to the radiocarbon age obtained in the Northern Hemisphere for the onset of the Younger Dryas cold interval (Hajdas et al., 1995). Denton would thus say that this event affected the Southern Hemisphere; the mountain glaciers responded to a substantial lowering of the 0° isotherm. Achieving this lowering required a substantial Southern Hemisphere cooling.
A recent, spectacular set of results from sediments in a basin just off Santa Barbara, California, verifies that this phenomenon was widespread and strong, not only during the Younger Dryas, but also for the series of so-called Dansgaard-Oeschger (D-O) events. These events, named in honor of two of the heroes of ice-core research, punctuated the period between about 65,000 and 25,000 yr ago. Previously it had been possible to duplicate this ice record only in ocean sediments from the northern Atlantic (Bond and Lotti, 1995), because for the most part they accumulate so slowly that stirring by worms obliterates millennial duration events. Jim Kennett, of the University of California, Santa Barbara, convinced the Deep Sea Drilling Program to spend one day drilling two shallow holes in the Santa Barbara basin. This brief effort produced a gold mine of information. Because these sediments accumulated at a rate of about 1 m per 1000 yr, they have adequate resolution to fully preserve the Dansgaard-Oeschger events--and indeed they did. For each of the warm phases, the sediment shows annual banding, while during each of the cold phases, stirring by bottom-dwelling organisms homogenized the sediment (Behl and Kennett, 1996). These results suggest that during the warm phase of each D-O cycle, the O2 content of the water filling the Santa Barbara basin was sufficiently low and the rain rate of organic matter sufficiently high that the sediments were anoxic. Thus, burrowing organisms were excluded. By contrast, during each of the cold phases (including the Younger Dryas), the pore waters in the upper sediments must have been oxygenated. To me, this suggests that during the cold phases conditions in the northern Pacific were quite different from conditions now. The low-salinity surface waters that currently cap this region and thereby prevent direct ventilation of the main thermocline must have been replaced with saltier water, allowing the northern Pacific to operate much as the northern Atlantic does today. Behl and Kennett (1996) found that 16 of the 17 D-O events in the Greenland ice core record are clearly evident in the Santa Barbara record.
What do these data tell us? The ventilation of the northern Pacific's thermocline (the sinking of waters from temper-ate latitudes to intermediate depths) increased greatly during the cold phases of the D-O events (i.e., the intervals during which laminations disappear). So the cold spells in Greenland are matched in the northern Pacific Ocean by what must have been a radical change in the style of upper-ocean circulation. I've recapped what I consider to be the highlights of evidence for the global extent, large magnitude, and abruptness of these D-O events. What might have triggered these amazing changes?
CAUSES: THE OCEANIC CONVEYOR BELT
The basic idea came to me in 1984, while I was listening to a lecture given by Hans Oeschger at the University of Bern in Switzerland. He pointed out that the Greenland ice core record suggests that Earth's climate was jumping back and forth from one state of operation to another, staying in one for a millennium or so, and then jumping to the other. I began to ponder what these states might be. It soon dawned on me that they could be related to a change in a major feature of the ocean's thermohaline circulation system, which I subsequently termed its conveyor belt. People now refer to it as Broecker's conveyor belt, but I have a colleague, Arnold Gordon, who thinks it's his conveyor belt rather than mine. It doesn't really matter, though; we both agree that it's an extremely important feature of Earth's climate system.
My idea can be summarized as follows. As shown in Figure 2, one of the most prominent features of today's ocean circulation is the strong northward movement of upper waters in the Atlantic. When these waters reach the vicinity of Iceland, they are cooled by the cold winter air that streams off Canada and Greenland. These waters, which arrive at 12 to 13°C, are cooled to 2-4°C. The Atlantic is a particularly salty ocean, so this cooling increases the density of the surface waters to the point where they can sink all the way to the bottom. The majority of this water flows southward, and much of it rounds Africa, joining the Southern Ocean's circumpolar current.
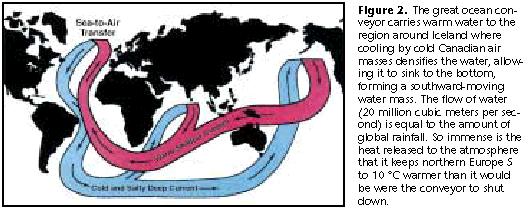
The importance of this current to climate is the enormous amount of heat it carries. The conveyor's flow is equal to that of 100 Amazon Rivers! It's similar in magnitude to all the planet's rainfall. So if you have three pipes, one carrying North Atlantic deep water, one carrying all the rain falling on Earth, and one carrying 100 Amazon Rivers, the outflow from these pipes would be about the same. The amount of heat carried by the conveyor's northward-flowing upper limb and released to the atmosphere is equal to about 25% of the solar energy reaching the surface of the Atlantic north of the Straits of Gibraltar.
I had known about this because my career has had a dual aspect. One part of it involved a study of the ocean's deep circulation by means of radiocarbon and other tracers. The focus was to try to understand how rapidly fossil-fuel CO2 would be absorbed into the ocean. The other aspect involved studies of paleoclimate. I was captivated by the observation that each of the major 100,000-yr-duration glacial cycles that have hounded us during the past million years came to a catastrophic close. So in 1984, I realized that I could merge these two studies and ask the question, "What would happen if this major current were to be shut off or turned down?" Any such modification would certainly make a major change in the climate of the northern Atlantic region. At my prodding, modelers launched computer simulations of this phenomenon and quickly showed that if the input of warm water to the northern Atlantic were cut, the mean annual temperature of the lands around the North Atlantic basin would drop by 5 to 10°C. These climate changes would be felt in Newfoundland and Greenland and would penetrate well into northern Europe. However, the models suggested that this cooling would not extend across America to the Santa Barbara basin, nor would it extend to the tropics. It certainly would not have an impact on New Zealand.
In addition, ocean modelers followed up on the early work of Stommel (1962), who first demonstrated from a theoretical point of view that the ocean must have several distinct modes of operation. Employing a variety of simulations, they demonstrated that because of the very great sensitivity of deep-water formation to the input of fresh water in polar regions, the ocean could circulate in quite different ways. Because rain water contains no salt, addition of it lowers the density of surface waters. Further, at high latitudes, rainfall and continental runoff exceed evaporation. Because of this, the distribution of places where deep waters can and cannot be generated is sensitive to the pattern of freshwater delivery. So this new class of models verified what Stommel had predicted; indeed these model oceans could make dramatic jumps from one way of operating to another. As they did so, the amount of heat delivered to the northern Atlantic region changed greatly. While changes in the conveyor provide a likely explanation for the Green-land ice core record, however, in no case does any joint ocean-atmosphere model produce the far-field impacts displayed in the paleoclimate record.
CAUSES: IS WATER VAPOR UP TO THE TASK?
Now we must turn to a more speculative realm, because explaining the global extent of these changes is something that we're a long way from accomplishing. An important piece of information in this regard is the state of Earth's system during the extreme cold millenniums of glacial times. At these times, all of Canada and a major part of the northeastern and mid-western United States were covered by a huge ice sheet. The snow line descended about 1 km on mountains everywhere on Earth. Geomorphologists have traversed the globe comparing the elevation of the present-day mountain snowlines with those for the last glaciation (reconstructed from geomorphic features). Figure 3 shows results from the American Cordillera. Everywhere from 40°S to 40°N, snowlines descended about 1 km! Thus, the southern Andes and New Zealand's South Island, which now have very small glaciers, had quite large ones.
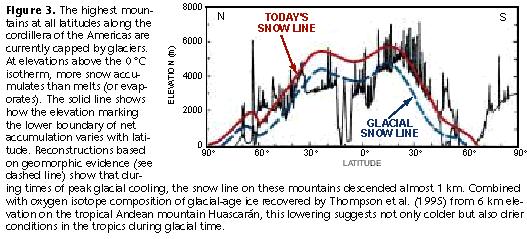
What this tells us is that somehow Earth was in a much colder condition during glacial periods. To my way of thinking, no one has adequately explained how this could have happened. We now have new evidence from glacial-age corals (Guilderson et al., 1994) and from glacial-age ground waters (Stute et al., 1995) that the tropics may have been as much as 5°C colder during glacial times. How could the climate of Earth have changed so much in the absence of any strong external forcing? When I consider the mountain glacier record together with the isotope record obtained for glacial-age ice from 6 km elevation on Huascarán in the Andes (Thompson et al., 1995), I must conclude that the water vapor content of our atmosphere must have been much lower during glacial times. Hence, either the processes that deliver or those that remove water vapor from our atmosphere must have been different during glacial times. This reduction is something that no model of the atmosphere has yet to accomplish, however. In fact, the models are powerless to produce the large global changes that the paleorecords prove to have taken place. Why water vapor?, you might ask. The answer is that water vapor is the atmosphere's most powerful greenhouse gas. If you wanted to cool the planet by 5°C and could magically alter the water-vapor content of the atmosphere, a 30% decrease would do the job. In fact, the major debate among atmospheric scientists regarding the magnitude of the coming greenhouse warming hinges on what's referred to as the water-vapor feedback. If the water vapor in the atmosphere were to remain exactly the same as it is now, then a doubling of CO2 would heat the planet only about 1.2°C. However, when CO2 is doubled in these models, the atmosphere holds more water vapor, enhancing the warming to 3.5 Ý1.5°C. A 3.5°C warming would certainly cause major problems for agriculture, especially where conducted in continental interiors. The debate concerns whether the models change the water vapor in the same way that it will change as CO2 rises in the real world.
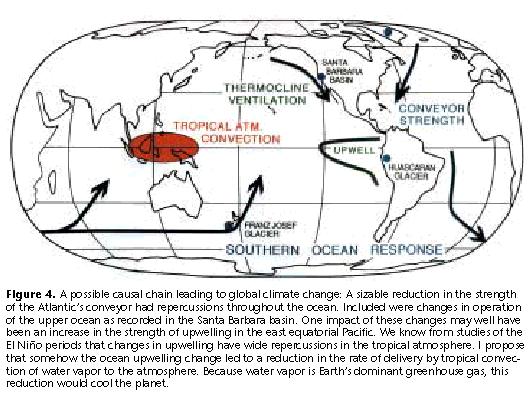
My speculation (see Fig. 4) is that despite the fact that the primary climate impacts of the change in deep-ocean circulation are restricted to the northern Atlantic basin, somehow, as a result, the water-vapor budget for the atmosphere must have been altered. Water vapor is supplied to the atmosphere primarily in the tropics, by plumes of air that ascend to the upper troposphere along the inter-tropical convergence zone. So if we invoke a change in the atmosphere's water-vapor inventory, we must look to the tropics--in particular, to the western tropical Pacific, where convective activity feeds a major amount of water vapor into the air. If this is so, the change in the deep circulation must have repercussions throughout the upper ocean. As evidence that this is the case, the Santa Barbara basin record indicates that, at least in the northern Pacific, there must have been a major change in the style of upper-ocean ventilation. This is important because the energy budget of the tropical atmosphere is influenced by the upwelling of cold ocean water along the equator. This cold water is fed in from the thermoclines to the North and South Pacific. The now famous El Niño cycle involves a turning on and off of this upwelling. This cycle has a strong impact on today's global climate. So I think that somehow the change in the vigor of upper-ocean circulation must have altered the strength of upwelling into the equatorial region and, in turn, the delivery of water vapor into the atmosphere.
This aspect of my argument is particularly speculative, because we don't know how it could happen. But to produce large and abrupt changes in global climate that are symmetrical around the equator, it seems to me that only the atmosphere's water vapor is up to the task. If water vapor is the cause, then we must look to the equatorial systems for the key. My guess is that changes in the freshwater budget of the surface North Atlantic threw the ocean's deep circulation into chaos. If it reformed in another mode of operation, in so doing, it triggered changes in other parts of the ocean and in turn in the delivery of water-vapor to the tropical atmosphere. Because this source maintains the atmosphere's water-vapor inventory all the way out to 35° north and south of the equator, the impact would be global. This way of looking at it suggests that we might be able to find in the paleoclimatic record a causal chain from the northern Atlantic to the equatorial Pacific and hence to the atmosphere. But I doubt that we can. The links probably act so fast that, within the accuracy of even the most precise of our dating tools, all the changes occurred at one time. We have already seen that Greenland air temperature, Asian dust production, and global methane production changed together. Some of the impacts may take longer than others to reach a new steady state, but all were probably initiated during a time interval of no more than a few decades.
OUR FUTURE
The question naturally arises as to whether this finding about past climates has any implications for the future. I think it does. Human population is rising at a rate of 1.75% each year. If this continues, by the middle of the next century, population will reach the staggering level of 14 billion. Most predictions suggest that declining birth rates will ease somewhat this potentially desperate situation. Nevertheless, we're headed for a population of at least 10 billion people (see Fig. 5). At just the time we expect sizable greenhouse warming impacts, we'll have at least five billion more people to feed than we do now. That is an enormous challenge, even in the absence of a climate change.
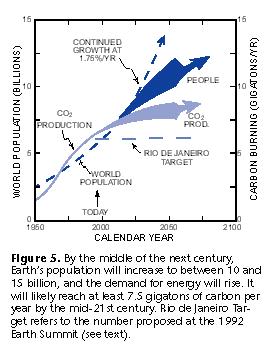
The amount of CO2 we produce depends on (1) how many people there are and (2) how much energy they use. The poorer people on Earth will seek a bet-ter standard of living, and that will require more energy. Almost all of our energy now comes from burning fossil fuels and therefore involves adding CO2 to the atmosphere. The hope expressed at the UN Conference on Environment and Development (Earth Summit; Rio de Janeiro, 1992) was that the production rate of CO2 could be held to its 1990 level, but the production rate has already risen well above that level. Some politicians believe that the Earth Summit goal is achievable, but I don't. I suspect that we are going to generate 7 gigatons or more of carbon as CO2 every year. At this rate, the CO2 content of the atmosphere will rise at the rate of about 2 ppm per year (Fig. 6).
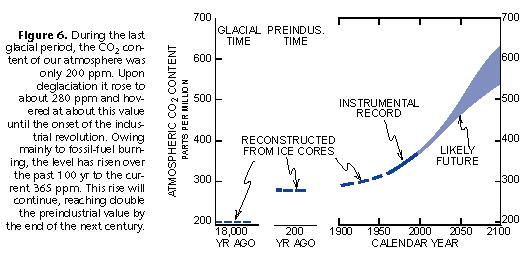
The CO2 content of the atmosphere will continue to increase; how much it increases depends on many variables. Maybe there will be a miracle, and we'll find some alternate energy source that is socially acceptable and economically fundable. I have little doubt, though, that late in the next century, the CO2 content of our atmosphere will reach 560 ppm, twice the preindustrial level. Before we're free from dependence on fossil fuels, we'll probably drive the CO2 up to 700 ppm or more. For this rise in CO2, models yield a range of global warmings, because they differ in the extents of water-vapor feedback. As already stated, were there no such feedback, the warming would be only about 1.2°C and would not produce much difficulty. If the warming were 3, 4, or 5°C, as some models predict, then everybody would agree that there would be big trouble. What I've injected into this already complicated situation is the realization that in the past, climate changes haven't come gradually. Whatever pushed Earth's climate didn't lead to smooth changes, but rather to jumps from one state of operation to another. So the question naturally arises, What is the probability that through adding CO2 we will cause the climate system to jump to one of its alternate modes of operation? I contend that since we can't yet reproduce any of these jumps in computer simulations, we don't really know how many modes of operations Earth has, and we certainly don't have any idea what it might take to push the system from one mode to another. We do know, however, that a substantial warming would surely reduce the density of polar surface water and thereby tend to cut off deep ventilation. So we're entering dangerous territory and provoking an ornery beast. Our climate system has proven that it can do very strange things. Since we've only recently become aware of this capability, there's nothing concrete that we can say about the implications. This discovery certainly gives us even more reason to be prudent about what we do, though. We must prepare for the future by learning more about our change-able climate system, and we must create the wherewithal to respond if the CO2-induced climate changes are large, or, worse yet, if they come abruptly, changing agricultural conditions across the entire planet. We must think all this through. Even if there is only a 1% probability that such a change might occur during the next 100 years, its impact would be sufficiently catastrophic that the mere possibility warrants a lot of preparation.
My lifetime study of Earth's climate system has humbled me. I'm convinced that we have greatly underestimated the complexity of this system. The importance of obscure phenomena, ranging from those that control the size of raindrops to those that control the amount of water pouring into the deep sea from the shelves of the Antarctic continent, makes reliable modeling very difficult, if not impossible. If we're going to predict the future, we have to achieve a much greater understanding of these small-scale processes that together generate large-scale effects.
REFERENCES CITED
Behl, R. J., and Kennett, J. P., 1996, Brief interstadial events in the Santa Barbara basin, NE Pacific, during the past 60 kyr: Nature, v. 379, p. 243-246.
Biscaye, P. E., Grousset, F. E., Revel, M., Van der Gaast, S., Zielinski, G. A., Vaars, A., and Kukla, G., 1997, Asian provenance of glacial dust (stage 2) in the GISP2 ice core, Summit, Greenland: Journal of Geophysical Research (in press).
Bond, G. C., and Lotti, R., 1995, Iceberg discharges into the North Atlantic on millennial time scales during the Last Glaciation: Science, v. 267, p. 1005-1010.
Cuffey, K. M., Clow, G. D., Alley, R. B., Stuiver, M., Waddington, E. D., and Saltus, R. W., 1995, Large Arctic temperature change at the Wisconsin-Holocene glacial transition: Science, v. 270, p. 455-458.
Dansgaard, W., Johnsen, S. J., Clausen, H. B., Dahl-Jensen, D., Gundestrup, N. S., Hammer, C. U. , Hvidberg, C. S., Steffensen, J. P., Sveinbjörnsdottir, A. E., Jouzel, J., and Bond, G., 1993, Evidence for general instability of past climate from a 250-kyr ice-core record: Nature, v. 364, p. 218-220.
Denton, G. H., and Hendy, C. H., 1994, Younger Dryas age advance of Franz Josef Glacier in the Southern Alps of New Zealand: Science, v. 264, p. 1434-1437.
Guilderson, T. P., Fairbanks, R. G., and Rubenstone, J. L., 1994, Reconciling tropical sea surface temperature estimates for the last glacial maximum: Science, v. 263, p. 663-665.
Hajdas, I., Ivy-Ochs, S. D., Bonani, G., Lotter, A. F., Zolitschka, B., and Schlüchter, C., 1995, Radiocarbon age of the Laacher See tephra: 11,230 Ý 40 BP: Radiocarbon, v. 37, p.149-154.
Meese, D. A., Gow, A. J., Grootes, P., Mayewski, P. A., Ram, M., Stuiver, M., Taylor, K. C.,
Waddington, E. D., and Zielinski, G. A., 1994, The accumulation record from the GISP2 core as an indicator of climate change throughout the Holocene: Science, v. 266, p. 1680-1682.
Stommel, H., 1962, On the smallness of the sinking regions in the ocean: National Academy of Science Proceedings, v. 48, p. 766-772.
Stute, M., Forster, M., Frischkorn, H., Serejo, A., Clark, J. F., Schlosser, P., Broecker, W. S., and Bonani, G., 1995, Cooling of tropical Brazil (5°C) during the last glacial maximum: Science, v. 269, p. 379-383.
Taylor, K. C., Lamorey, G. W., Doyle, G. A. , Alley, R. B., Grootes, P. M., Mayewski, P. A., White, J. W. C., and Barlow, L. K., 1993, The 'flickering switch' of late Pleistocene climate change: Nature, v. 361, p. 432-436.
Thompson, L. G., Mosley-Thompson, E., Davis, M. E., Lin, P.-N., Henderson, K. A. , Cole-Dai, J., Bolzan, J. F., and Liu, K.-B., 1995, Late glacial stage and Holocene tropical ice core records from Huascarán, Peru: Science, v. 269, p. 46-50.