|
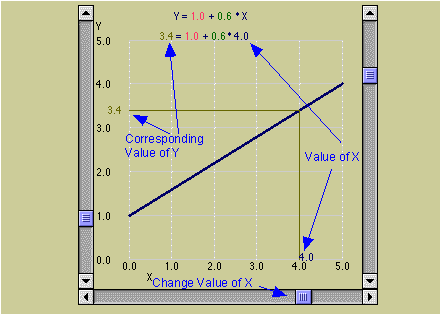
The yellow or gold crosshair lines show how the line relates a specific value of X to a
specific value of Y. From the value of X, draw a vertical crosshair up to the blue line.
From there, draw a horizontal crosshair to the Y-axis and read off the value Y that is
related to the value of X by blue line. This is the same as doing the calculations
specified by the equation of the line:
That is, take the value of X and multiply it by the value of the slope; then, add the intercept to get the value of Y that is related to the value of X.
|

