 |
Correlation Coefficient Formula
The prior page suggested agreement between the two z-scores for each observation
as a useful index for how correlated the variables are. This leads to the following
formula:


Open the Equations window with the button in the right margin if you would like to
see the mathematical details for this formula. The formula can be understood
intuitively. The correlation is simply the average product of all the pairs of
z-scores. If there is a perfect positive relationship, then
all the z-scores will be equal. That in turn means that all their products will be
positive so that the sum of the products will be large. It turns out (see the Equations
window for details) that for a perfect positive relationship, the typical or average
z-score product equals 1.
|
|
|
On the other hand, if there
is a perfect negative relationship, then all the z-scores will have the same value,
but with opposite signs from each other. That in turn means that all their products will
be negative, so that the sum of the products will be a large negative number.
Finally,
if there is no relationship between the two variables, about half the time the z-scores
in a pair will have the same sign and so give a positive product and about half the
time the z-scores will have opposite signs and so give a negative product. In the
sum, the positive and negative products will tend to cancel, yielding a sum near 0.
|
|
|
Example Calculations
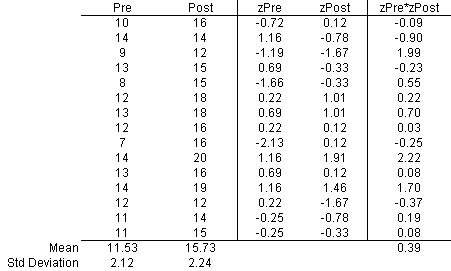
Below are the correlation coefficient calculations for the pre- and post-SKQ scores. The first two columns present the data and their means
and standard deviations. The middle two columns are the respective z-scores calculated
from


|
|
|
The last column is the product of the two z-scores in each row. The average or mean
of the last column is 0.39 and equals the correlation coefficient.

The correlation coefficient


indicates a moderate positive relationship between the Statistical Knowledge
Scores at the beginning of the semester and those at the end. That is, students
with higher scores at the beginning of the semester tended to have higher scores
at the end of the semester as well.
|
|
| |
Almost all statistical computer programs can calculate the correlation coefficient
for you. However, when examining those correlation coefficients you should remember
their conceptual definition illustrated above.
|
|
|
File:
© 1999, Duxbury Press.
|
|