Statview
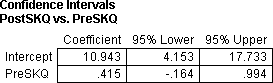
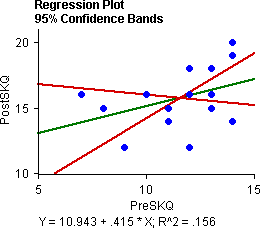
In addition to the numerical values for the confidence interval, StatView will also
plot the corresponding slopes on the scatterplot. In the graph below,
the green line is the regression line (i.e., the best slope) and the two red lines
denote lines with slopes equal to the 95-percent confidence interval limits.
Return to Top
JmpIn
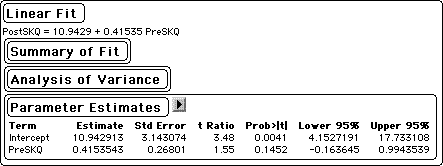
Return to Top
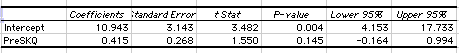
Minitab
Minitab does not provide the confidence interval for the slope. It can be calculated
from the standard regression output.

Return to Top
Excel
Return to Top