 (b)
(b)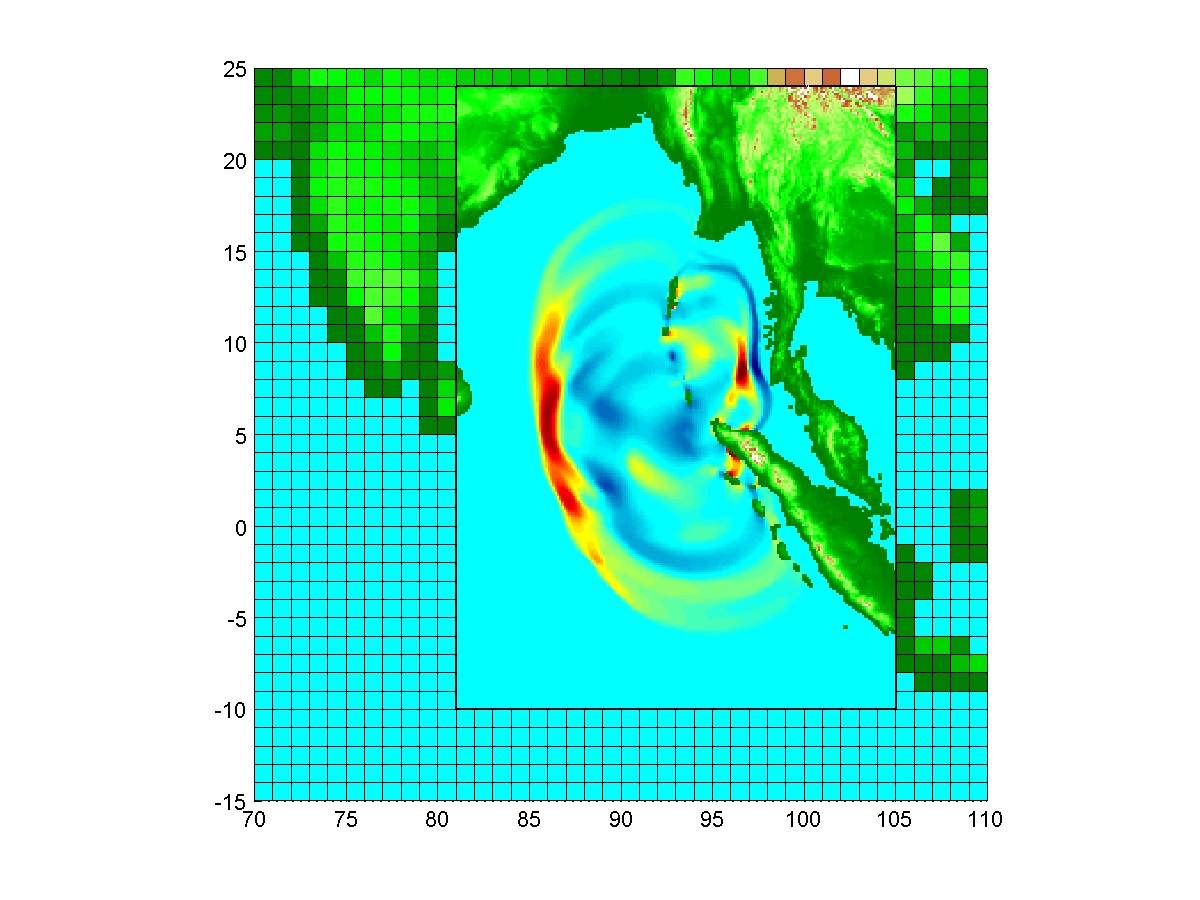
Figure 2: (click to enlarge)
(b)
 (d)
(d)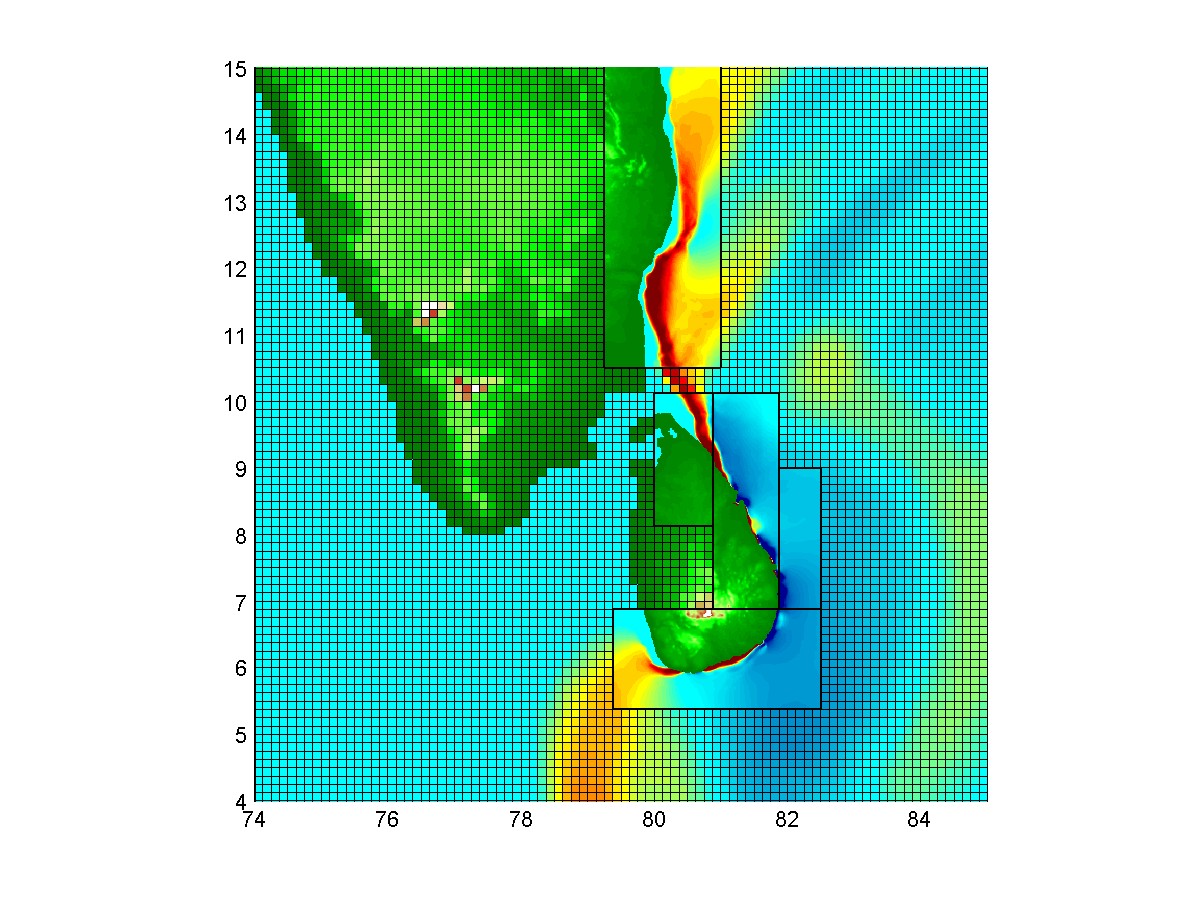
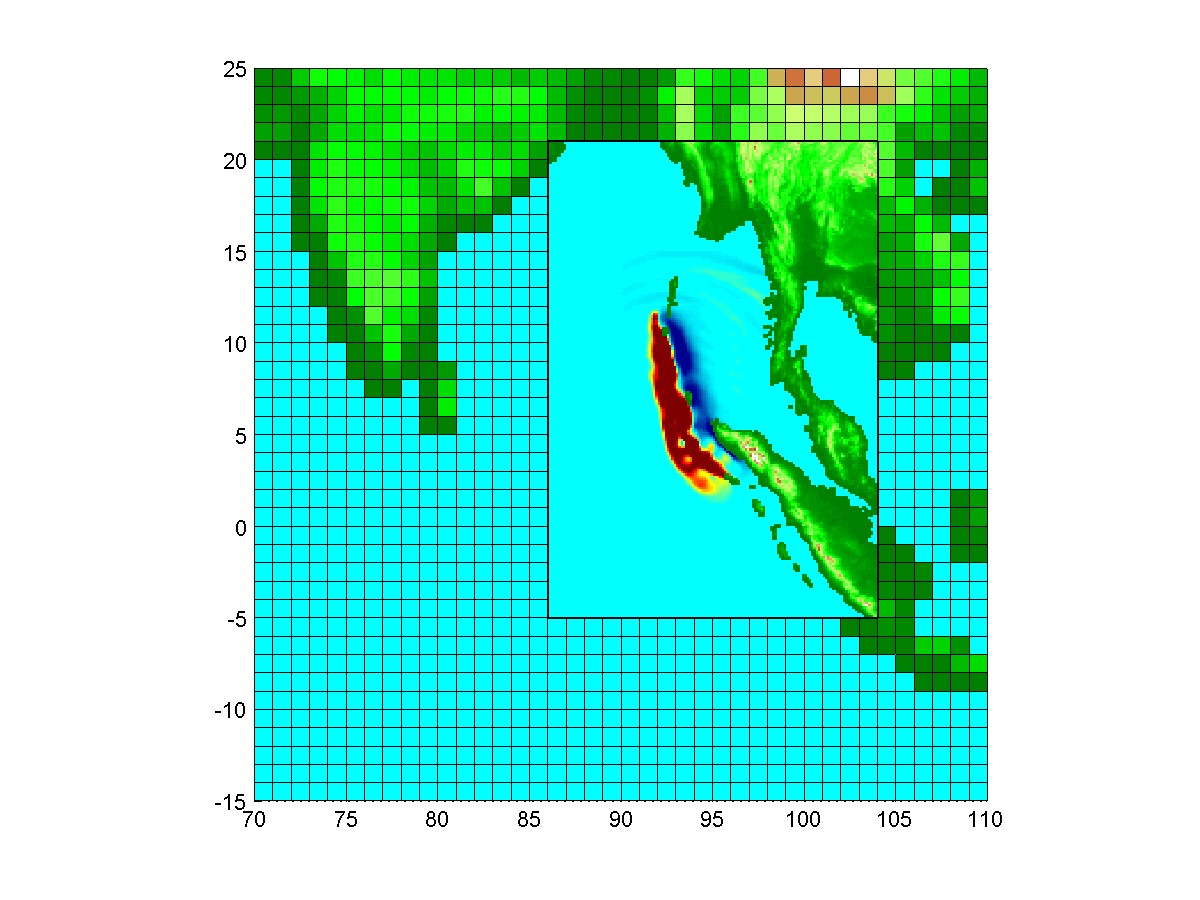
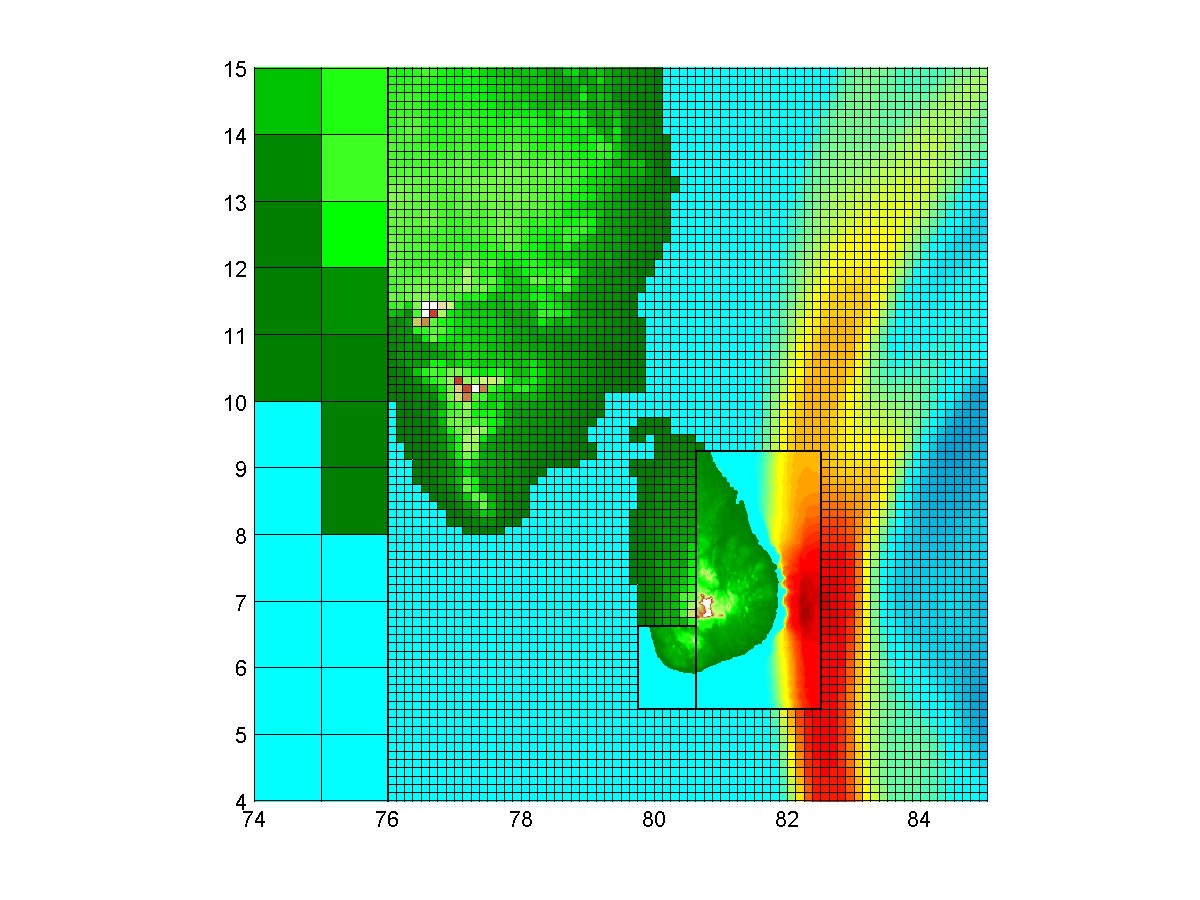
Caption: Propagation of the 26 December 2004 tsunami across the Indian Ocean. Units on the axes are longitude and latitude. The top two frames show the Bay of Bengal at two early times. A coarse grid is used where nothing is yet happening and the grid cells are shown on this ``Level 1 grid'', which has a mesh width of one degree (approximately 111 km). The rectangular region where no grid lines are shown is a Level 2 grid with mesh width 8 times smaller, about 14 km. Red represents water elevation above sea level, dark blue is below the undisturbed surface. Figure (c) shows a zoomed view of the southern tip of India and Sri Lanka at a later time. The original Level 1 grid is still visible along the left-most edge, but the rest of the region shown has been refined by a Level 2 grid. Part of Sri Lanka has been refined by Level 3 grids. The grid lines on Level 3 are not shown; the mesh width on this level is about 1.7 km, a factor of 8 finer than Level 2. Figure (d) shows a later time, as the wave diffracts around Sri Lanka, moving slowly through the shallow water in this coastal region. The calculation shown here was run on a single-processor 3.2 GHz PC under Linux and took about 40 minutes of wall time for the computation shown here.
Program generating these figures:
Some more recent results and movies: