Test of Pulse Delay along Carotid Path to Brain
Beach, Zaccardi, Leotta
April 02, 2014
and
FlowNet
|
|
|
|
|
|
|
|
|
|
|
|
|
|
|
|
|
|
|
|
|
|
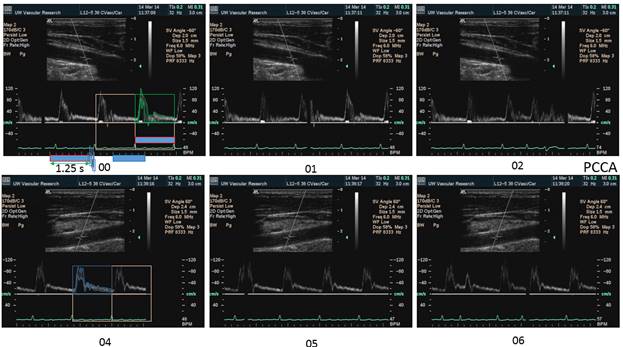
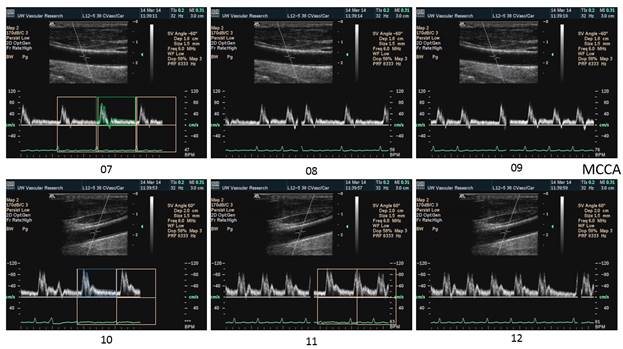
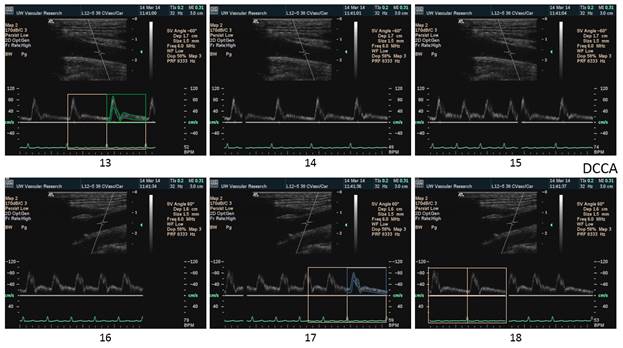
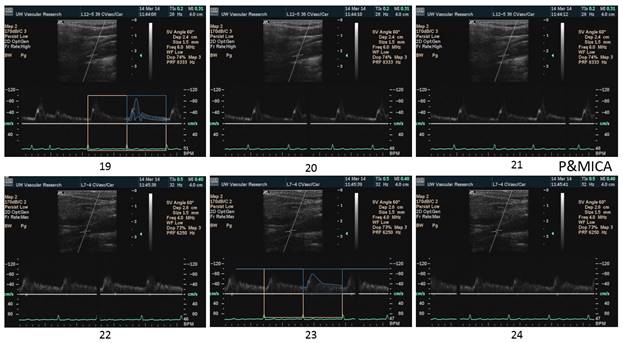
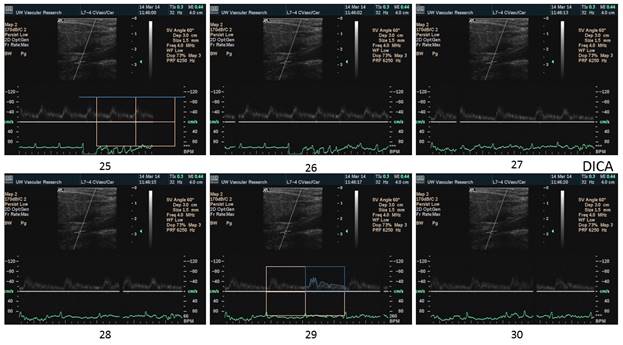
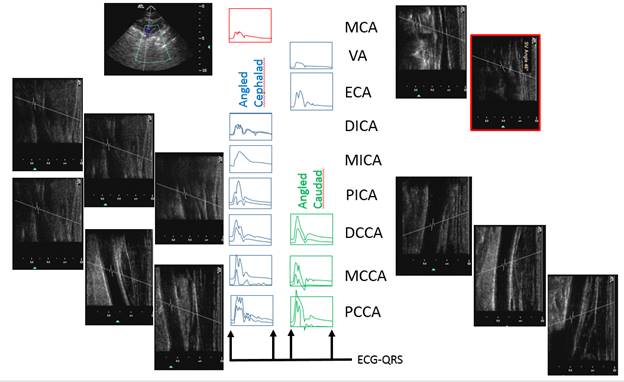
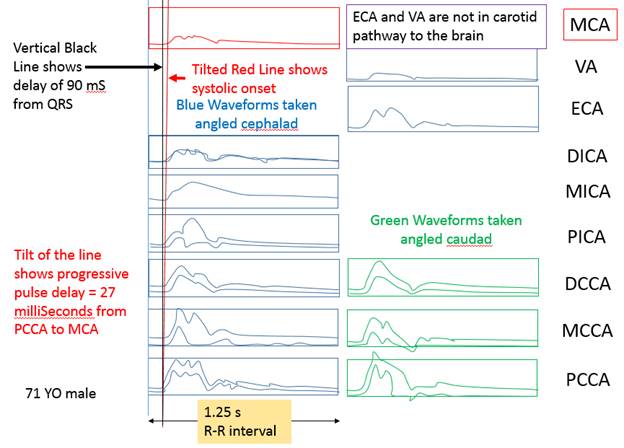
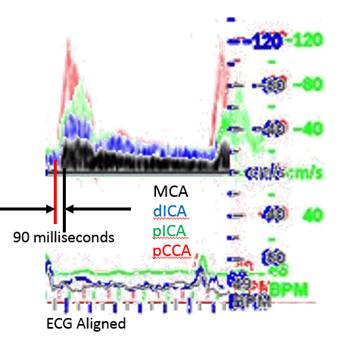
There is a blue rectangle that establishes the time coincidence by vertical lines. An orange vertical line marks the onset of systole. Interestingly, the MCCA systolic onset appears to be delayed. The alignment of peaks is marked by a bright blue line and the alignment of the end systolic trough is marked by a light blue line. Only the onset of systole shows a progressive delay from PCCA to MCA. The peaks appear to occur earlier at the MCA than at the PCCA. The end-systolic trough appears to occur at the same time in all locations HYPOTHESIS The hypothesis is that the DICA and MCA will be delayed in onset and peak, at least in the cases of VULNERABLE CAROTID STENOSIS. I’m going to duplicate this slide and spread the time scale to emphasize the effect. The MCCA looks like there is a delay. Cause unknown. |
|
|
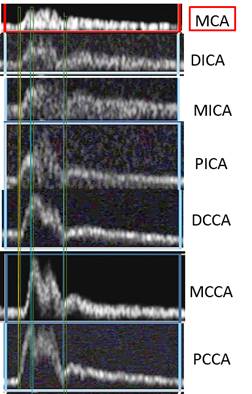
Pictures cropped and scale moved adjacent using Microsoft utility “Paint”
Image Process using ImageJ [http://imagej.nih.gov/ij/]
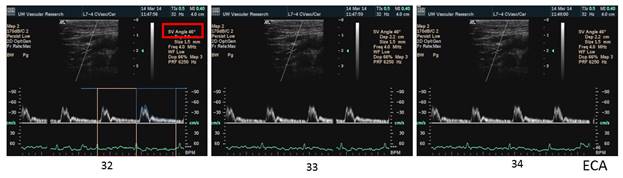
clipPCCA.jpg Process>EnhanceContrast>Equalize Edit>Invert clipPCCA1.jpg Image>Color>SplitChannels Blue Edit>Select>All Edit>Clear Analyze>Histogram Process>Math>Subtract 100 Process>EnhanceContrast>Equalize Delete Green Edit>Invert Image>Color>MergeChannels RED=blank GREEN=image BLUE=image makes RED Edit>Invert Process>Math>Subtract 100 Process>SubtractBackground min146 PICA Green Transparent color set for overlay using Powerpoint
|
|
|
|
|
|
|
|
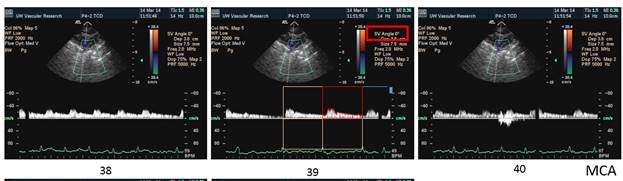
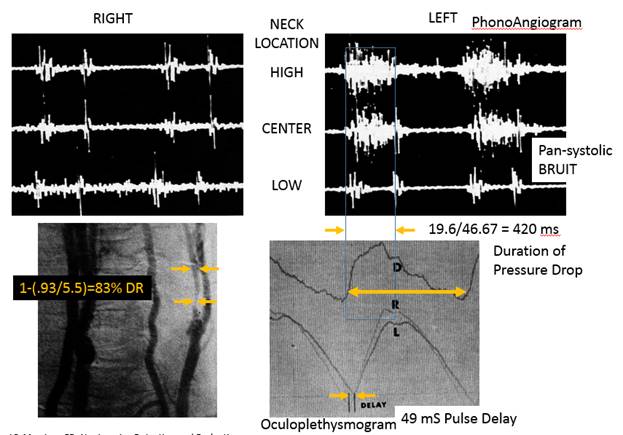
NORMAL 27 mS PROGRESSIVE Pulse Delay stenotic side compared to normal side 83% DR stenosis causes 50 mS additional pulse delay due to the stenosis This delay will occur across the stenosis. This delay will be seen as a step delay and according to the hypothesis, this is the marker of a vulnerable plaque Bruit should also be seen on spectral waveform occlusion causes a 200 mS pulse delay.
|
 Kartchner MM, McRae LP, Morrison
FD, Noninvasive Detection and Evaluation of Carotid Occlusive Disease, Arch
Surg, 106:1973pp528-535
Kartchner MM, McRae LP, Morrison
FD, Noninvasive Detection and Evaluation of Carotid Occlusive Disease, Arch
Surg, 106:1973pp528-535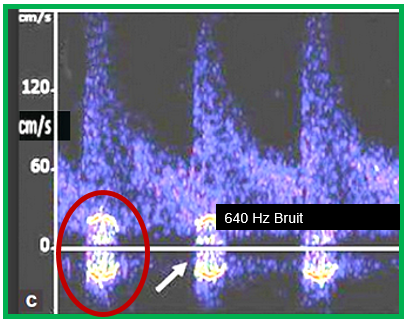
EXAM INSTRUCTIONS
- Display ecg on the screen
- For pulse delay, increase sweep speed
- For Bruit, reduce velocity scale (permit aliasing)
- For stenotic velocity, incrase velocity scale.
+++++++++++++++++++++++++++++++++
Re: Correlating with CT Return to INBOX
From: Kirk W Beach <kwbeach@u.washington.edu>Add
Reply-To: UVM Flownet <UVMFLOWNET@list.uvm.edu>
To: UVMFLOWNET@LIST.UVM.EDU
Date: Tue, 1 Apr 2014 11:27:49 -0700
Dear Bills
Thanks for your kind words about the paper "Correlation is futile".
Perhaps another paper called "Correlation is pointless" should follow.
PLEASE SEE THE INVITATION AT THE END OF THIS MESSAGE
The "futile" paper combines some data from published papers on the relationship between Duplex Doppler Ultrasound and X-ray Contrast Angiography. This is the relationship between physiology (velocity) and anatomy (stenosis). Of course, such an analysis includes the uncertainty of angiographic measurement as well as the uncertainty of Doppler ultrasound. Mixed in here is the variation of the patient from day to day. We didn’t explore things like drug usage (nicotine, caffeine), but even the effect of respiratory rate (altering end expiratory carbon dioxide) is a factor.
The "pointless" paper should address the real issue about carotid disease diagnosis and classification.
The percent angiographic stenosis is not a worthwhile goal, it is a legacy of history.
The important questions are:
Which carotid stenosis, if left untreated, will cause a stroke?
And which of those, if treated, will prevent a stroke?
Only the latter should be treated, of only we could know.
This is the quest for the “vulnerable plaque”.
Our thinking about this is still muddled.
We know that treating all cases of anatomic carotid stenosis with endarterectomy or stent reduces the chance of stroke from about 25% to about 12%. Most of the treated cases do not benefit; this leads to the quest for the "vulnerable plaque".
I think that we are talking about embolic stroke not obstructive stroke (the conversion of a stenosis to occlusion with stroke; most conversions to carotid occlusion are asymptomatic). I’m trying to ascertain whether the emboli are thromboemboli or atheroemboli. Certainly all of the paradoxical and cardiac emboli are thromboemboli, but those from aorta, carotids and intracranial arteries are likely to be atheroemboli, and thus not amenable to thrombolysis. Retinal embolic occlusions appear to be about half thromboembolic and half atheroembolic (Hollenhorst plaque, although some think differently of this).
In our tabulations, we have included the endpoints of asymptomatic occlusion and Transient Ischemic Attack as "events" along with RIND, completed stroke with recovery, completed stroke with persistent disability and death to bolster the numbers. That has added to the confusion.
I’m old fashioned; I still believe in Kartchner and McRae, OPG and CPA. I think that it is the shear force of a pressure drop across a stenosis that rips the plaque apart: a hemodynamically significant (pressure reducing) stenosis. I don’t think that a flow reducing stenosis causes much stroke, the collaterals compensate.
INVITATION
I’d like to start a multicenter collaboration with any of you who are interested and able to provide evidence from anonymized clinical examinations for a Doppler signature of vulnerable plaque. Of course, we won’t be able to prove that the signature is valid, only that it is plausible. This would not be a research project; no personal identification information would be exchanged, and no clinical care would be affected.
Participation will add a few minutes to each examination and a dollar or so to the supplies.
To participate, here is what you need:
1. An ultrasound duplex scanner with on screen ECG display, an ECG cable and electrodes.
2. A carotid scanhead (? Linear array, 5 to 10 MHz with steerable Doppler).
3. A transcranial scanhead (? Phased array, 2 MHz)
Here is the examination protocol:
Bilateral spectral waveforms will be acquired and labeled from the CAROTID ARTERIES: pCCA, mCCA, dCCA, pICA, mICA, dICA, ECA, Vertabral VA, CEREBRAL ARTERIES: MCA, PCA, ACA
(so this is a scanhead change and 3 extra arteries on each side)
Each spectral waveform image will be captured with:
1. A project ID sufficient to allow the 22 waveforms to be associated together.
2. An anatomic site label on each image.
3. Doppler examination angle of 60 degrees or if impossible then ZERO degrees.
4. ECG tracing showing the QRS wave for timing alignment of the spectral waveforms.
5. Expanded time axis to show just 2 cardiac cycles across the screen to emphasize timing.
6. IF A BRUIT IS PRESENT at the location, a duplicate waveform with the velocity scale turned down so that the bruit frequency and intensity can be measured from the double sideband harmonics PLUS a notation of the Doppler Ultrasound Frequency used for this acquisition.
EXPECTED RESULT
NORMAL CAROTID LUMEN
1. When the waveforms are time aligned, from pCCA to MCA, each successive waveform location will have upslope onset delayed from the prior (next lower) by 15 milliseconds, a total delay of 90 milliseconds.
PRESSURE REDUCING STENOSIS
2. The pulse delay between the waveform just proximal to the stenosis and the waveform just distal to the stenosis will have the upslope onset delayed an additional 50 milliseconds.
3. Waveforms from distal to the stenosis will have a “tardus parvus” rounded systolic shape.
4. At the distal zone of the stenosis, a bruit signature will be present lasting through systole.
5. The angiographic residual lumen diameter of the stenosis = 500/(bruit frequency)[mm*Hz).
6. The peak systolic Doppler velocity (PSV) in the stenosis will be greater than 350 cm/s.
STENOSIS WITHOUT PRESSURE REDUCTION
No additional pulse delay, No bruit, might have a high velocity.
EXPECTED BENEFITS TO PATIENTS:
1. It is likely that about 30% of strokes originate in the carotid arteries and an additional 15% originate in the intracranial arteries. Currently there is no standard examination protocol to find an intracranial stenosis, even though now, with the popularity of stenting, an intracranial stenosis is treatable.
2. Planning of stent procedures is useful, knowing the residual lumen diameter before the procedure allows planning.
HYPOTHESES TO BE TESTED
1. Pulse delay is associated with bruit duration and intensity
2. Pulse delay is associated with “tardus parvus” shape.
RESULTS REPORTING
These anonymized groups of waveforms will be assembled into a convenient display format and posted for the amusement and enlightenment of Flownet members. This will provide some background data for anyone who would like to compare these results with:
1. Gray Scale Median or other echogenicity measure.
2. Angiographic findings (especially timing of contrast).
3. MRI plaque character.
If you are interested in participating, please email me at kwbeach@uw.edu.
I’m expecting about 10 volunteers.
I’ll provide instructions and examples of how I think that the display should be done.
For those who send the image sets to me, I’m happy to assemble them into the display and post them.
For others, I hope to figure out a way for you to post the images directly.
I look forward to your critical responses.
Thanks for reading this far.
Kirk
For those worried about confidentiality and human subjects issues, I think that this project is similar to creating slides for a poster or oral meeting presentation, properly anonymized images should be OK.
******************
On Sun, 30 Mar 2014, Bill Johnson wrote:
Bill, Thank you for the references. Dr. Beach's article is not available free in its entirety, but the abstract is available on Pub
Med. I love the title ",,,Correlation is Futile." Sounds like something the Borg would say. ;-)
The full second article; Effect of Nonoptimal Imaging on the Relationship Between the Measured Degree of Symptomatic Carotid
Stenosis and Risk of Ischemic Stroke is available at http://stroke.ahajournals.org/content/37/7/1785.long
I agree completely with what Bill wrote, with the caveat that I do not believe any test is 100% accurate.
On Sun, Mar 30, 2014 at 7:36 AM, Bill Schroedter <bschroedter@qualityvascular.com> wrote:
I don’t really have an answer for you Christina but for carotid stenosis, I would direct you to a recent paper by our
friend Dr Beach.
Carotid Doppler Velocity Measurements and Anatomic Stenosis, Correlation is Futile. Beach et al. Vasc Endovascular
Surg 2012
His conclusions (there are many more)
The relationship between Doppler velocity measurements and angiographic stenosis contains significant intrinsic variability
· Ultrasound - 7% disagreement using PSV
· Angiography - 24% disagreement between readers
Duplex velocity criteria are best applied:
· as a threshold value (>70% stenosis)
· to define broad stenosis categories (50-79% stenosis)
Further refinements in Doppler velocity criteria will NOT lead to improved correlation with angiographic stenosis and he
also addresses many of the issues that result in his conclusions
Also look at this paper (which is an update of sorts of the work that Kirk and Dr Strandness did 30 years ago which
showed nearly the same thing). Cuffe R , Rothwell P Stroke 2006;37:1785-1791 - a meta-analysis which looked at the
relationship between the degree of stenosis measured by 2 independent observers on the preselected angiographic view
showing the stenosis most clearly in patients with selective carotid injection CAAs with biplane views.
At the important 70% stenosis threshold ---
o One (1) reader comparing two views had a disagreement rate of 32%
o Two (2) readers reading the same best angiographic view had 24% disagreement.
For me, duplex scanning is the gold standard for those patients that insonate well. If I see it well with US, I know it
is correct. One of the advantages that US has over every other modality is we know up front whether it is a good quality
study or it is suboptimal. This is a great advantage.
Regards,
Bill
********************
William B Schroedter, BS, RVT, RPhS, FSVU
Technical Director
Quality Vascular Imaging, Inc
Venice, Florida
(941) 408-8855
www.qualityvascular.com
www.compressionsocks.pro
********************************
-----Original Message-----
From: UVM Flownet [mailto:UVMFLOWNET@list.uvm.edu] On Behalf Of Christina Lewis
Sent: Friday, March 28, 2014 3:00 PM
To: UVMFLOWNET@LIST.UVM.EDU
Subject: Correlating with CT
I'm interested to hear how others correlate with CT, specifically when it comes to diameter and degree of stenosis. How
much "wiggle room" do you allow for a positive correlation? For example, if you have an aortic diameter of 3.9 cm on
ultrasound, would 4.3 cm on CT be good enough for you? How many millimeters will you allow it to go? We tend towards
<5. CT tends to call an exact percentage of stenosis, as well, while we use <50, >50 and >75. Usually that is just
fine, but what would you do if they said 50% and ultrasound and called it >50? I know I'm probably splitting hairs with
some of these, but I'm just interested to see what others are doing.
As well, during angiography, we tend to see a lot of mild, moderate and severe. I've tried educating the surgeon to use
percentage ranges, but it doesn't seem to stick. I'm fairly comfortable with saying mild correlates to <50, moderate to
>50 and severe to >75. Anyone else run into this? How do you handle it?
Thank you, FlowNet!
http://list.uvm.edu/archives/uvmflownet.html