Page for Sverdrup/SEC work
Page for Sverdrup/SEC work
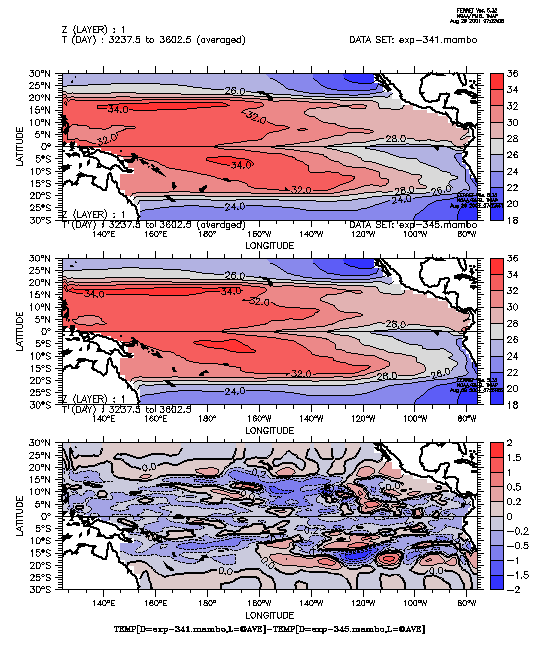
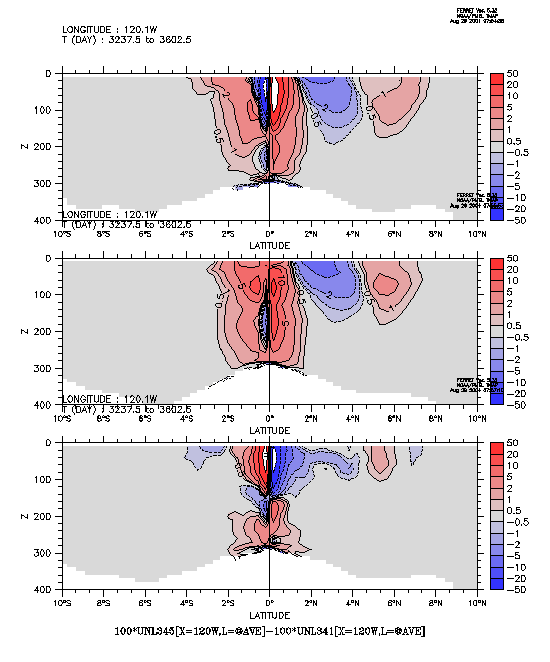
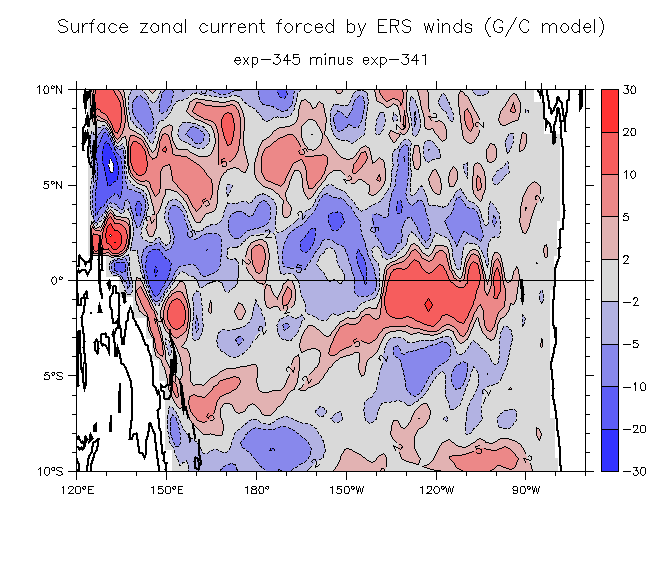
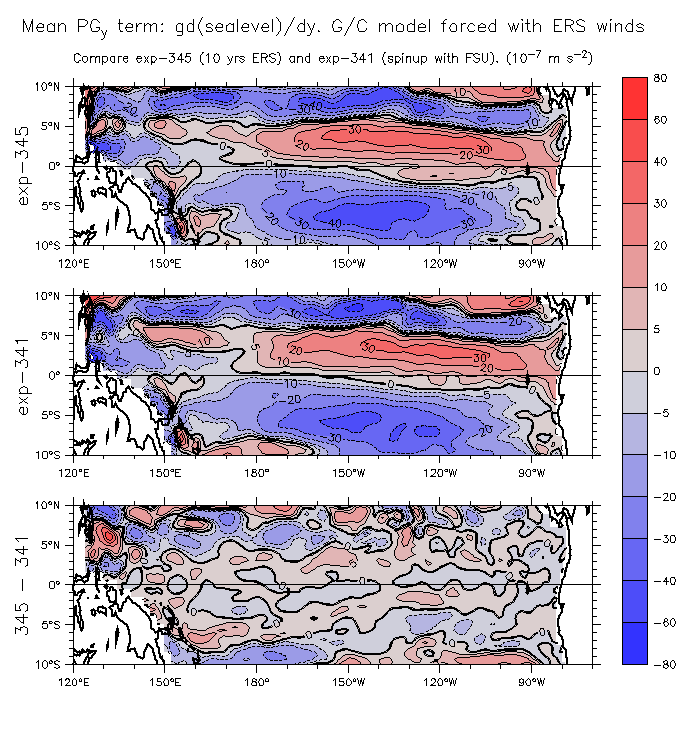
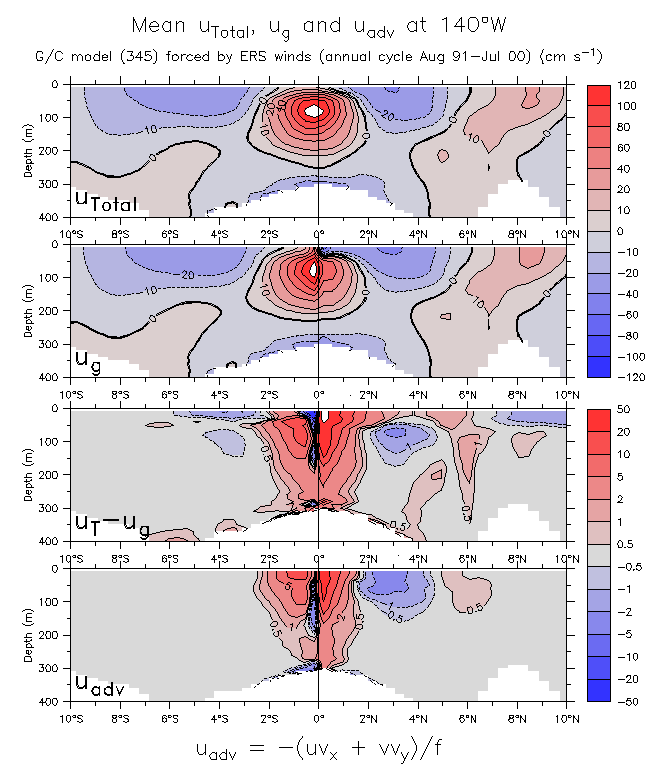
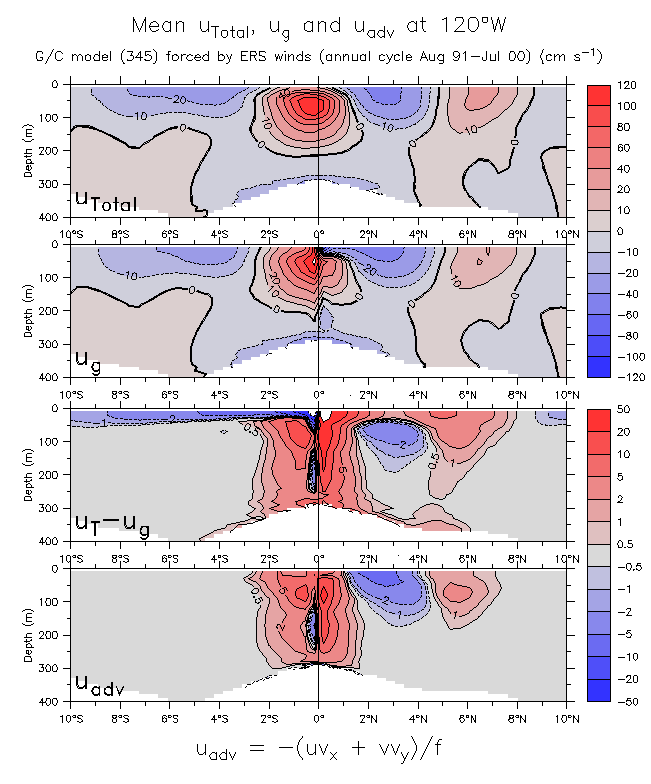
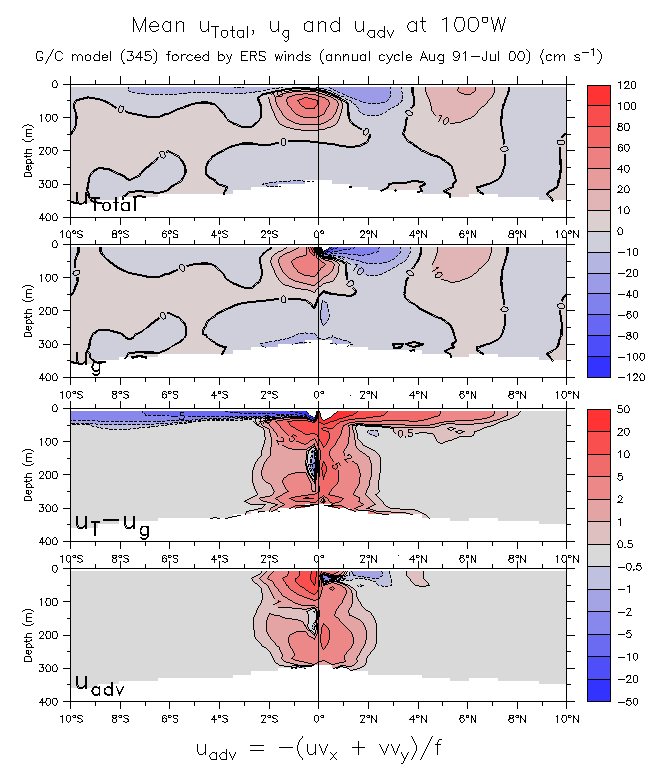
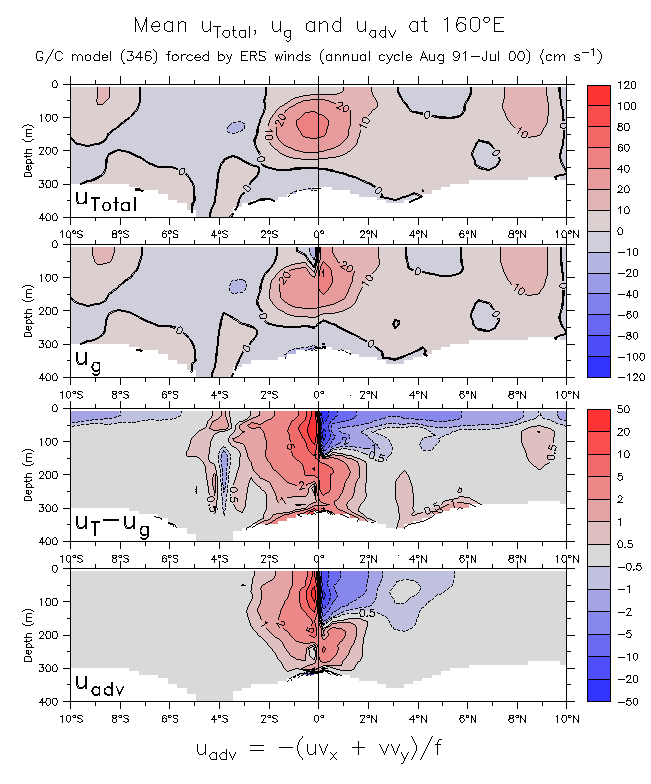
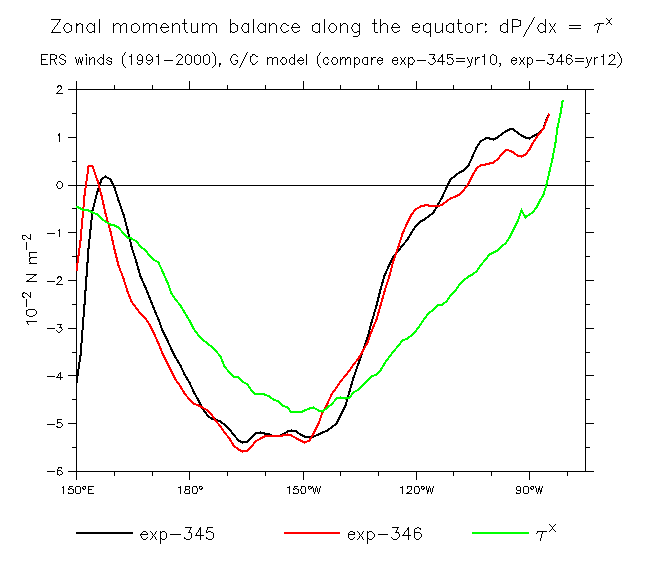
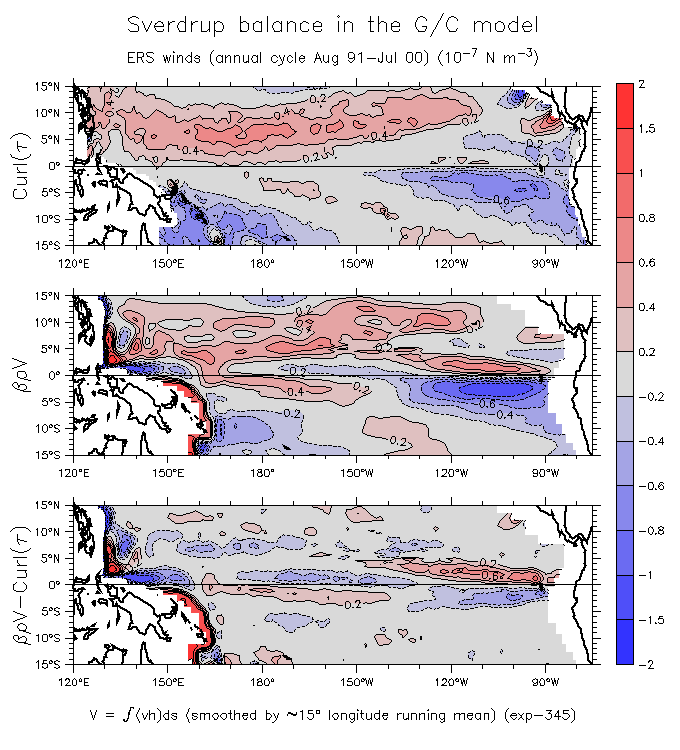
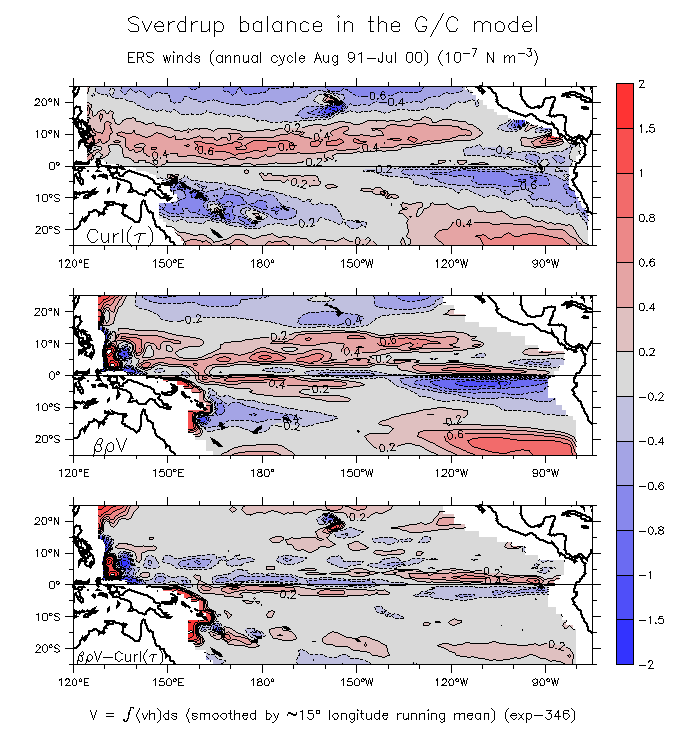
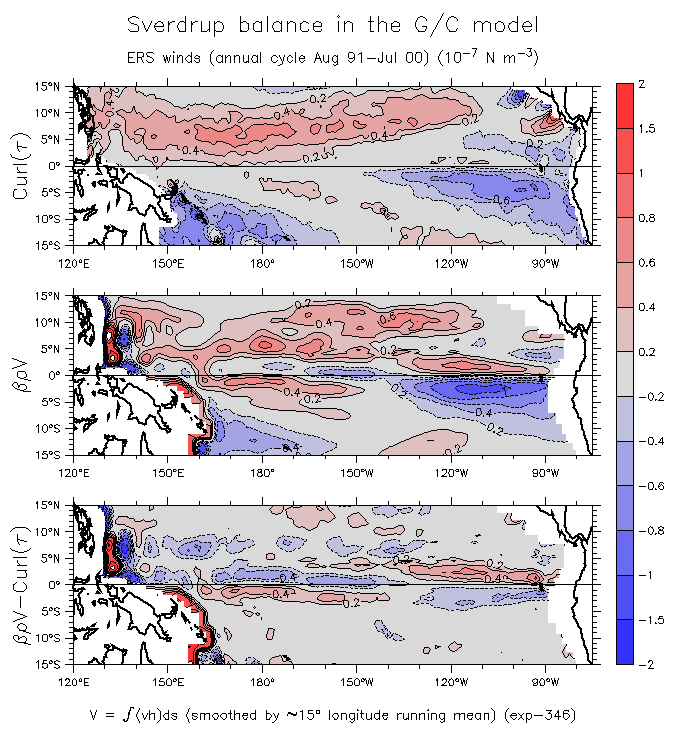
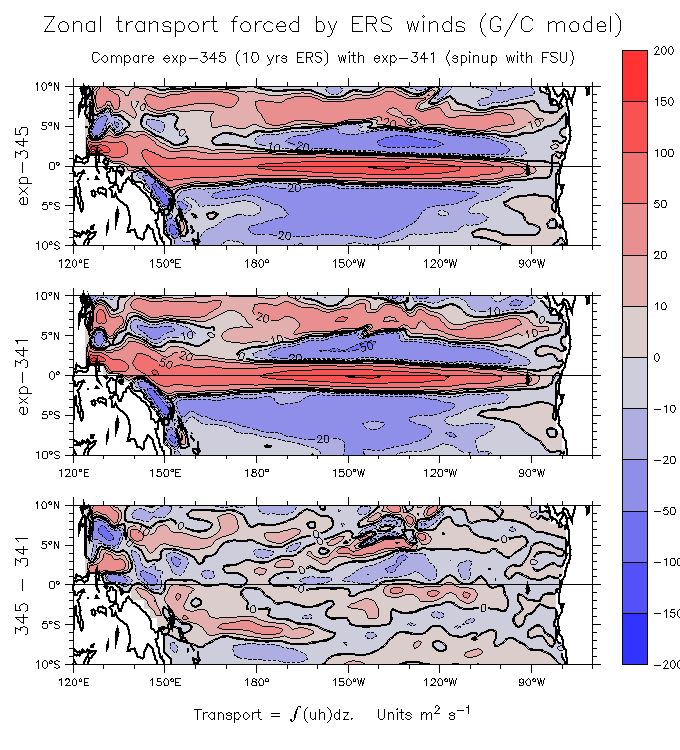
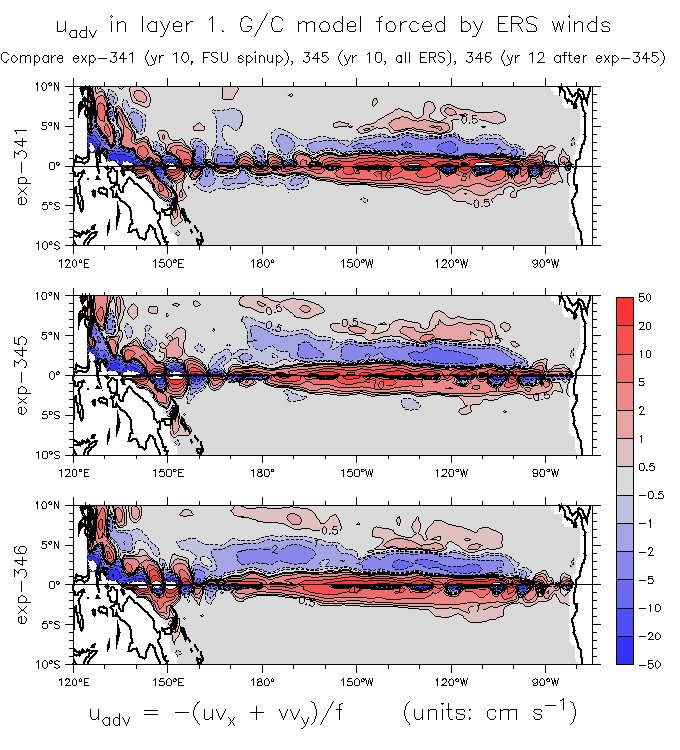
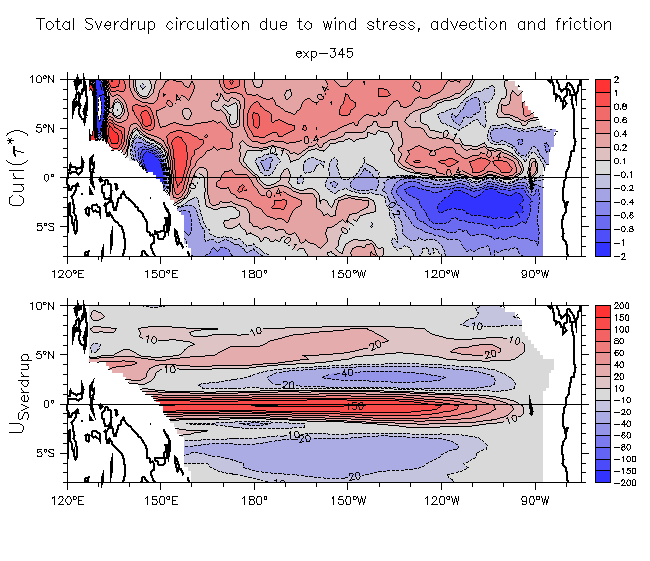
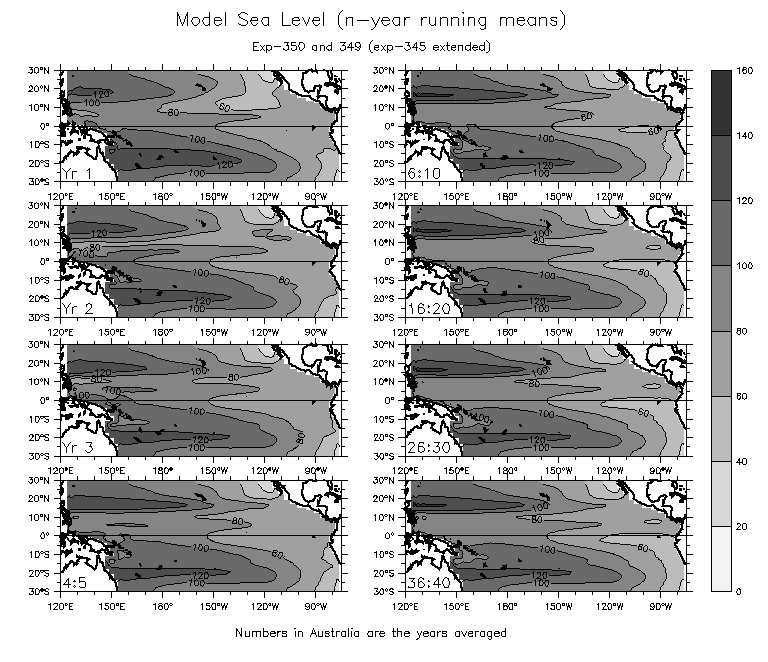
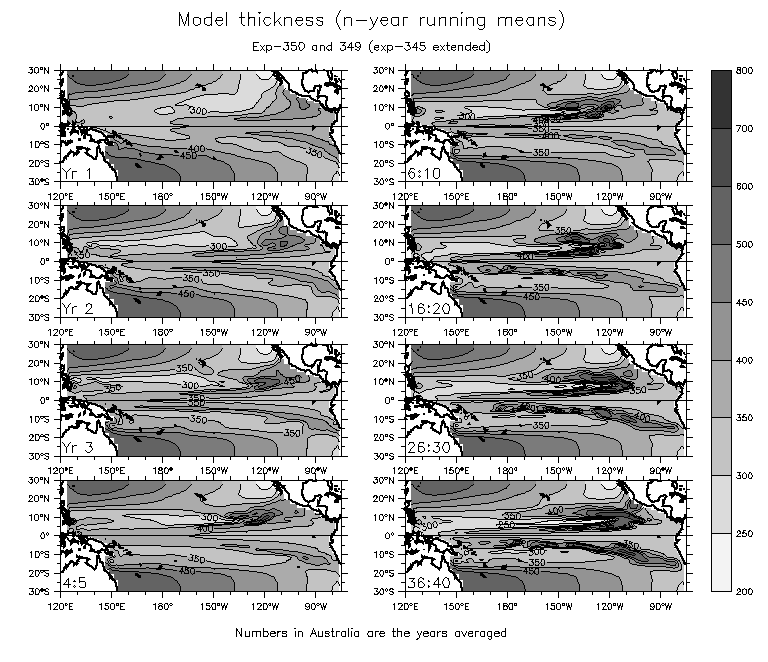
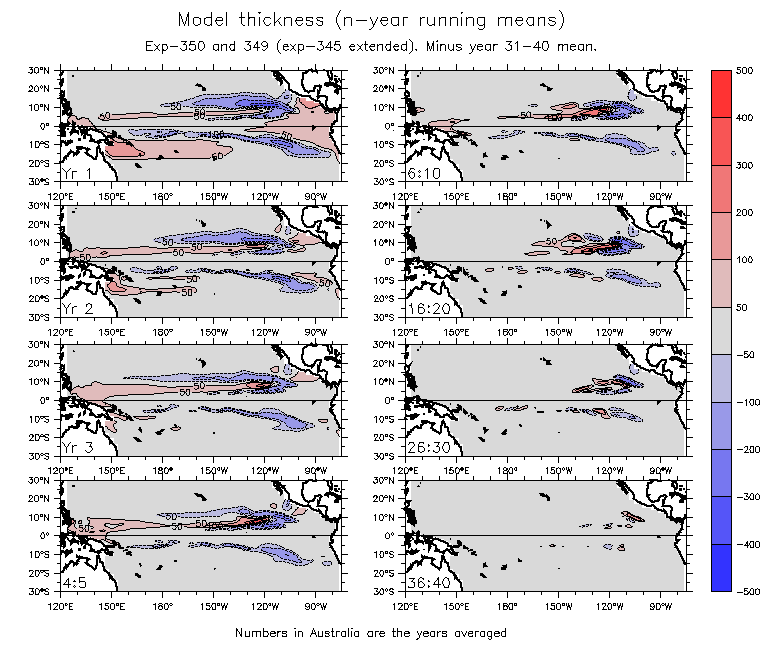
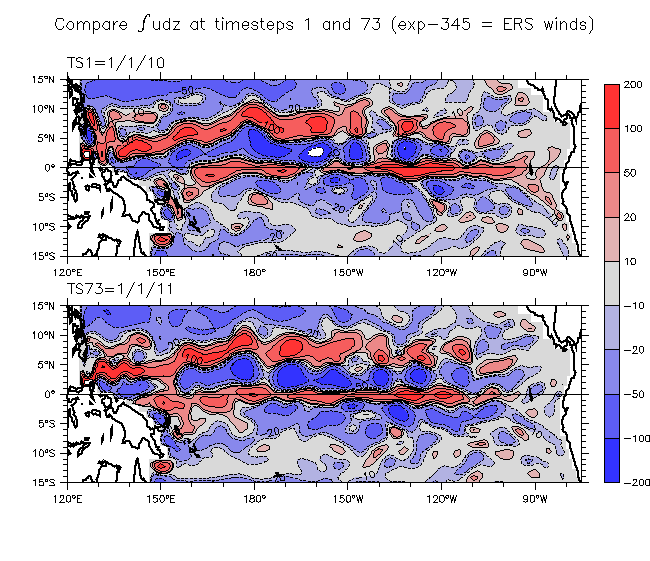
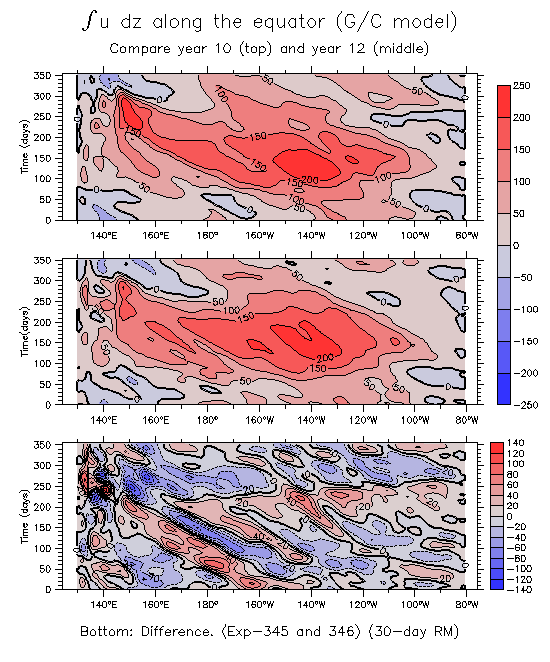
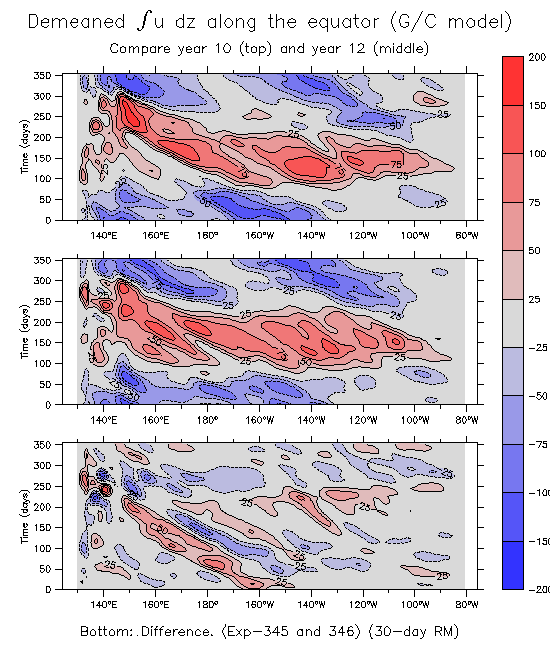
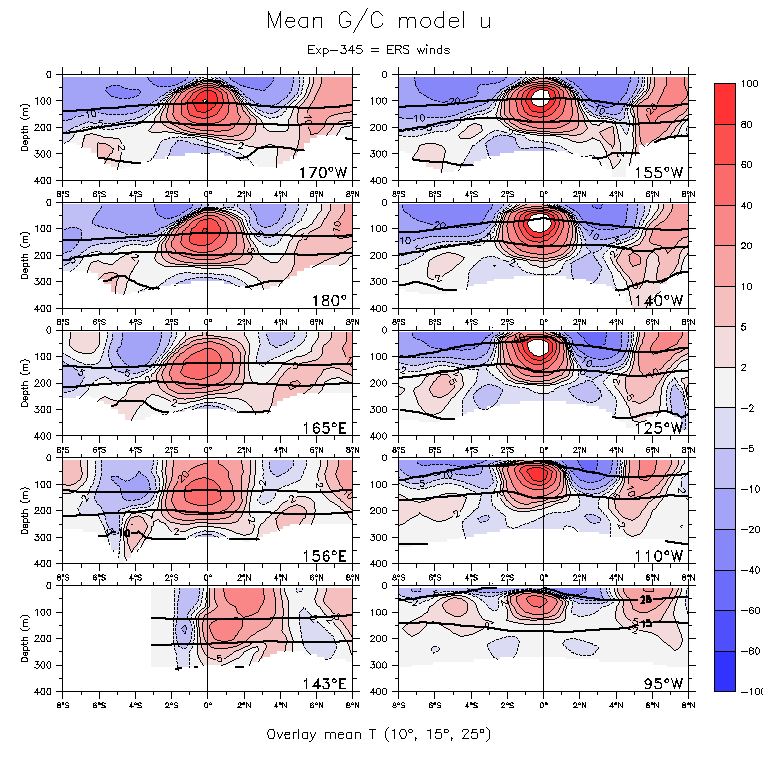
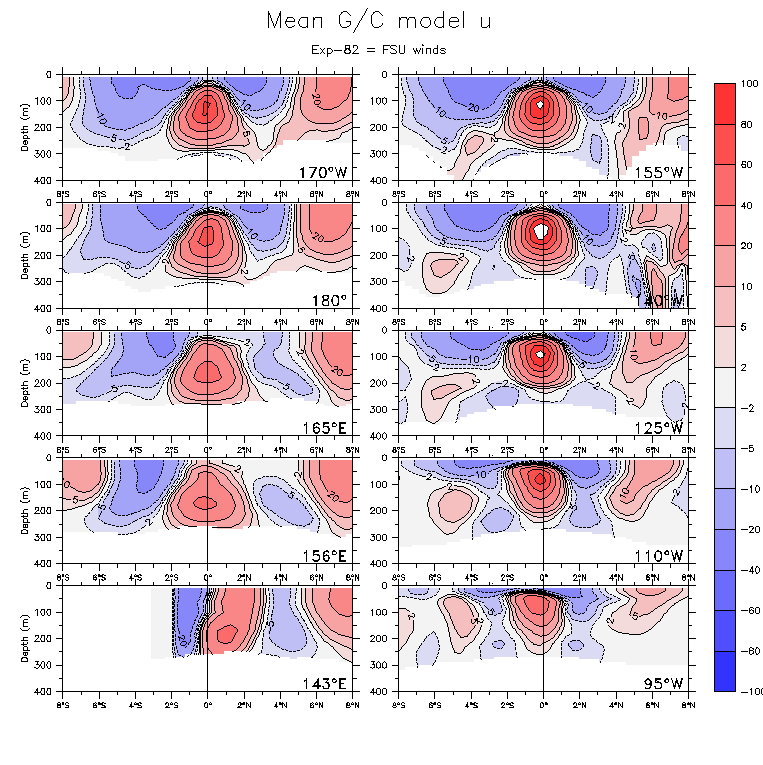
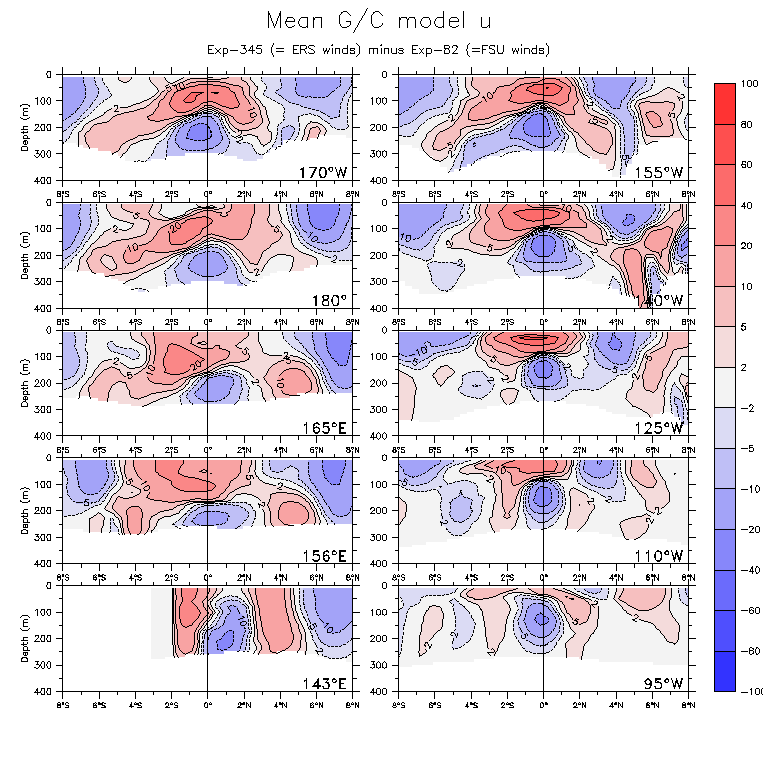
There are 4 ERS wind runs. exp-341 was restarted from exp-54 (FSU winds) after the end of year 5, and run 5 more years with ERS winds. exp-345 was started from zero with the same ERS winds and run for 10 years. 345 is the main run. exp-346 was restarted from the end of 345 and run 2 more years (= year 12). exp-349 was also restarted from the end of 345 and run for 30 more years.
Check comparisons between 341 and 345
- Rough plots: SST
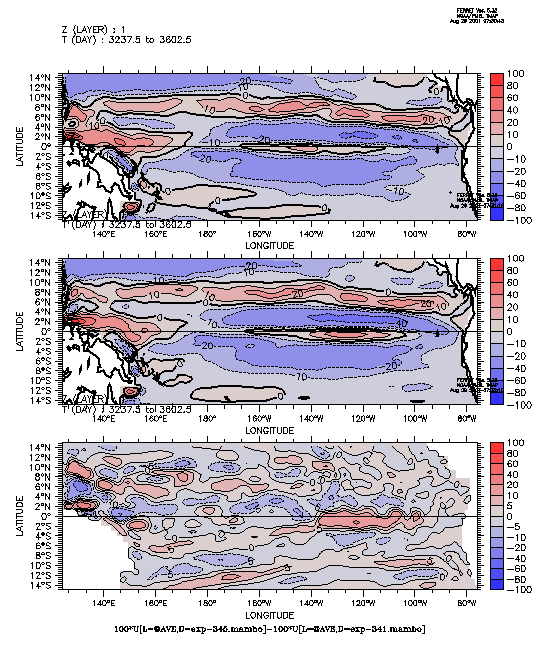
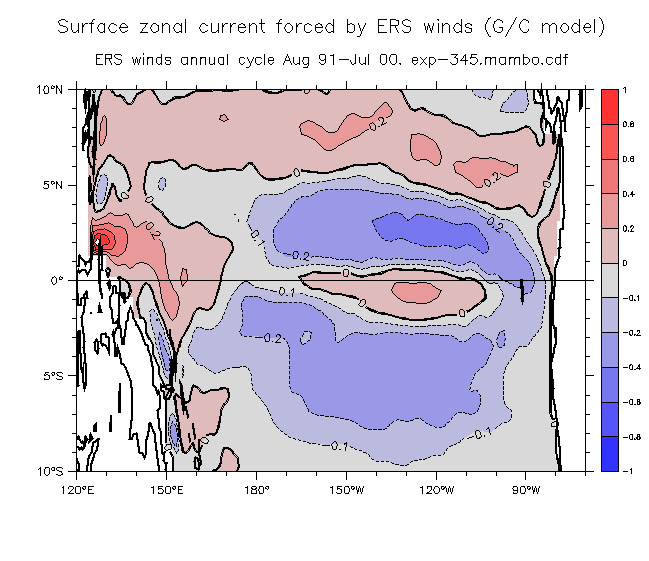
Sfc u
u along Eq
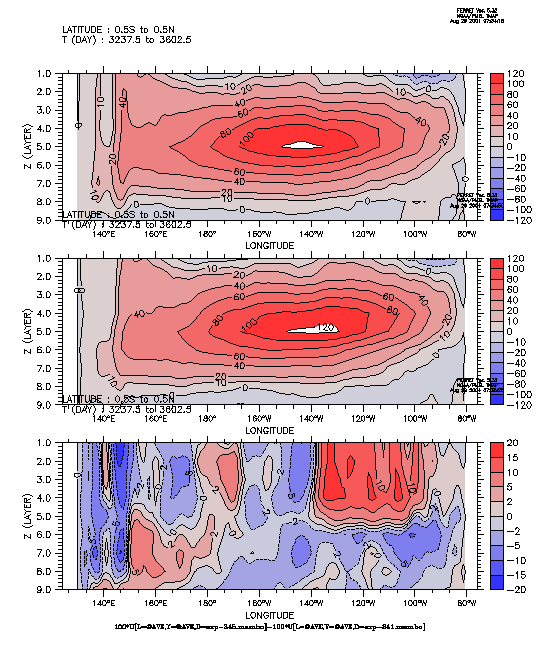
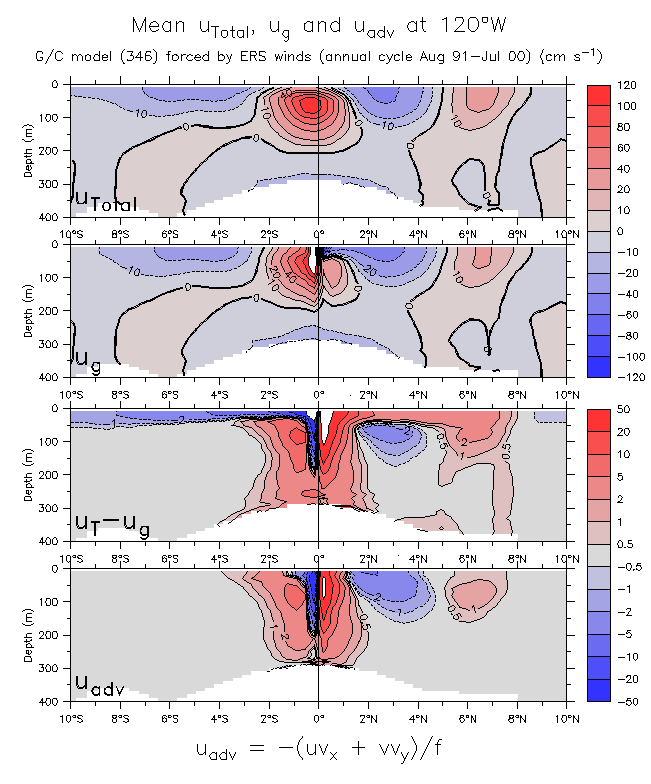
u on z at 120°W
u(advective) on z at 120°W
- Surface zonal current (ERS winds) Difference from exp-341
- Mean surface dp/dy (gd(sealevel)/dy)
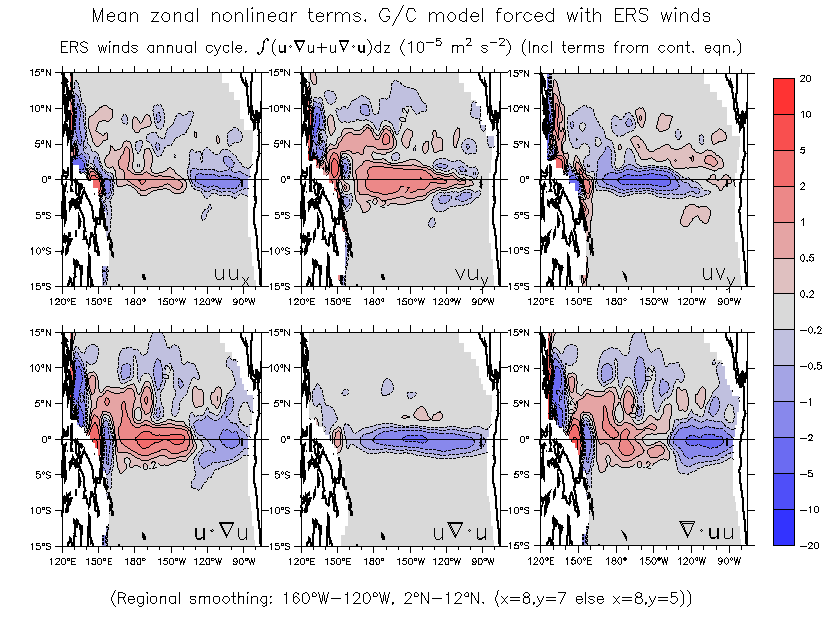
Many ways of comparing the Sverdrup, linear and nonlinear terms:
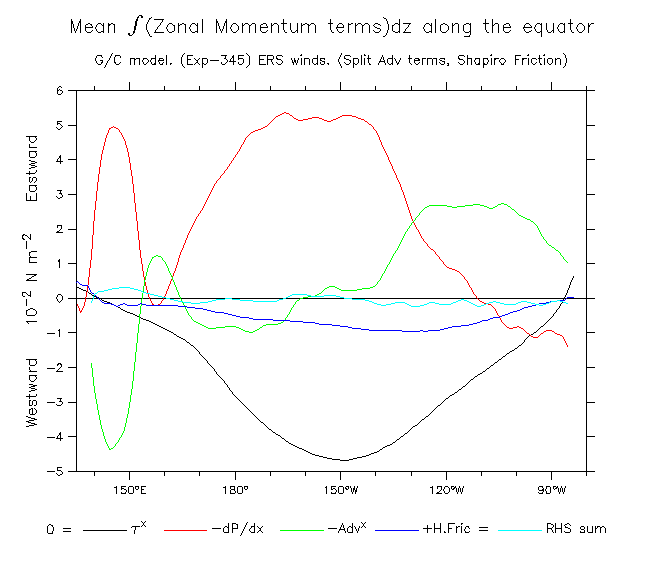
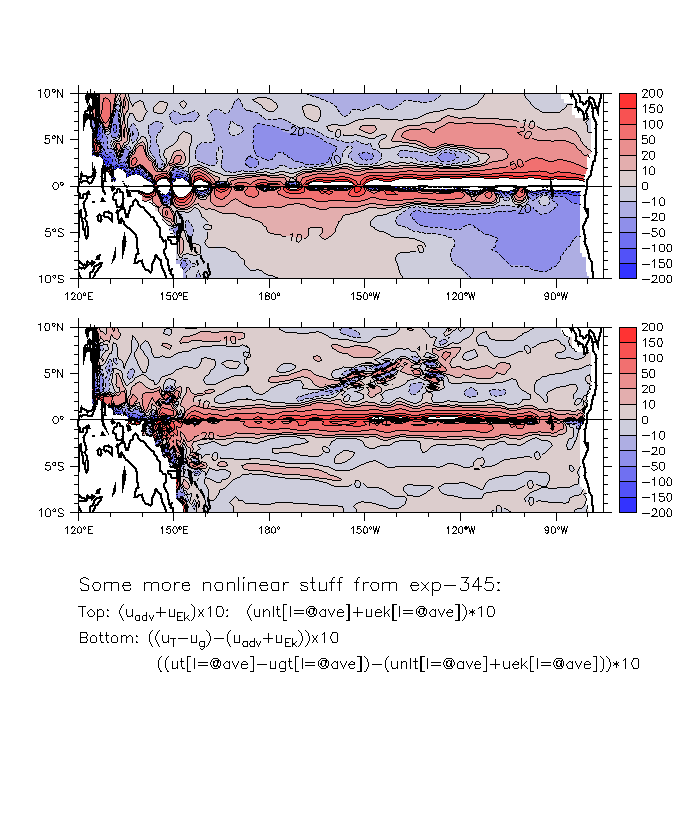
One idea is to define an "advective forcing" by moving the nonlinear terms over to the RHS, and define an advective Tauyadv =-(uvx+vvy), so uadv =Tauyadv /f, analogous to an Ekman transport. Also see below for Dennis's point that if uadv is a forcing, then it should also contribute to the curl.
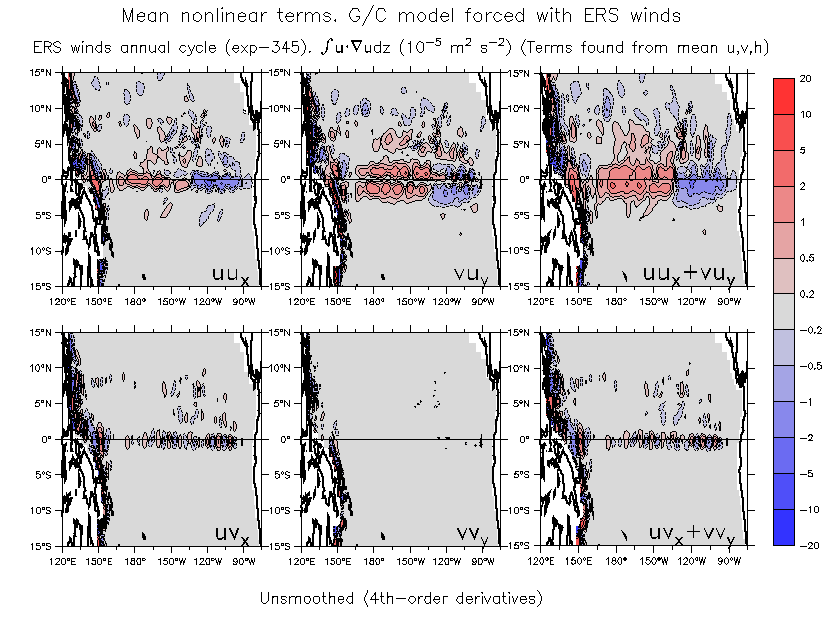
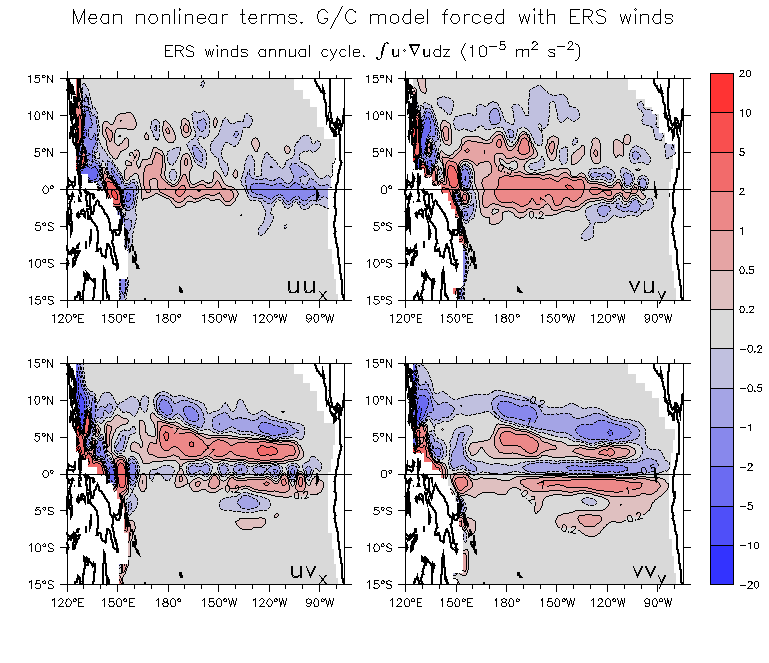
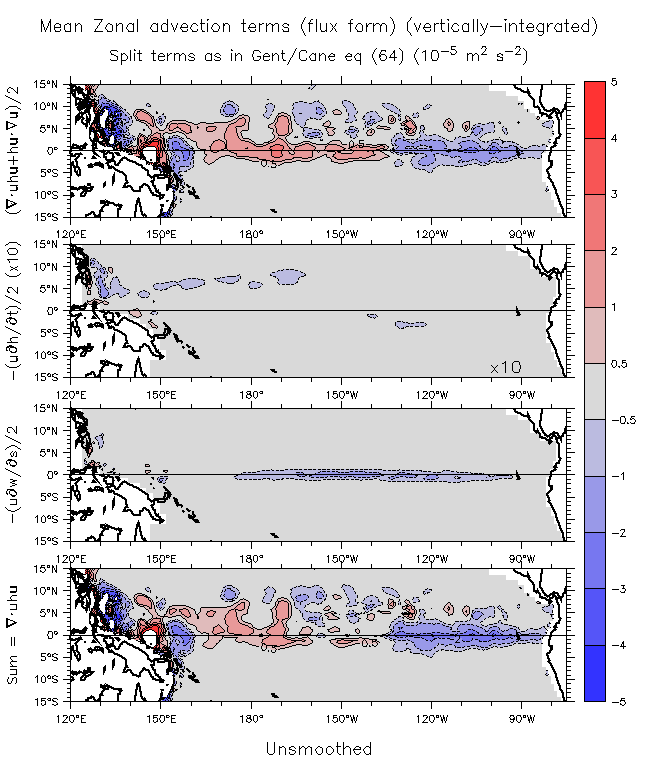
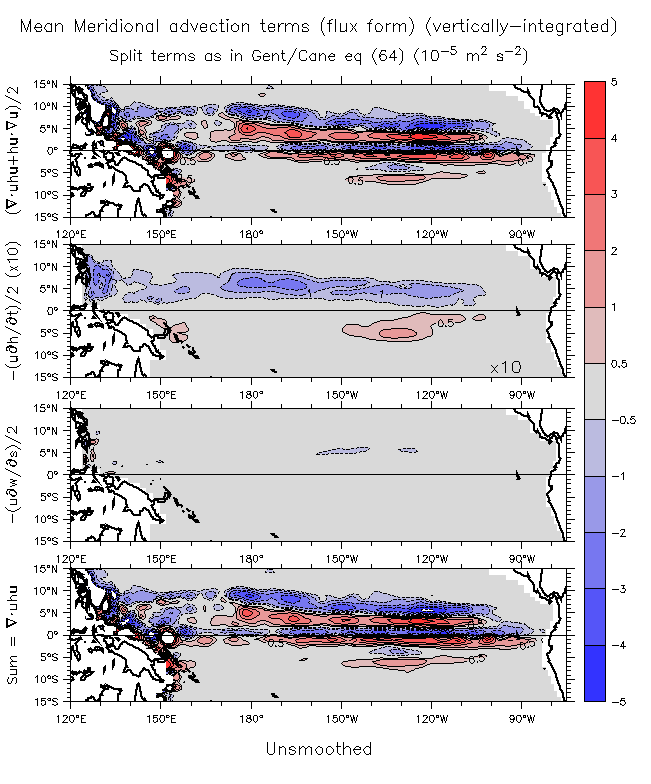
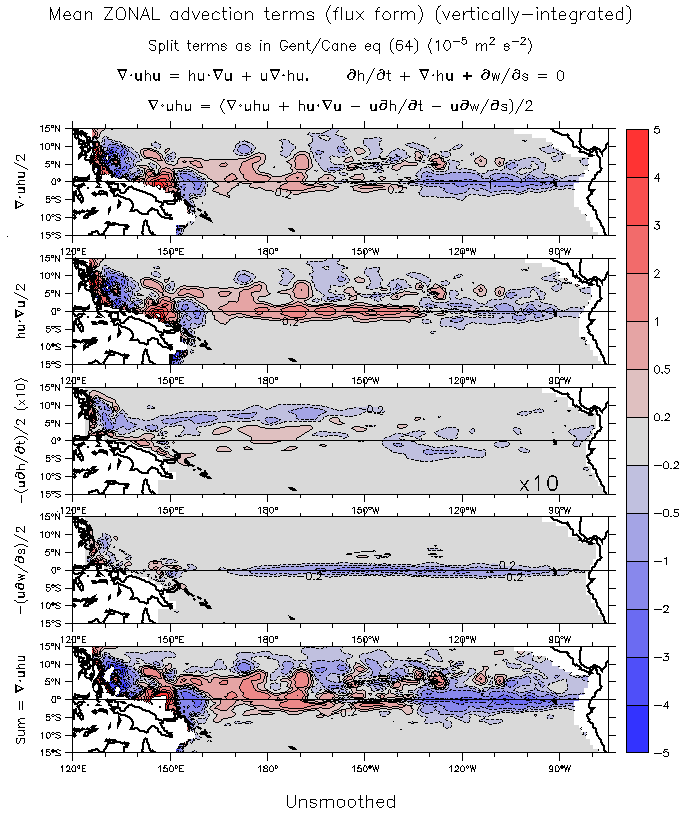
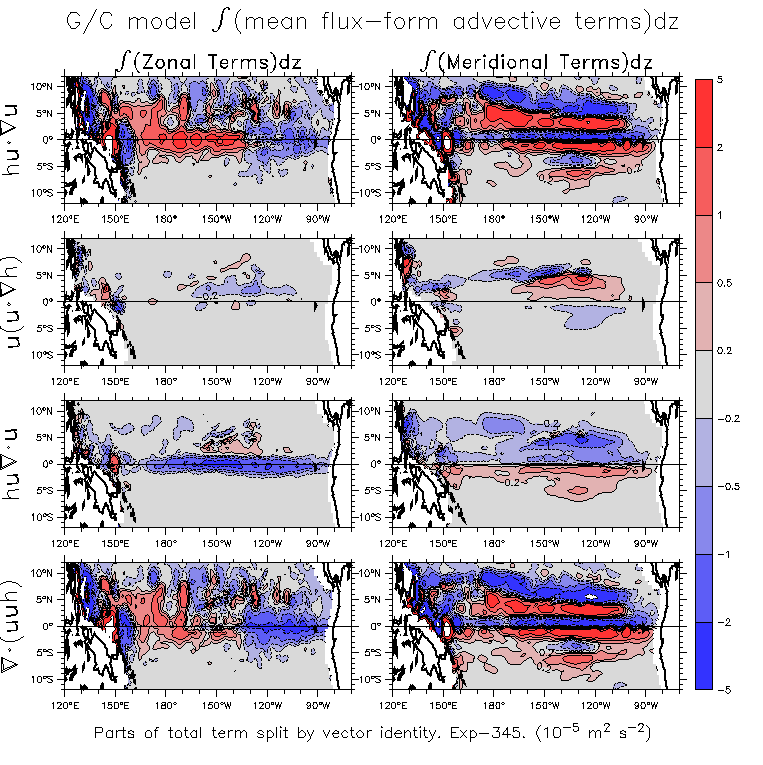
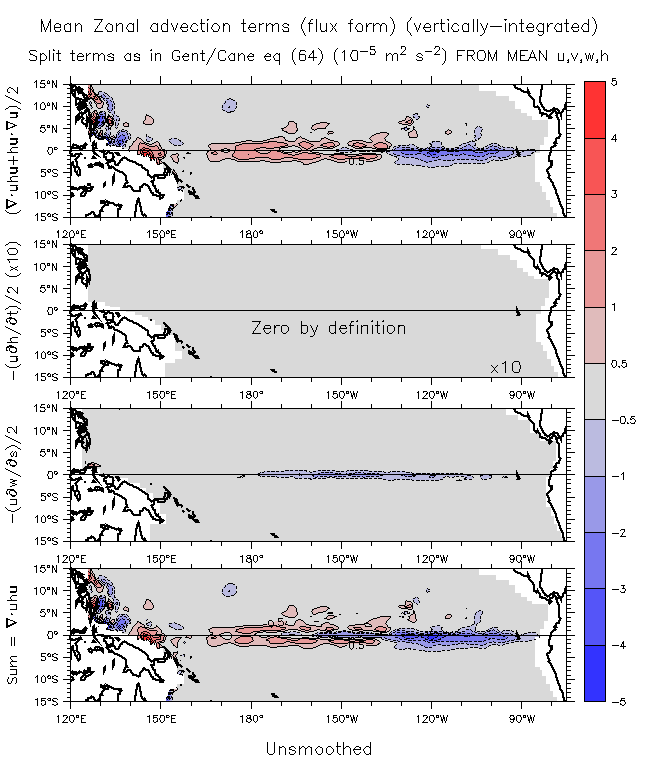
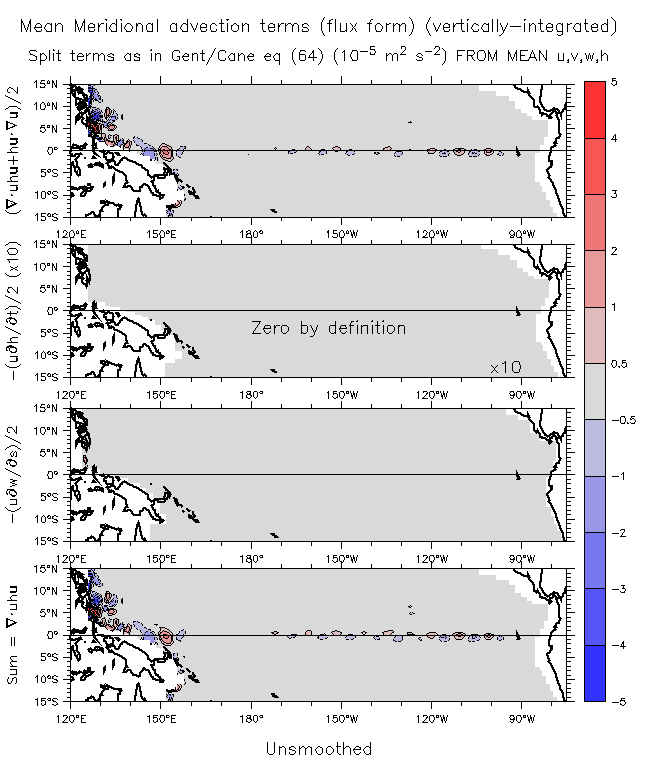
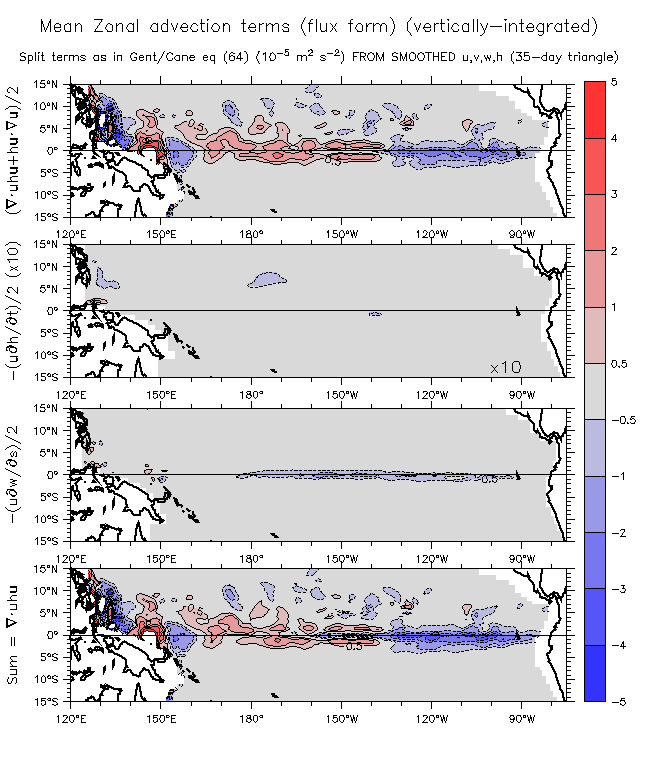
In all of these, look carefully at the definition of what "advective" is. In (almost?) all cases the definition is listed in the plot. In some cases these are simple advection: (e.g. uux+vuy). In other cases it is the G/C flux-form terms (3) and (4) (Del dot(uuh) or Del dot(uuh)+hu dot grad(u)). These are ok as far as they go, but are not complete. In order to make the momentum terms balance it is necessary to calculate all terms of the split advection term as in G/C eqn (64):

The last two terms come from substituting from the continuity equation (22). (See the Flux form vorticity equation)
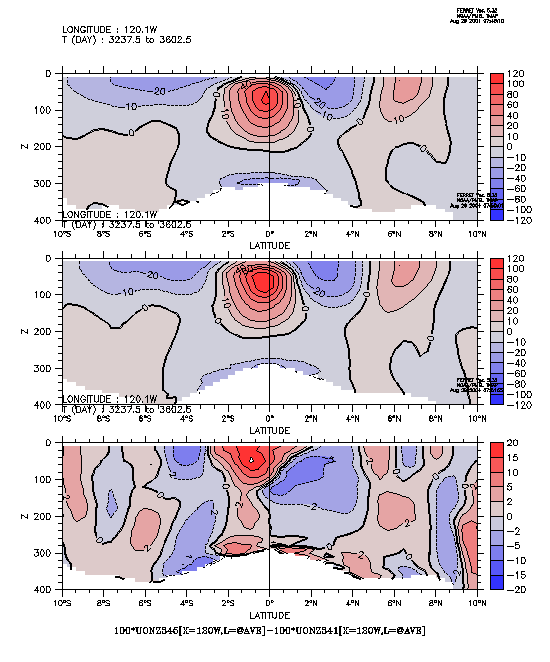
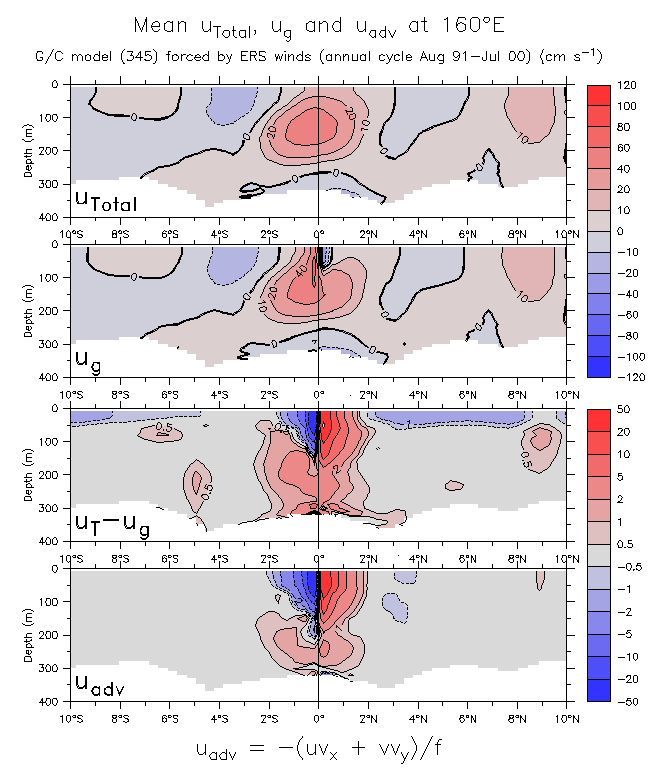
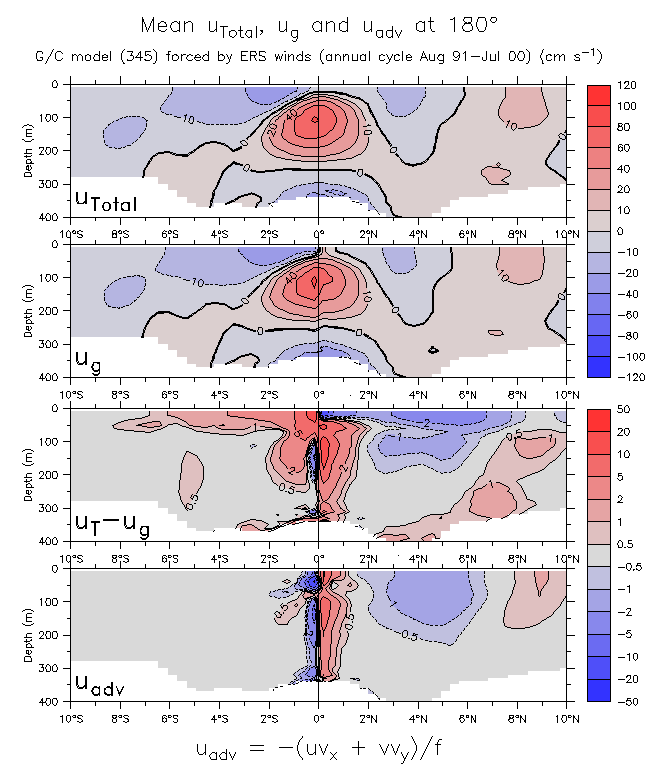
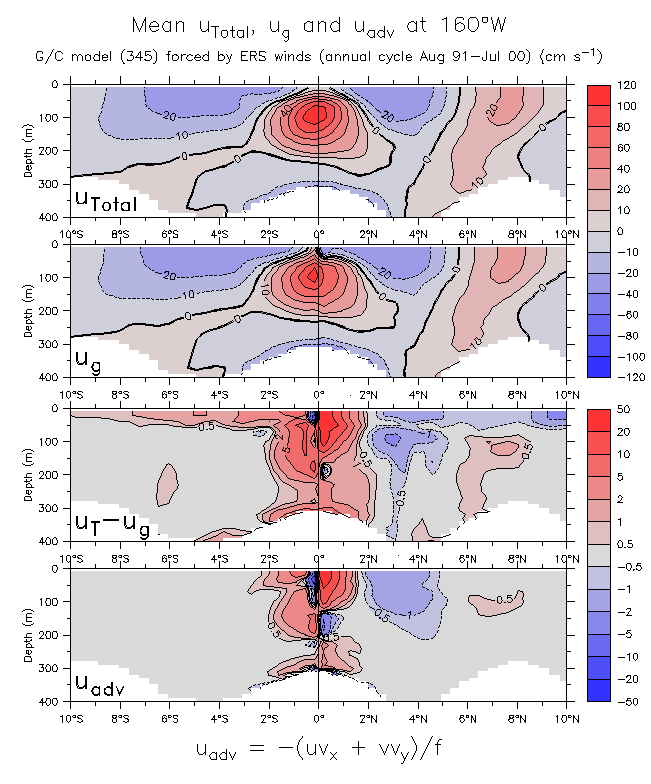
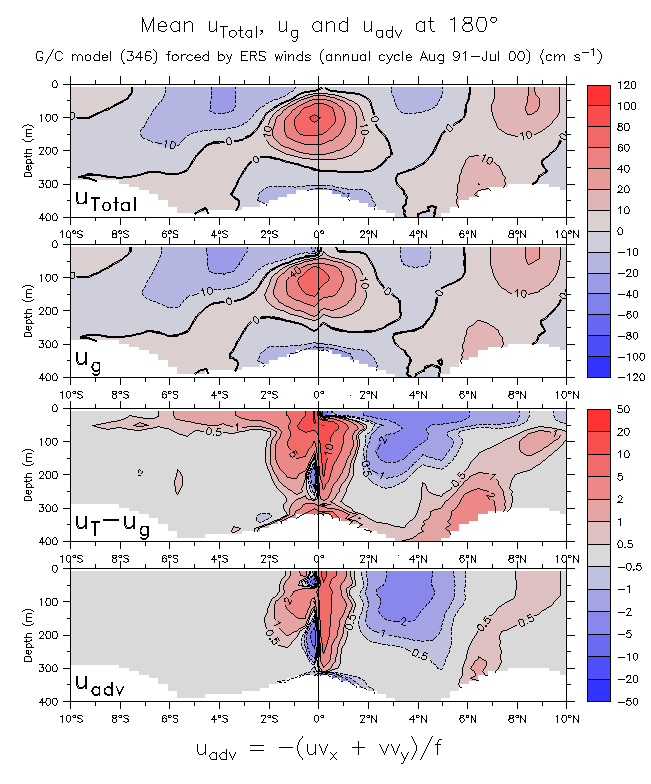
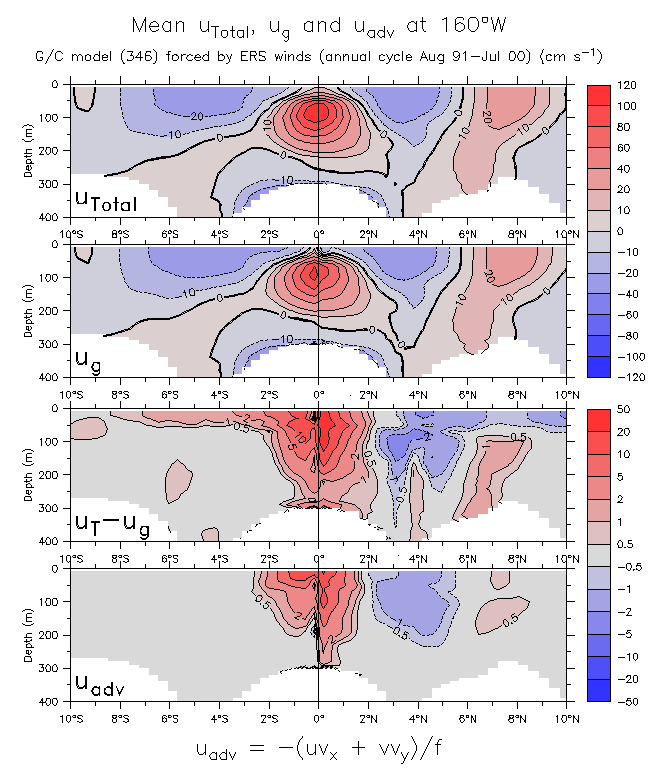
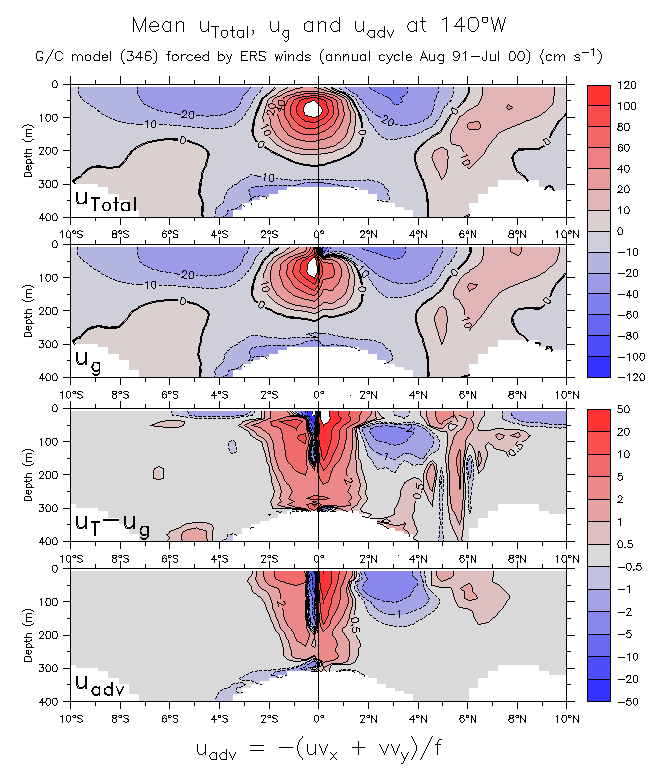
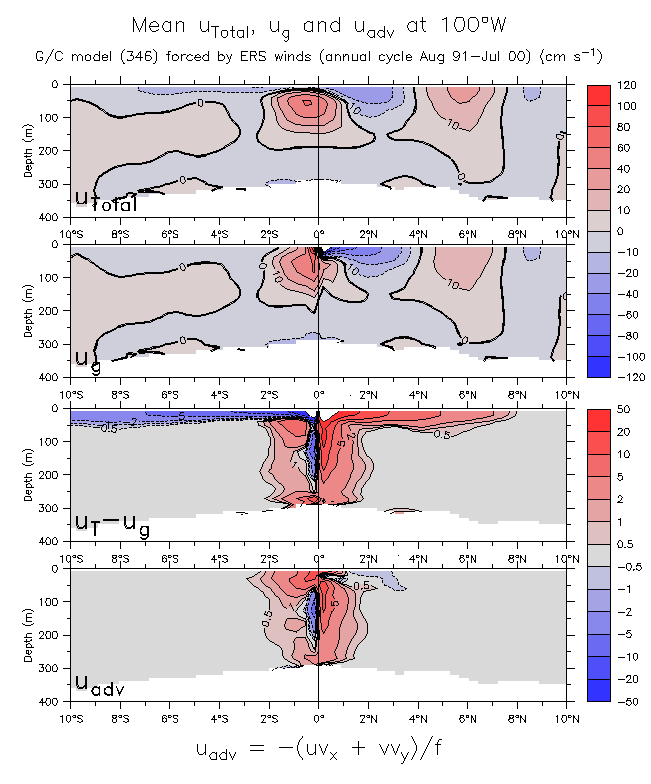
- (y,z) sections (uTotal, ug, uDifference, uAdvective): 160°E 180° 160°W 140°W 120°W 100°W
(Same figs from exp-346: 160°E 180° 160°W 140°W 120°W 100°W )
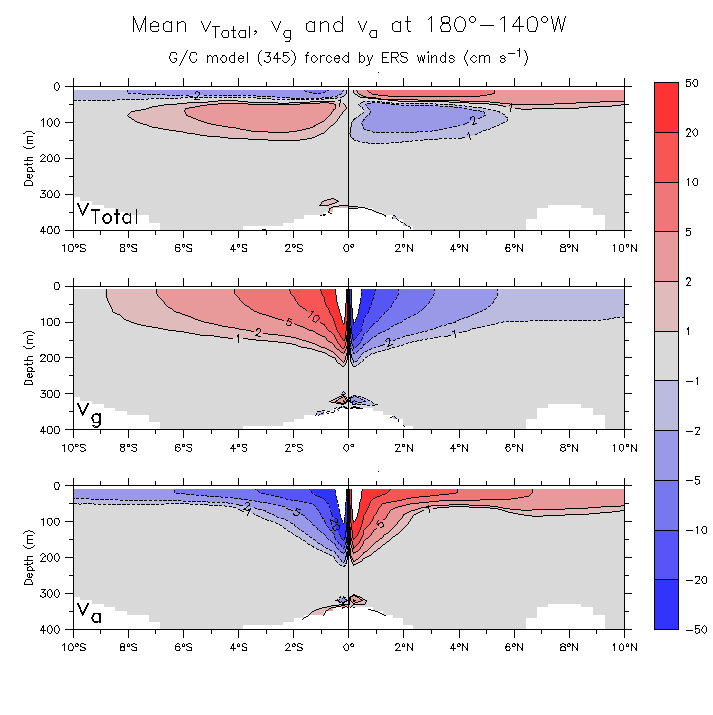
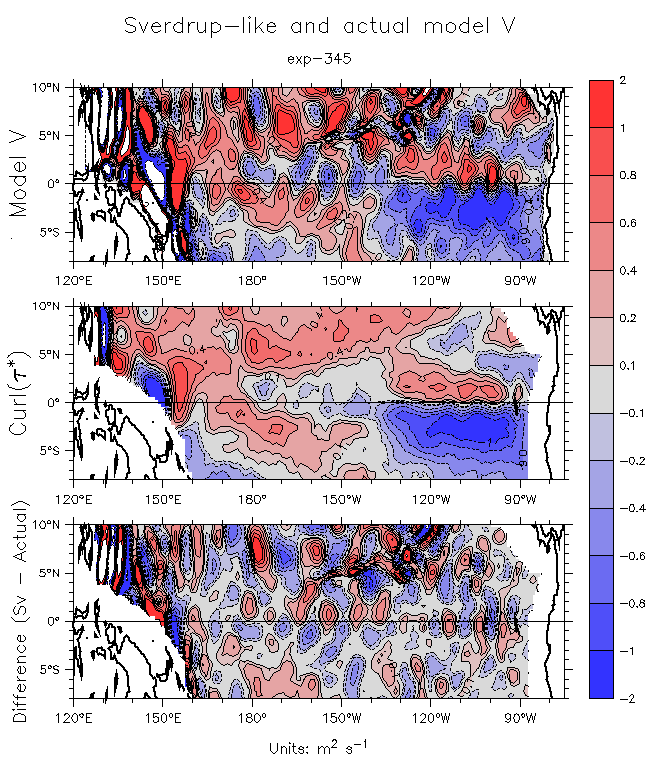
v and v_g
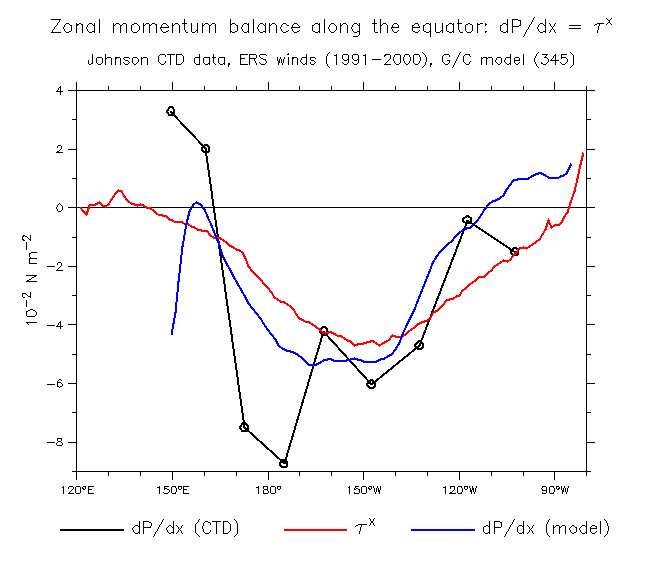
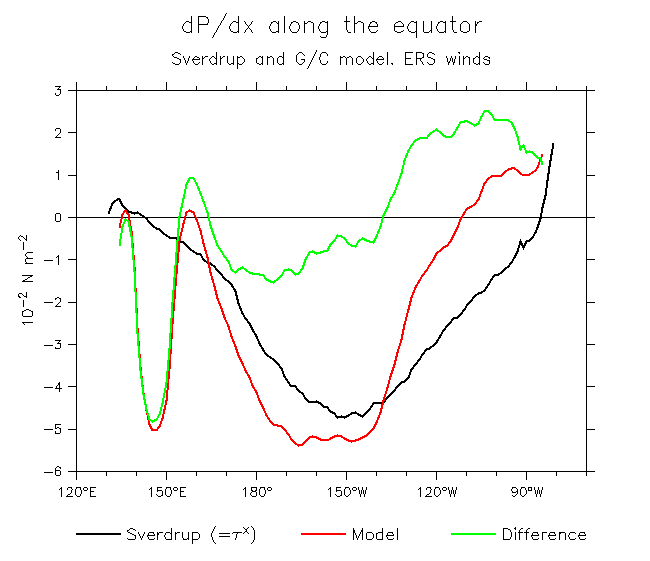
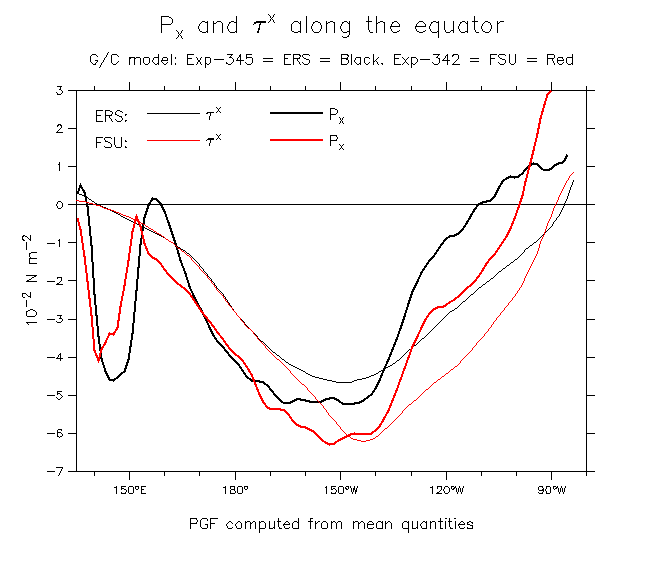
- dP/dx along the equator .
Compare Johnson CTDs and G/C model: Px and Taux
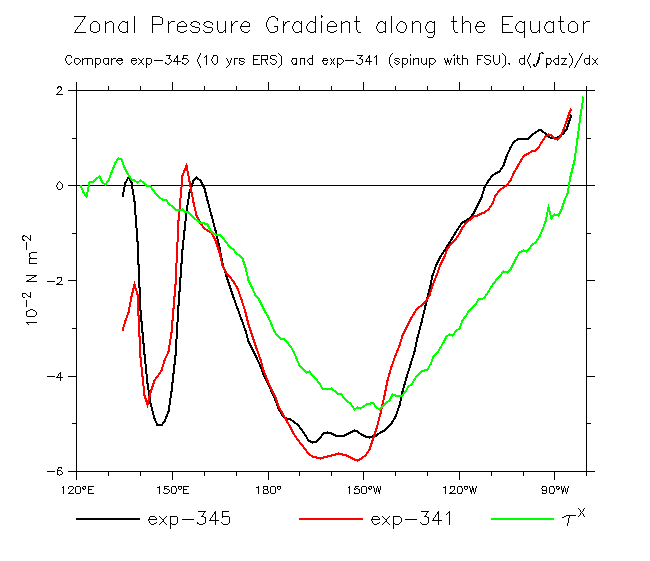
Model Px (Check different runs): 345 and 341 346 and 345
Model zonal mom terms: Model/Sverdrup Px
Complete momentum balance along the equator: Split advection terms and Shapiro friction
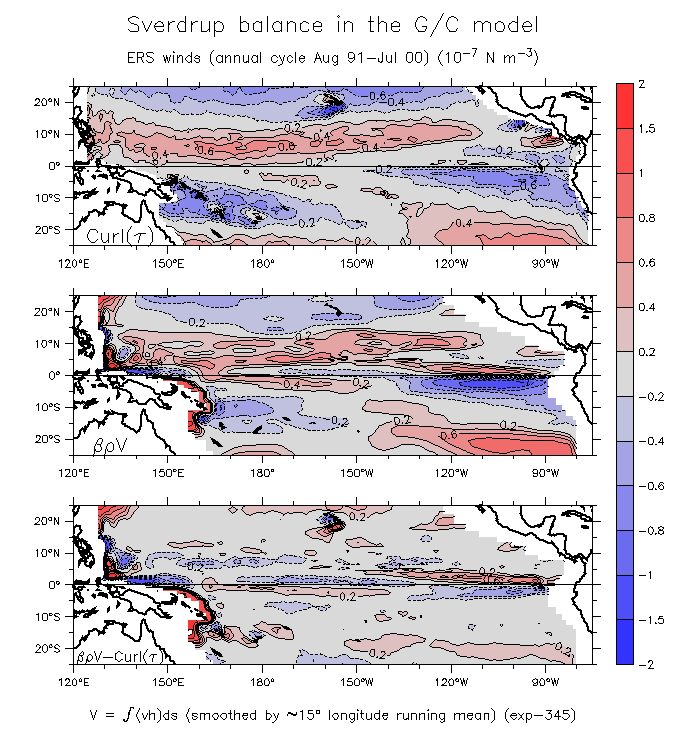
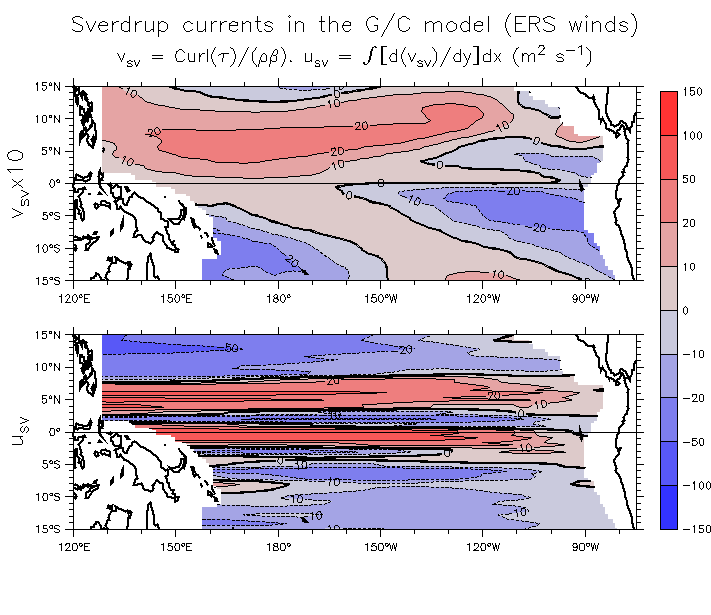
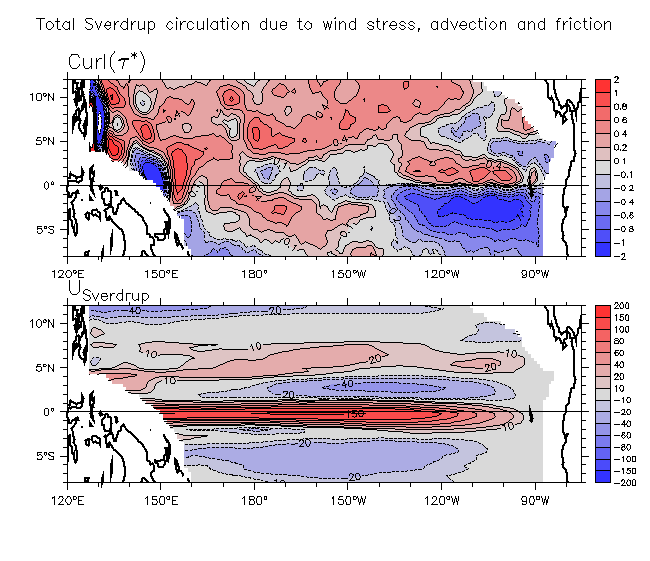
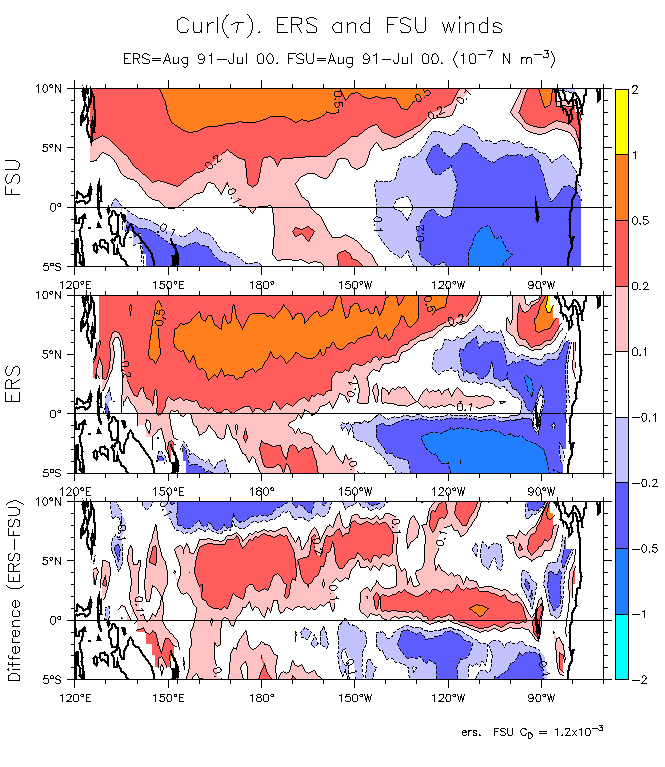
- Sverdrup balance comparison (Maps of BV=Curl(Tau): 25°S-25°N 15°S-15°N
Same figs from exp-346: 25°S-25°N 15°S-15°N
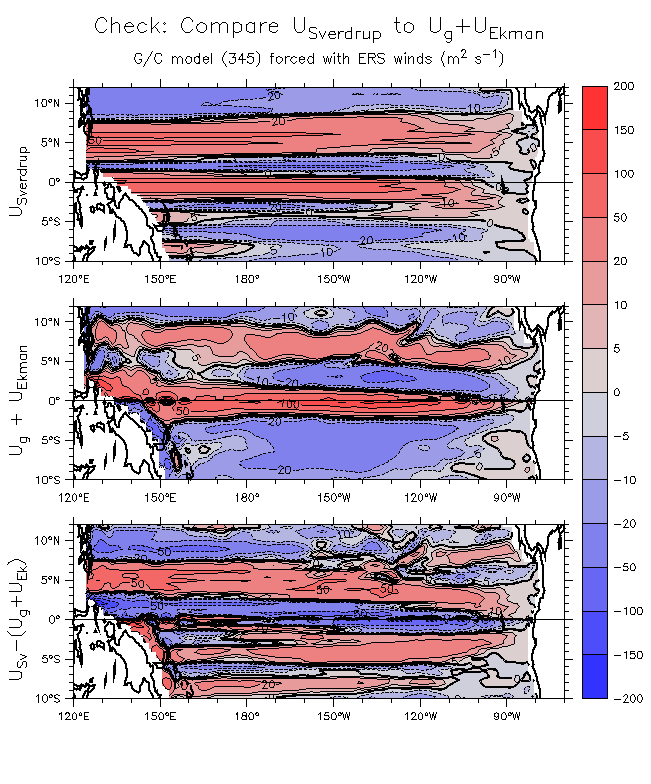
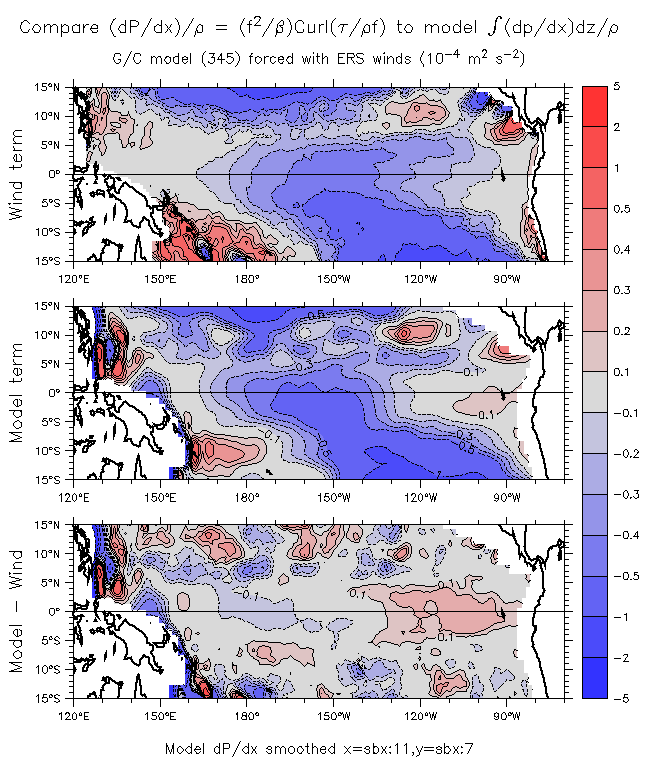
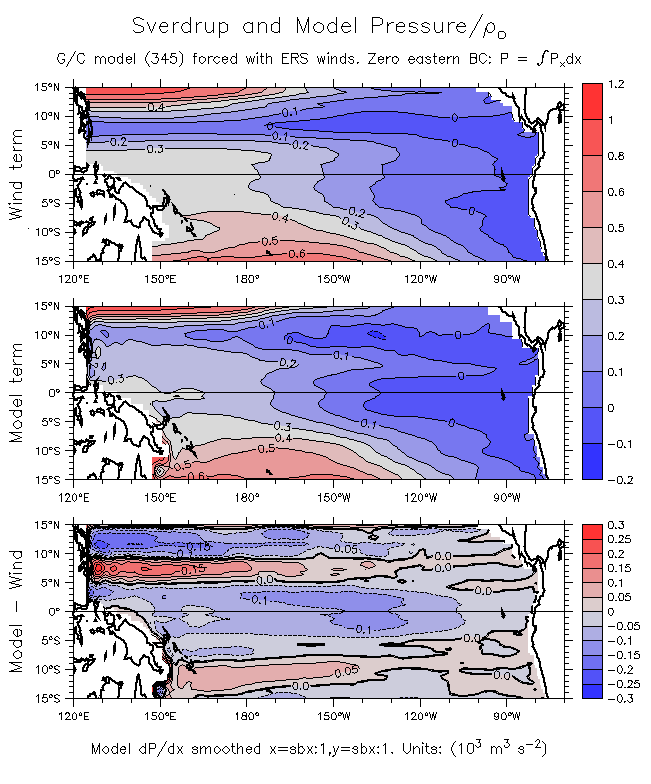
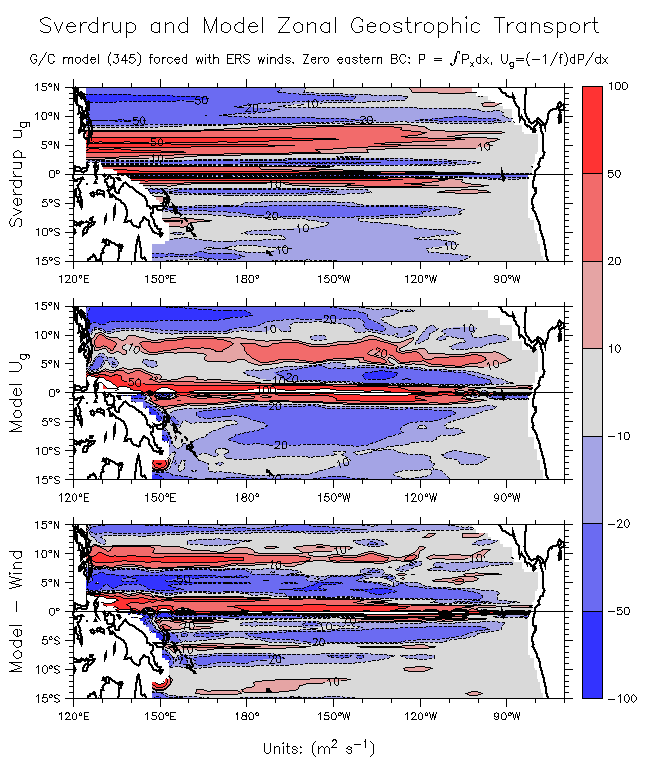
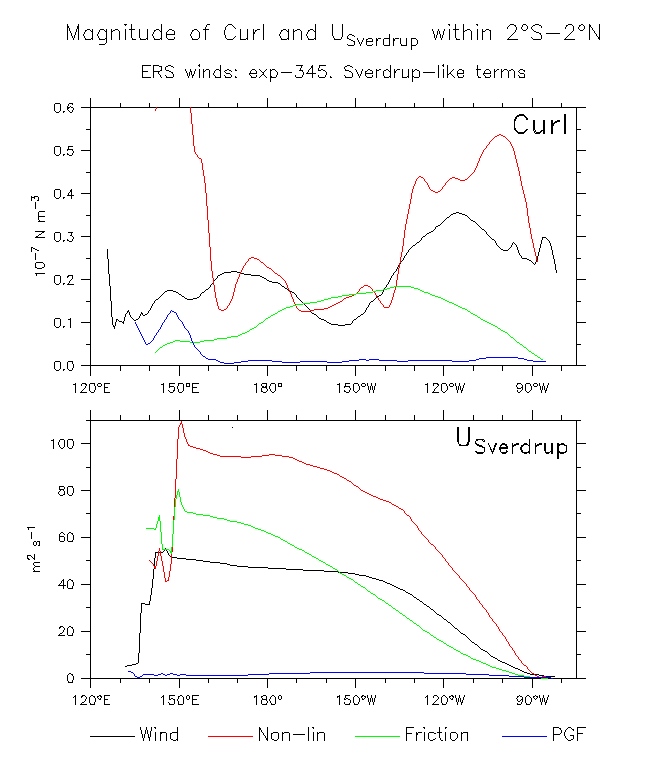
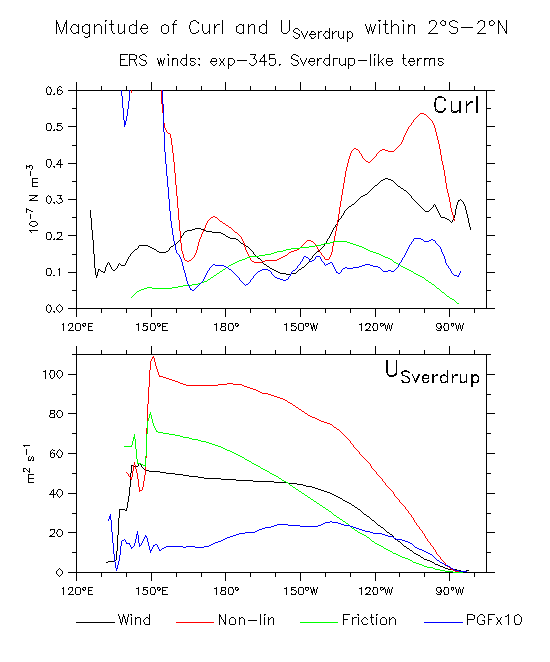
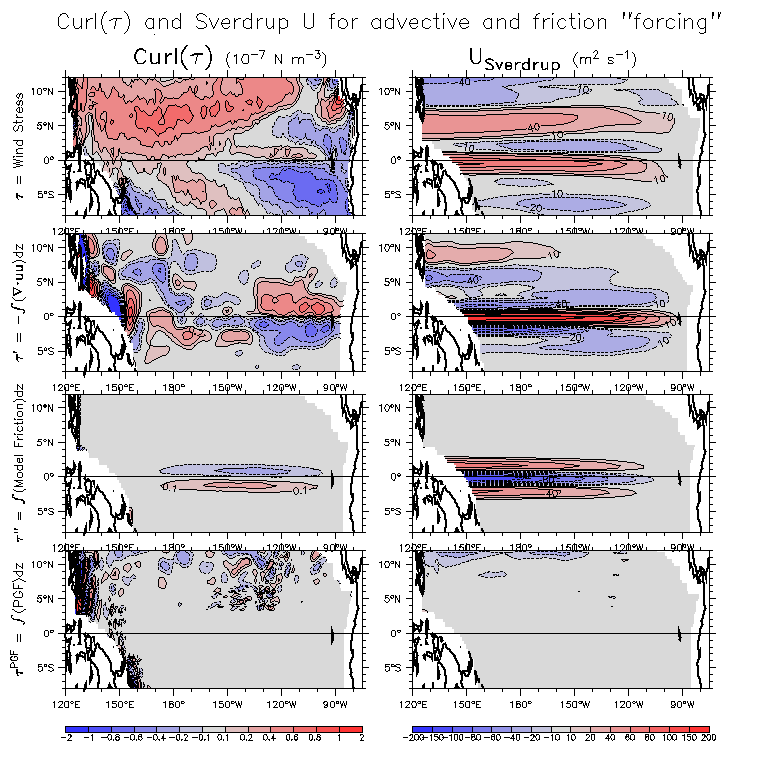
- Compare wind and model Sverdrupian terms: Maps of
Usv, Ug+Uek, Remainder
dP/dx
P
Ug
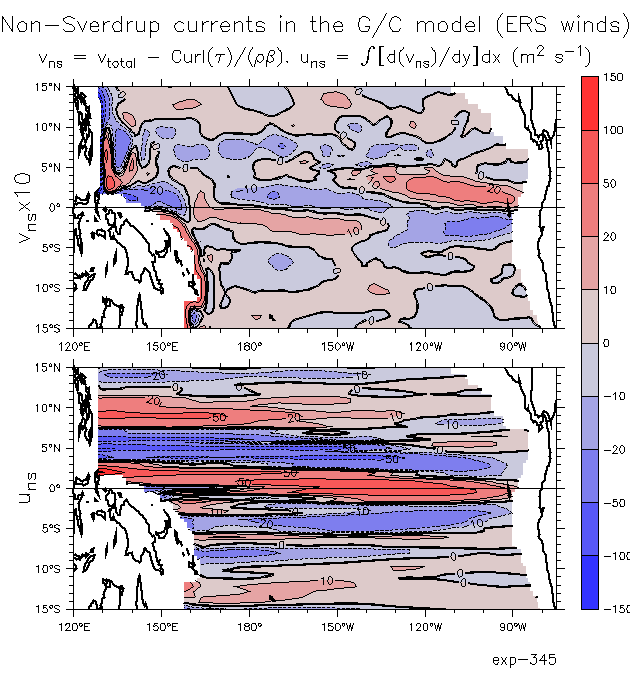
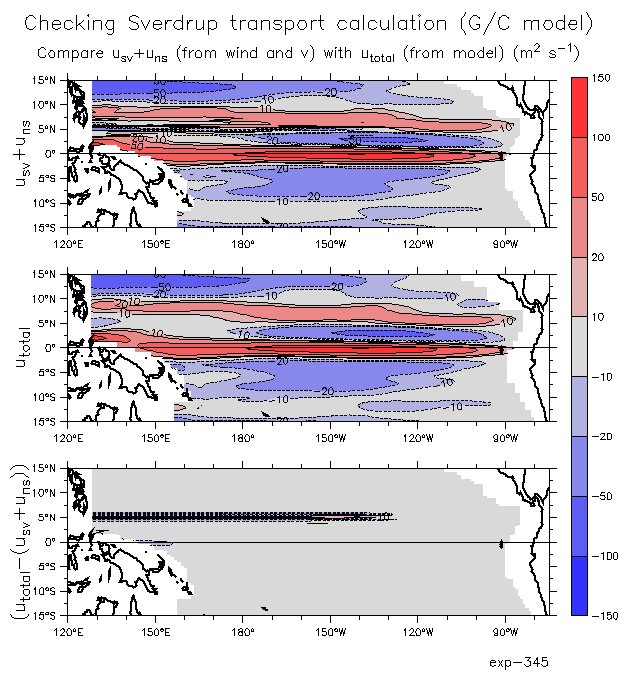
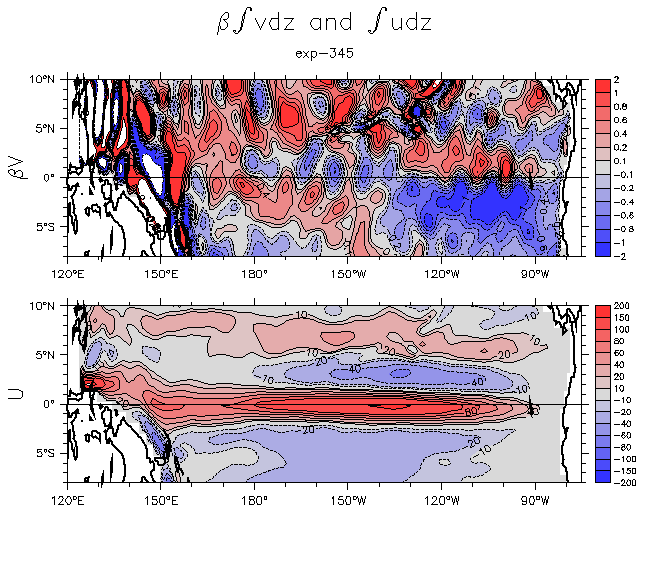
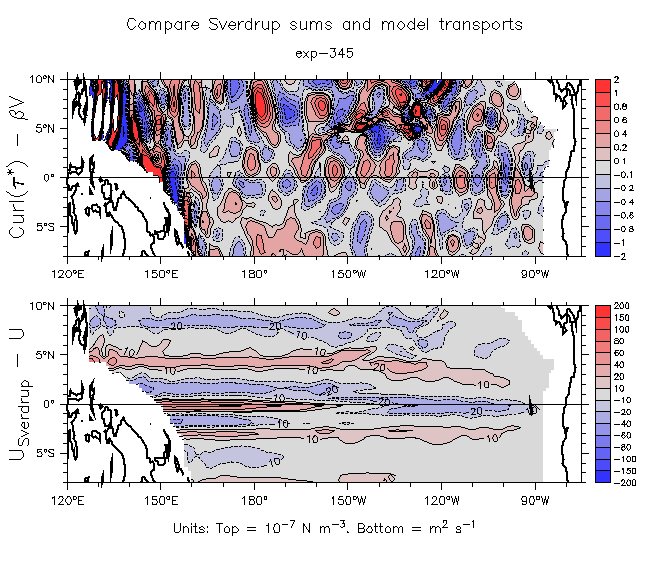
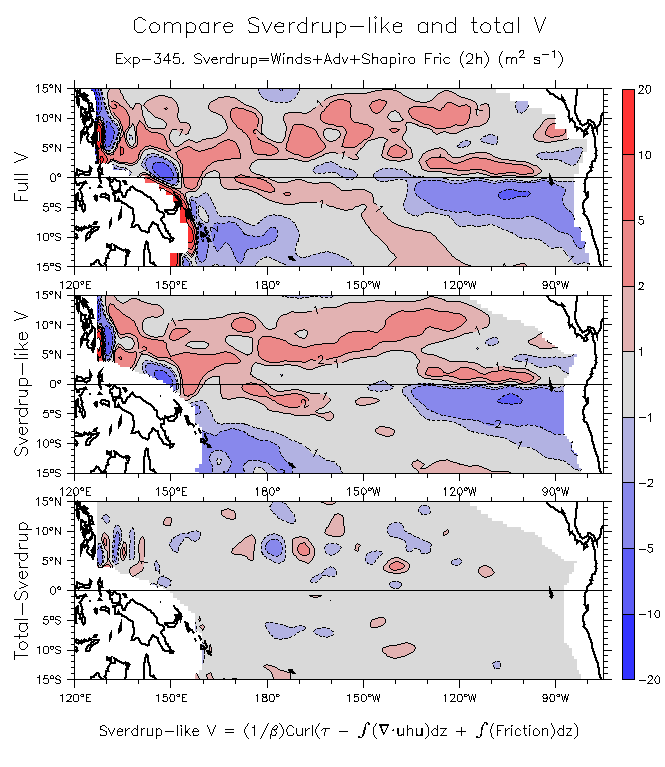
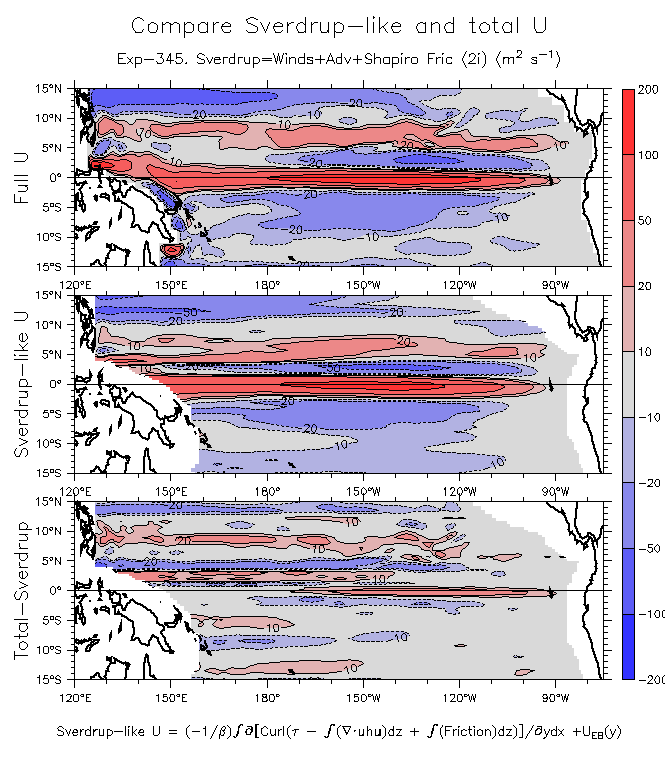
- Maps of Sverdrup and non-Sverdrup transport (U and V): Sverdrup Non-Sverdrup Check the sum against total (u)
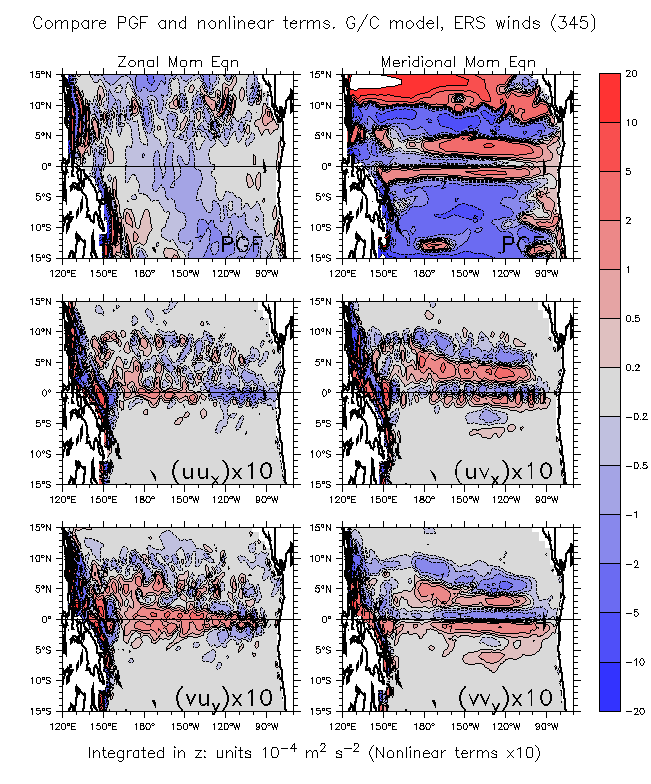
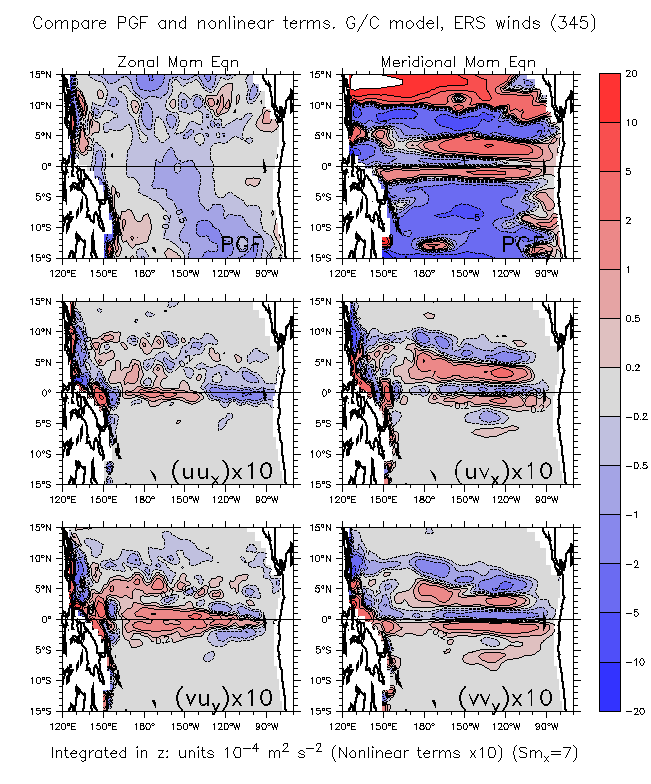
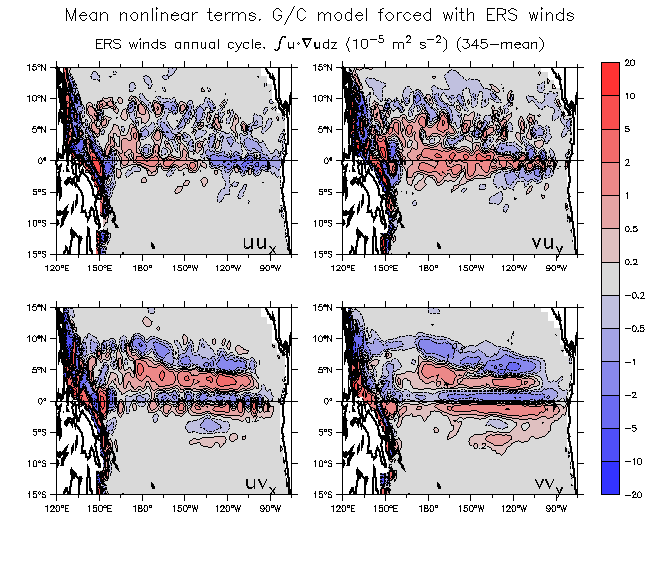
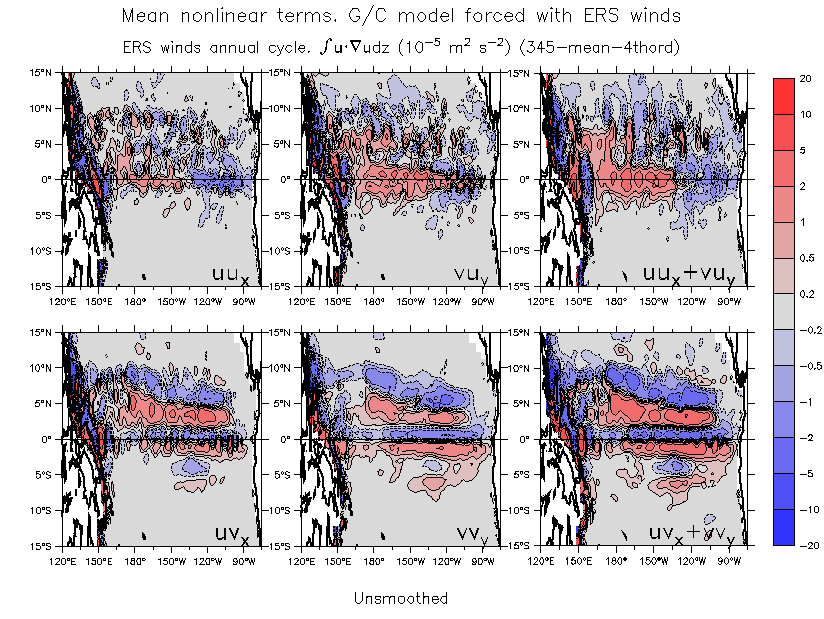
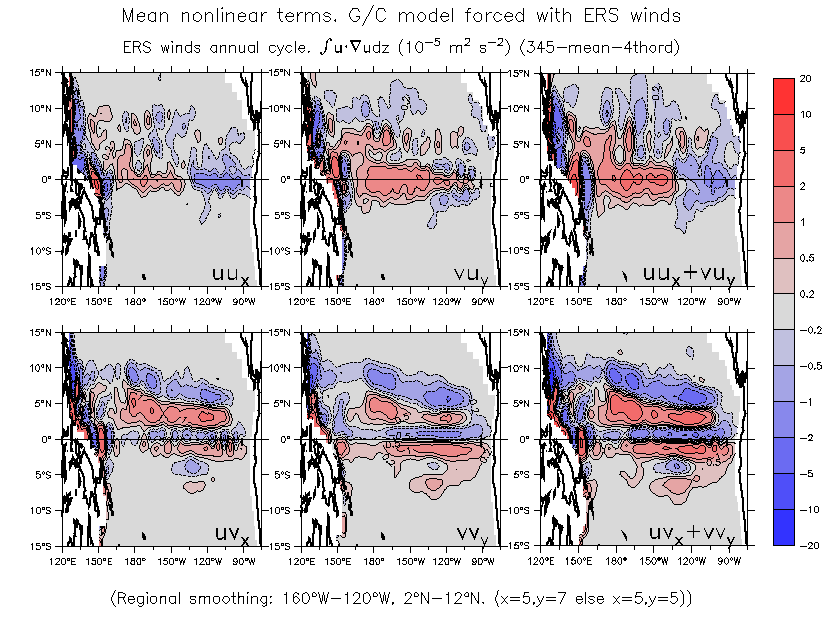
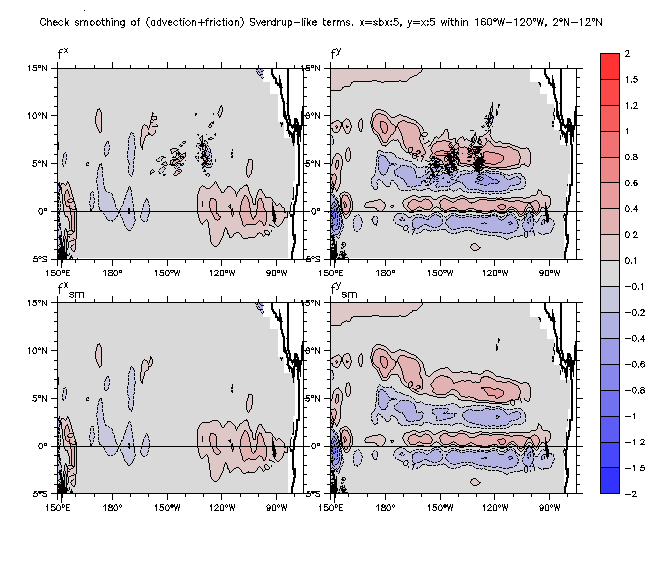
- Maps of PG and nonlinear terms: Unsmoothed Smoothed in x
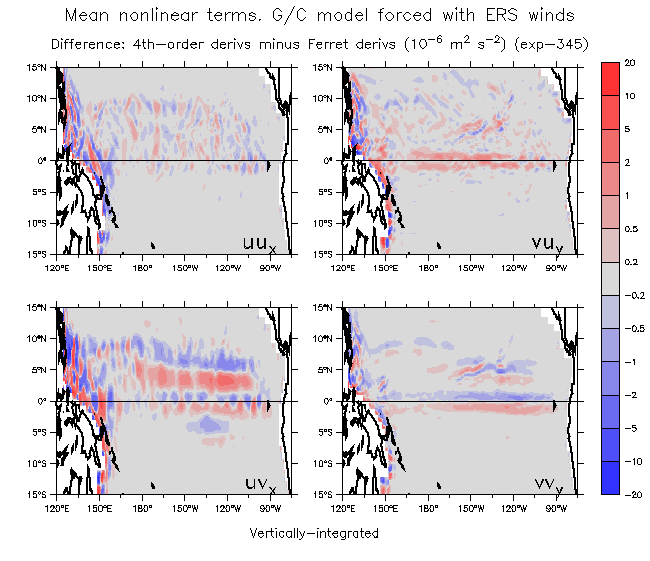
New versions of advective terms: Ferret derivs 4th-order derivs Smoothed Compare derivs To curls To Usv
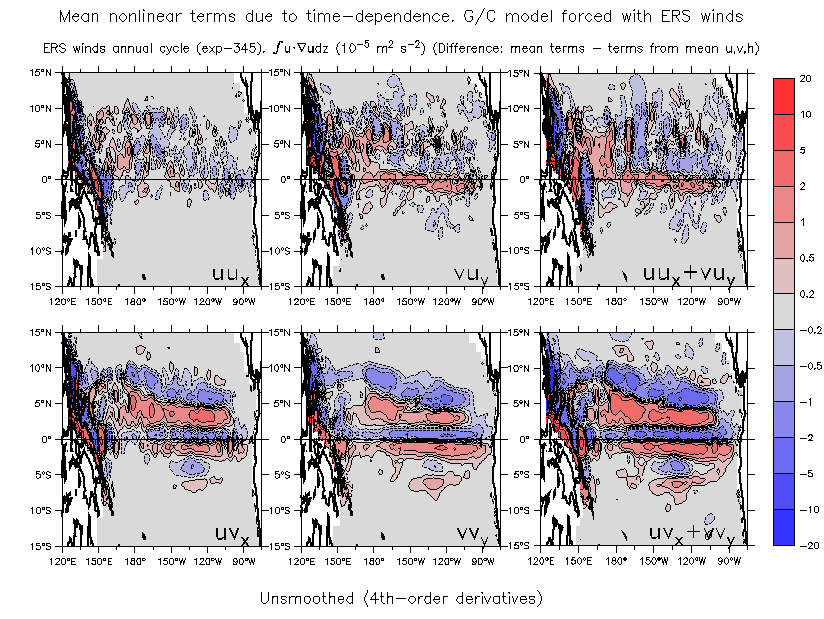
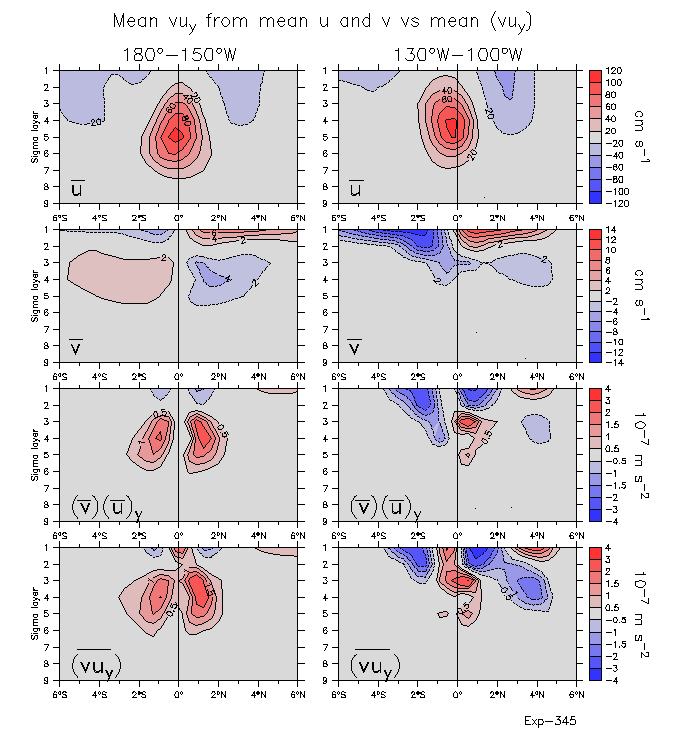
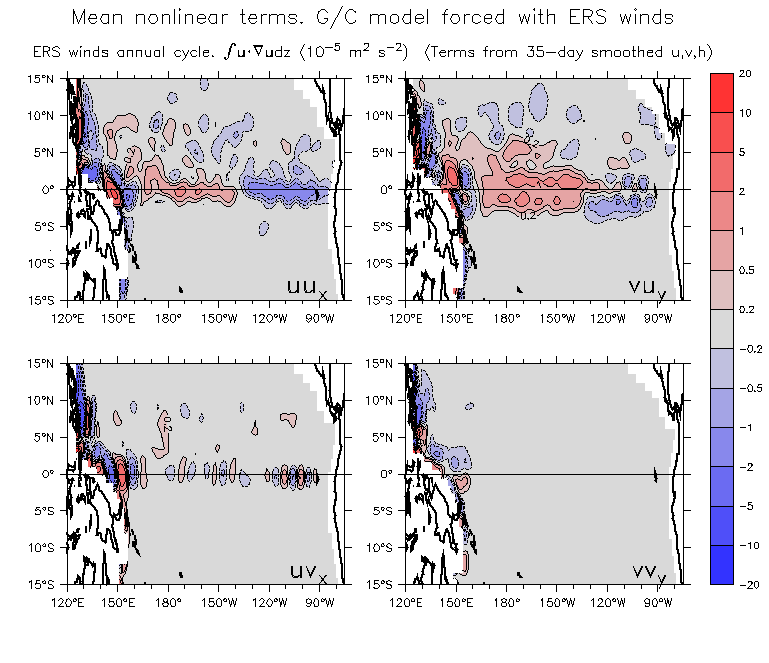
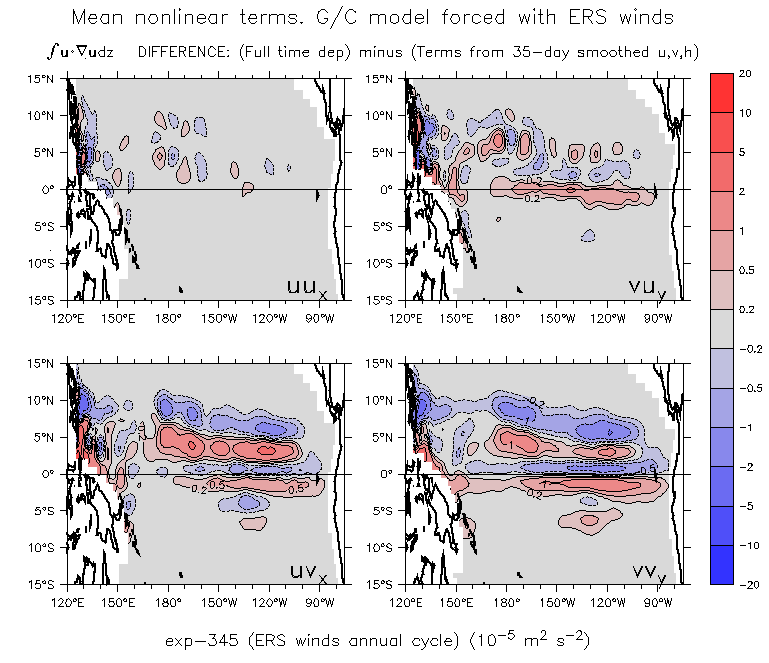
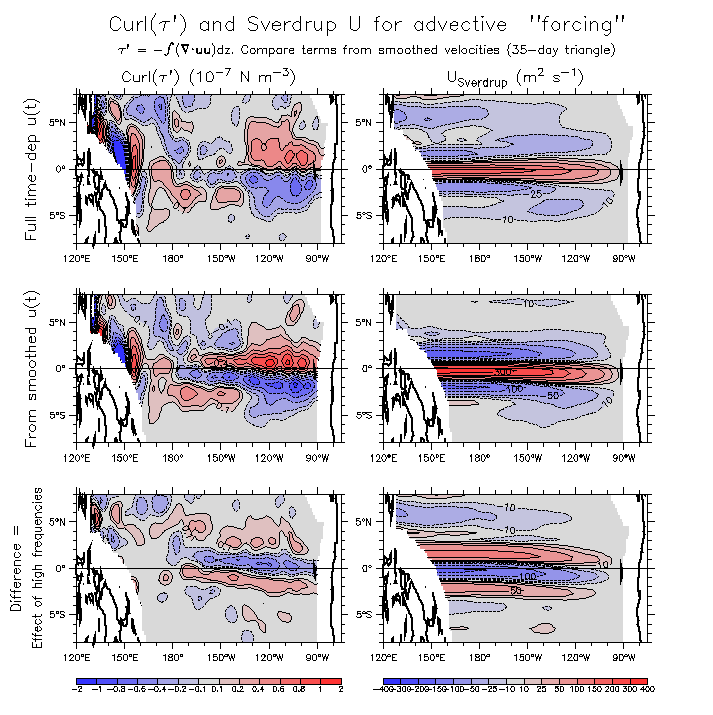
Compare terms from full time-dependence, mean (u,v,h) and time-smoothed (u,v,h):
From means From smoothed u,v,h Difference full-mean vuy vertical sections
Versions as in talk/paper: Full time-dep From smoothed velocities Difference Full minus Smoothed
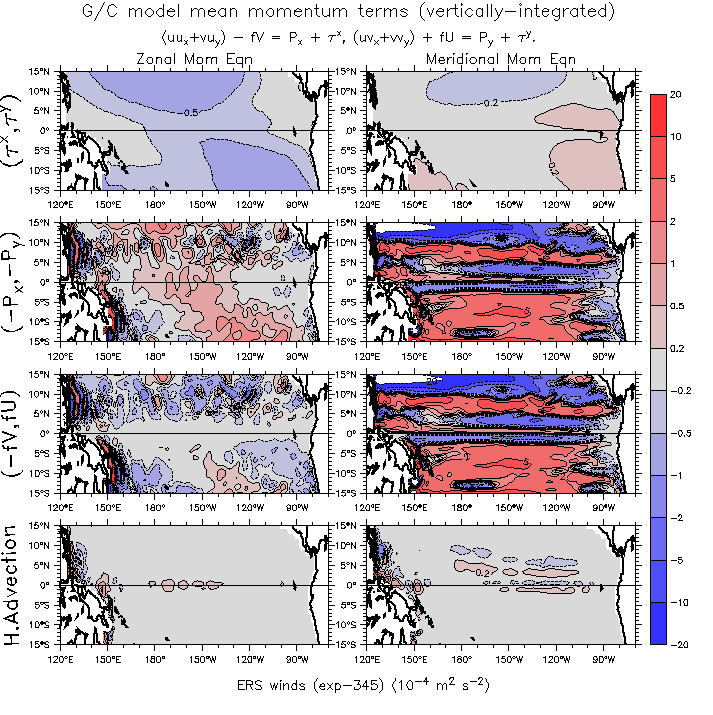
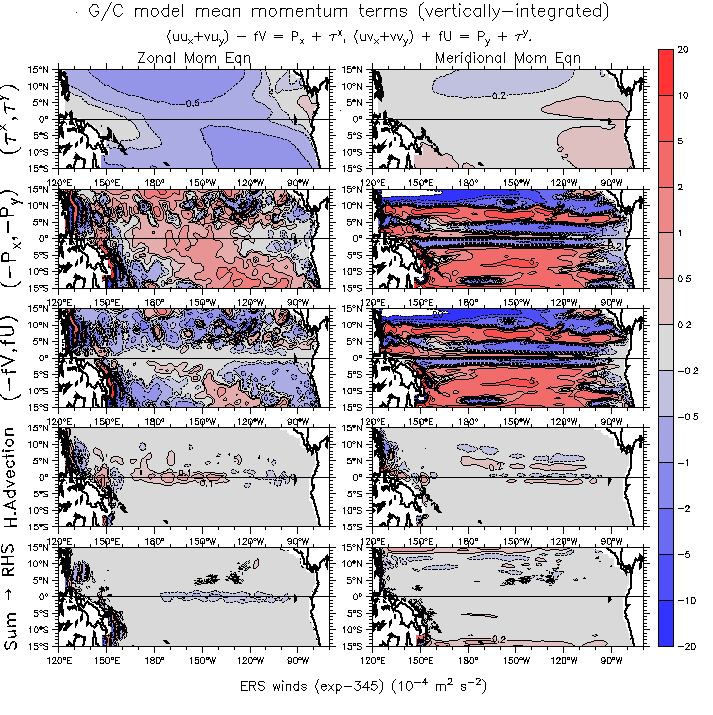
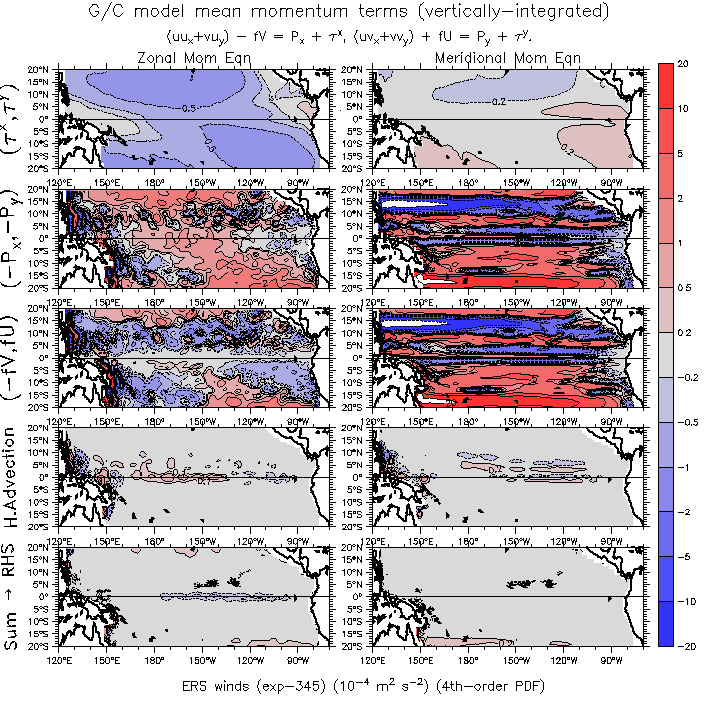
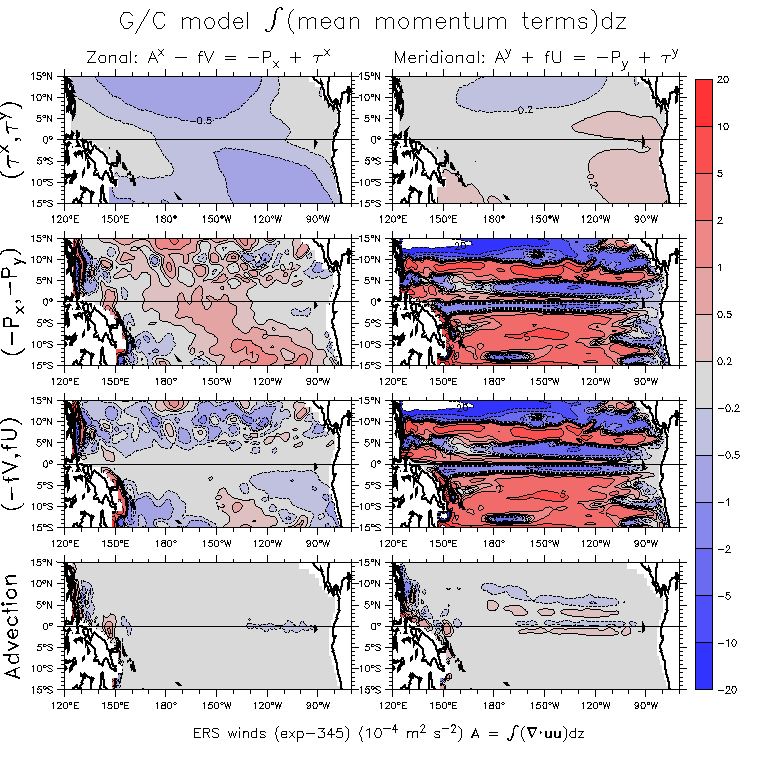
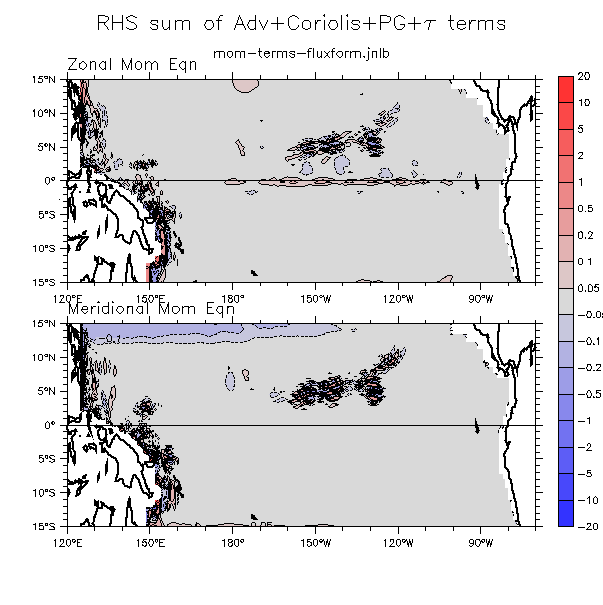
- Maps of all terms (Advective, Coriolis, PGF, Tau): Maps Include sum Extend to 20°
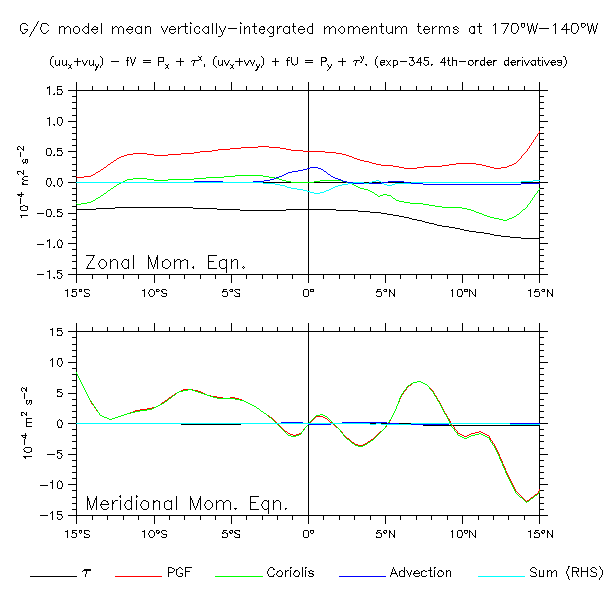
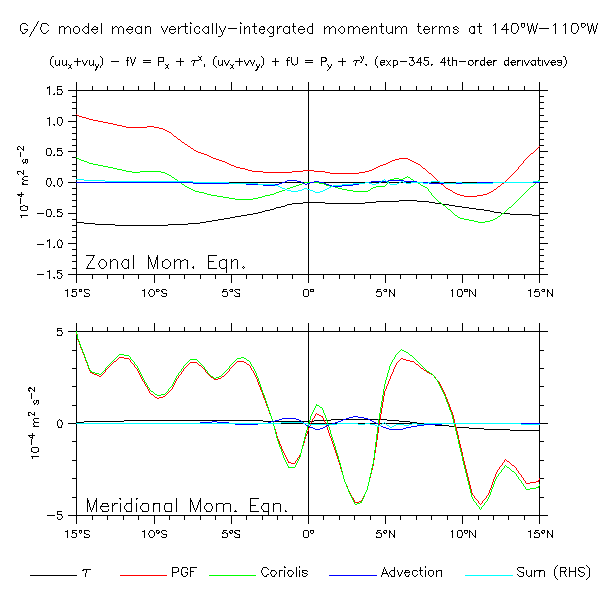
Meridional sections of mom terms: 170°W-140°W (Show sum x10) 140°W-110°W (Show sum x10)
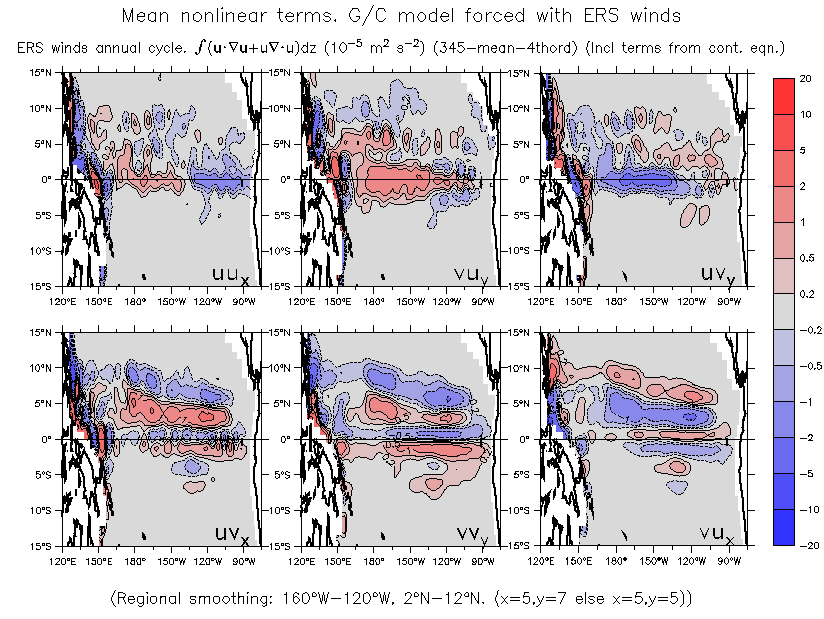
Maps with fluxform adv terms Sums
- Some exploration of nonlinear terms time/depth dependence:
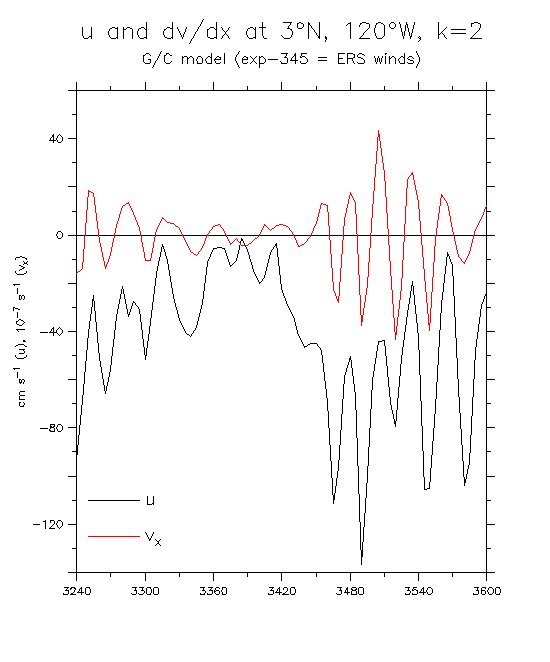
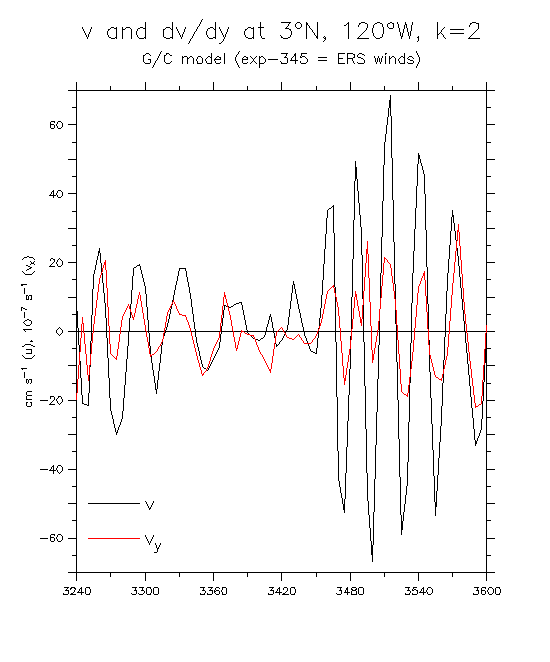
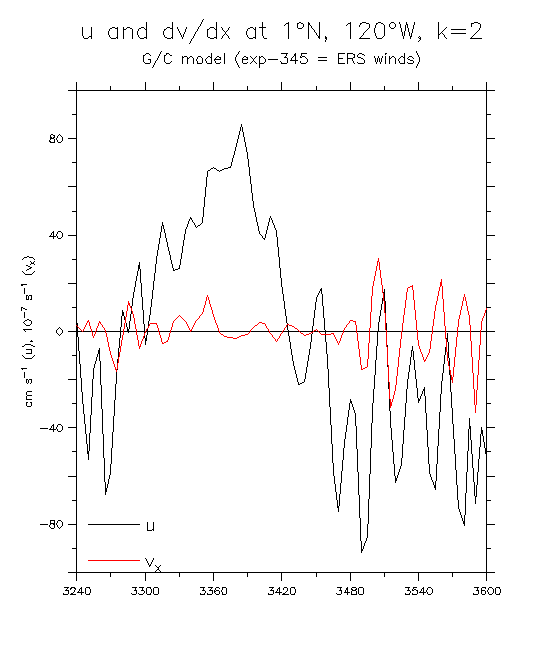
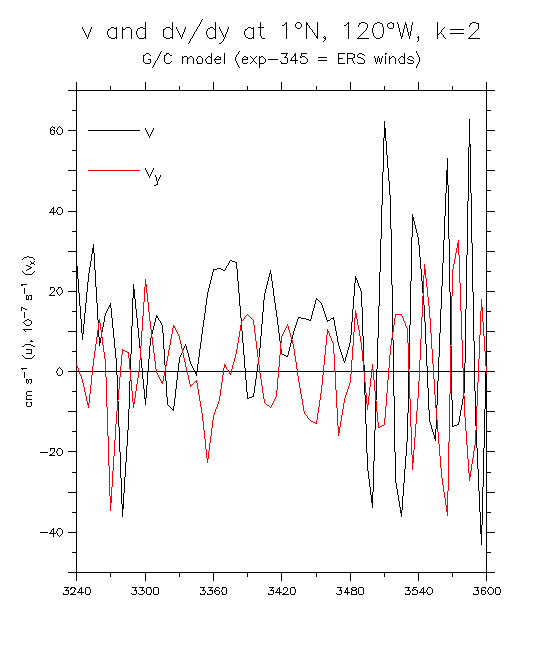
Examples of term components (k=2): uvx (3°N,120°W) vvy (3°N,120°W) uvx (1°N,120°W) vvy (1°N,120°W)
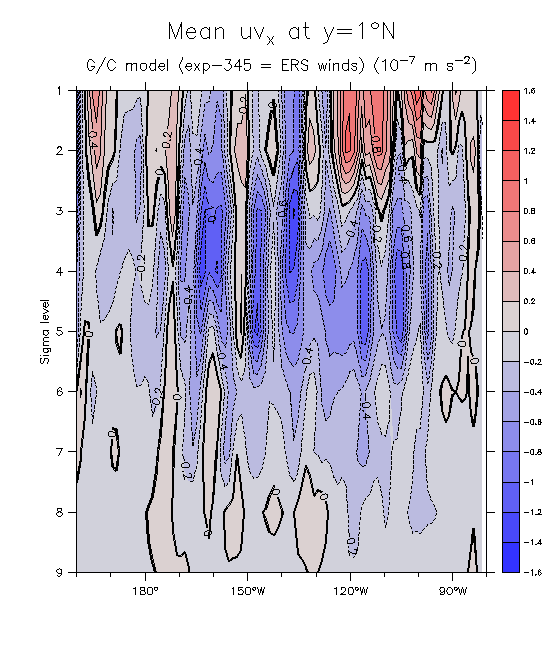
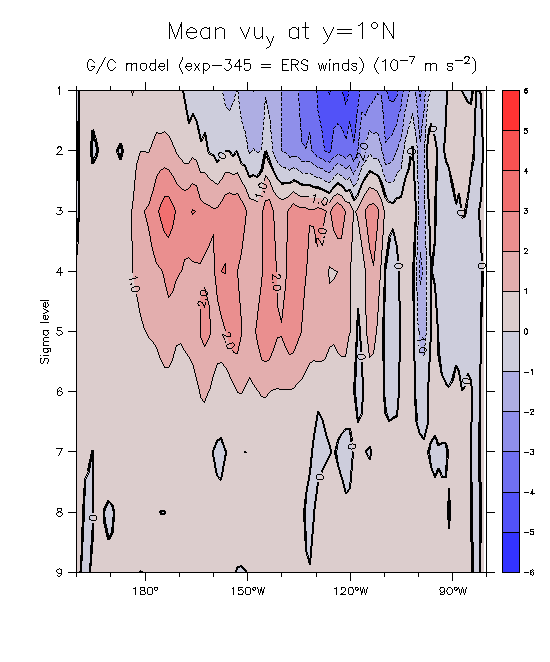
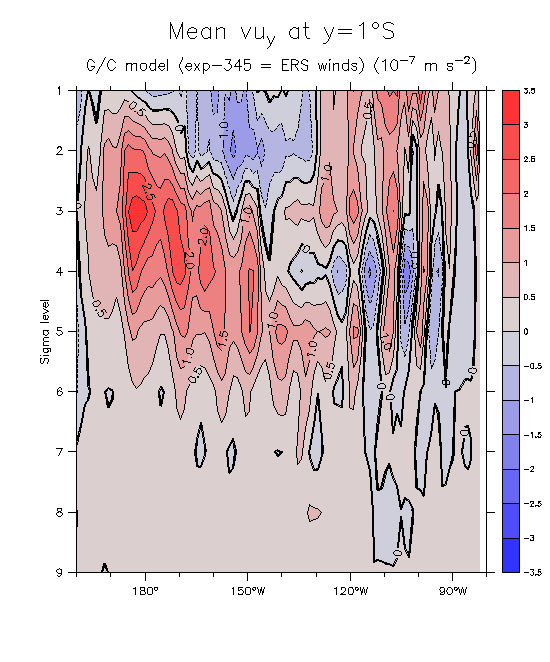
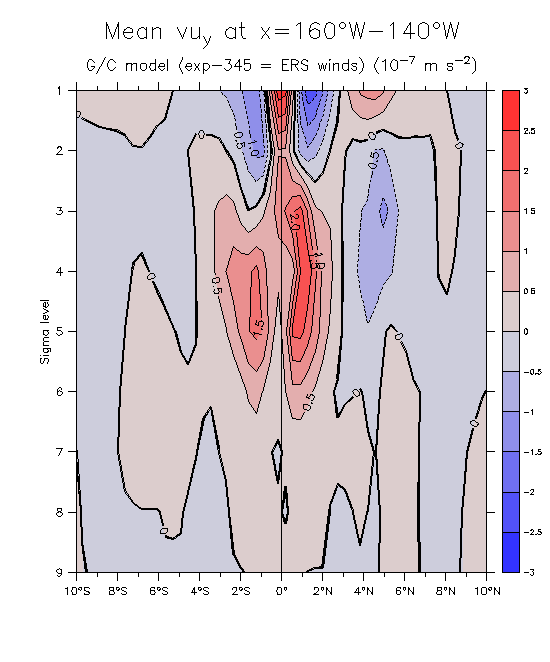
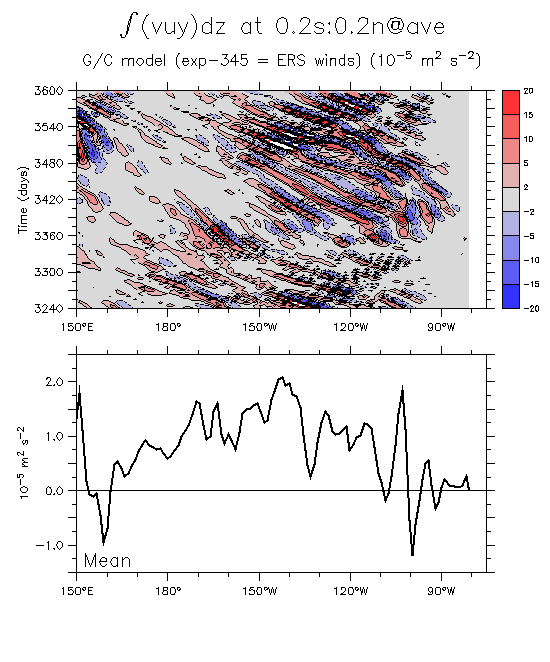
Some mean vertical slices: uvx (1°N, mean) vuy (1°N, mean) vuy (1°S, mean) vuy (150°W, mean)
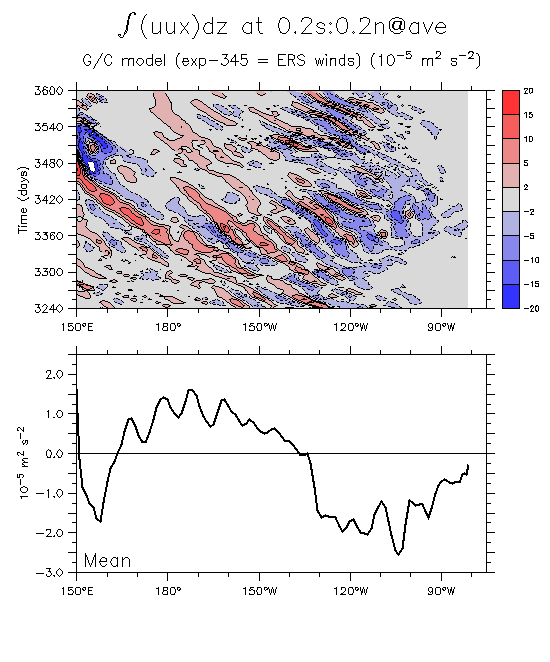
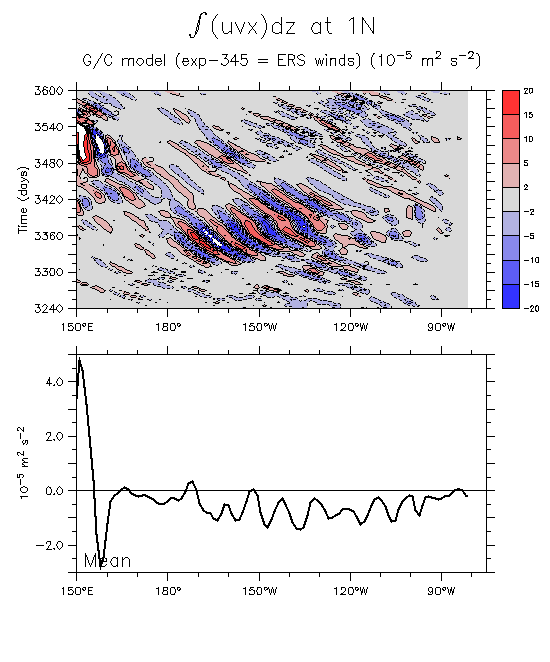
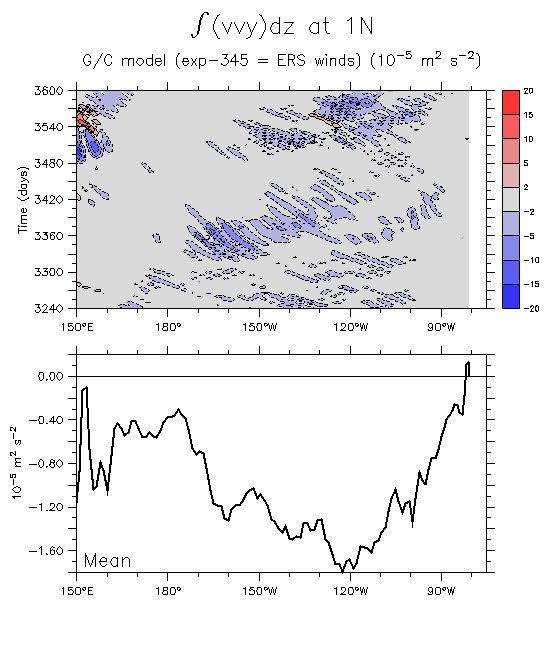
(x,t) sections of V-Int terms: uux, Eq vuy, Eq uvx, 1°N vvy, 1°N
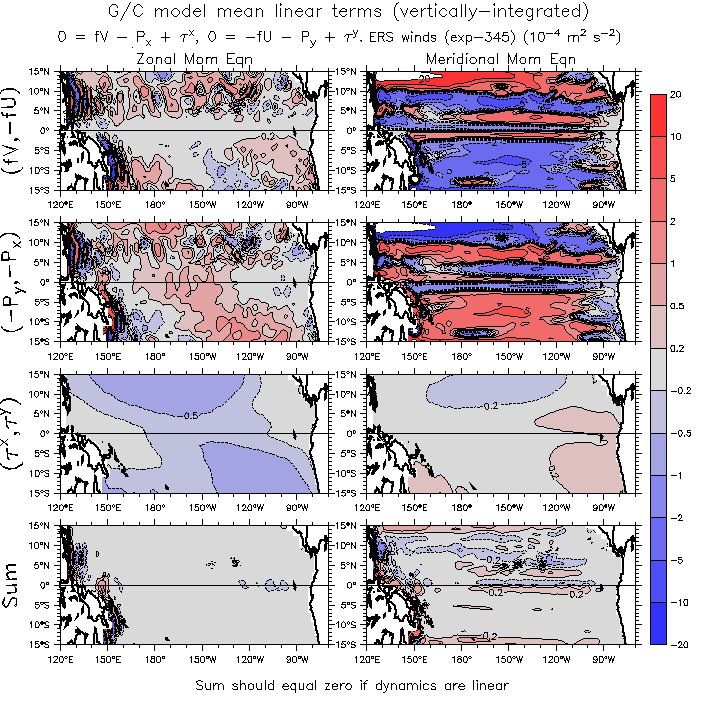
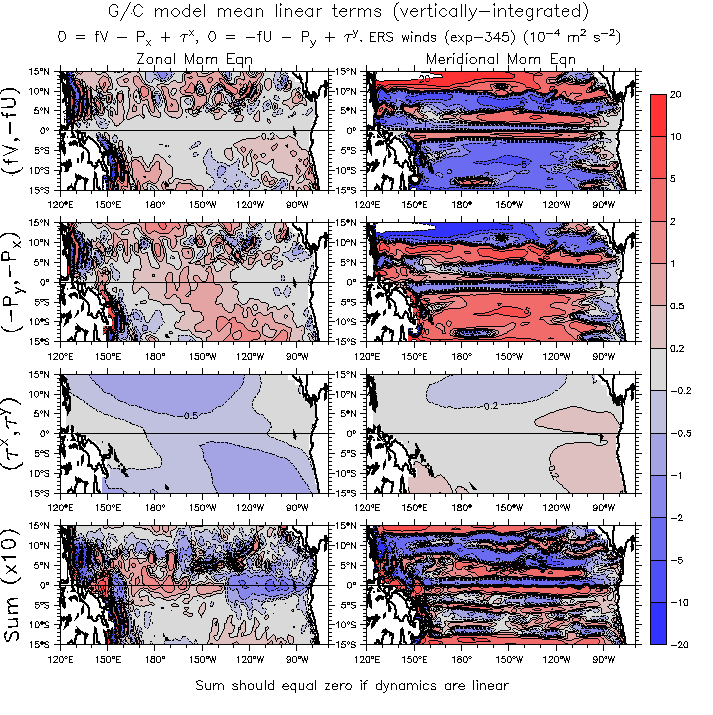
- Sum of mean linear terms (should = 0 if dynamics are linear): Maps Show sum x10
- Maps of mean zonal transports: utotal, ug, uadv utotal 341/345 Layer 1 uadv 341/345/346
- More checks: Maps of uadv+uEk and sums (345)
- Split advection terms (correctly and completely as in G/C eq (64):
- Zonal Meridional
- Separate out hu dot Grad(u): Zonal Meridional
- Components of the term Del dot(uuh)
- Terms from mean u,v,h: Zonal Meridional Zonal from 35-day triangle u,v,w,h
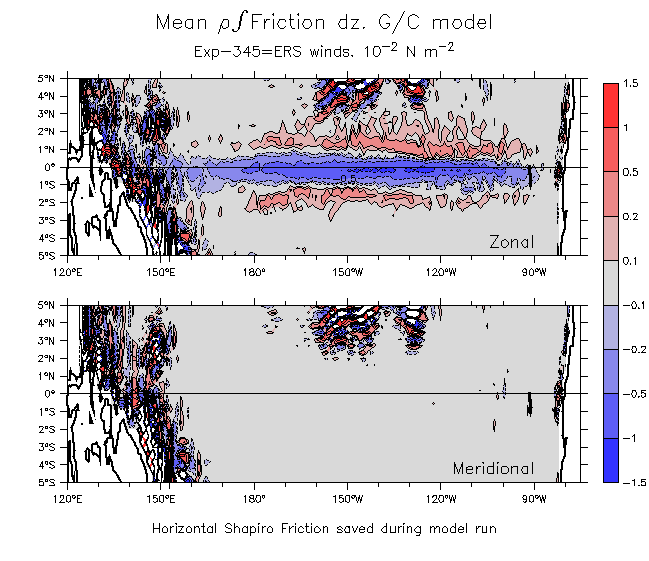
- Explicit friction: Mean vertically-integrated horizontal friction
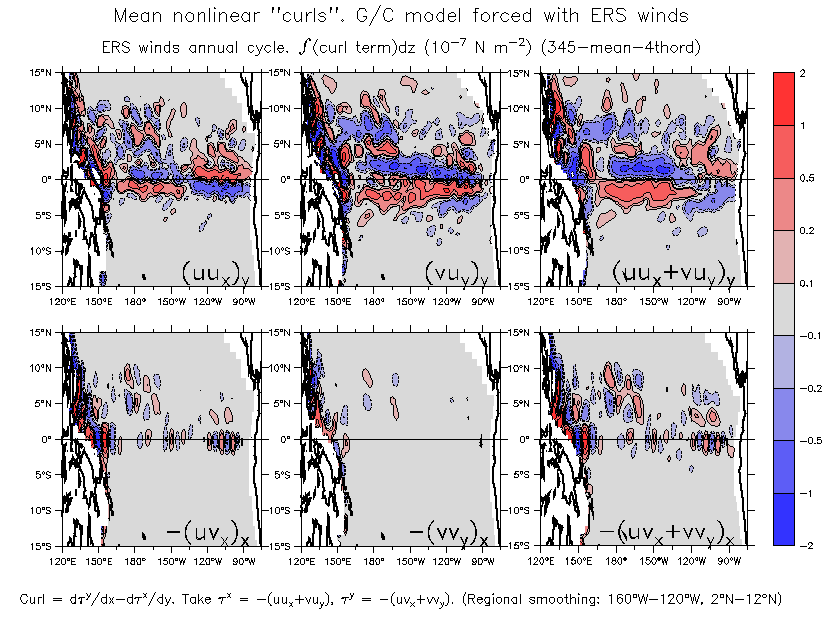
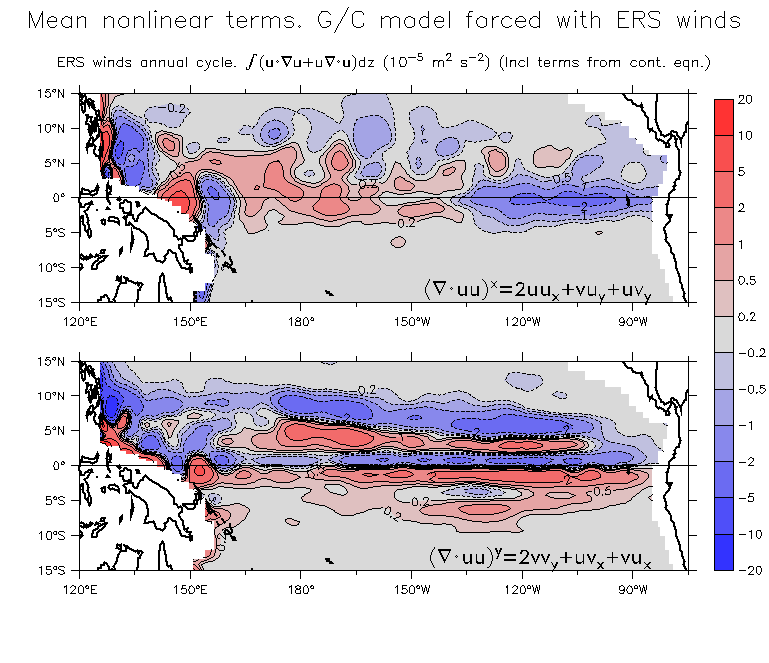
- Ways of parsing Curl(Del dot uu):
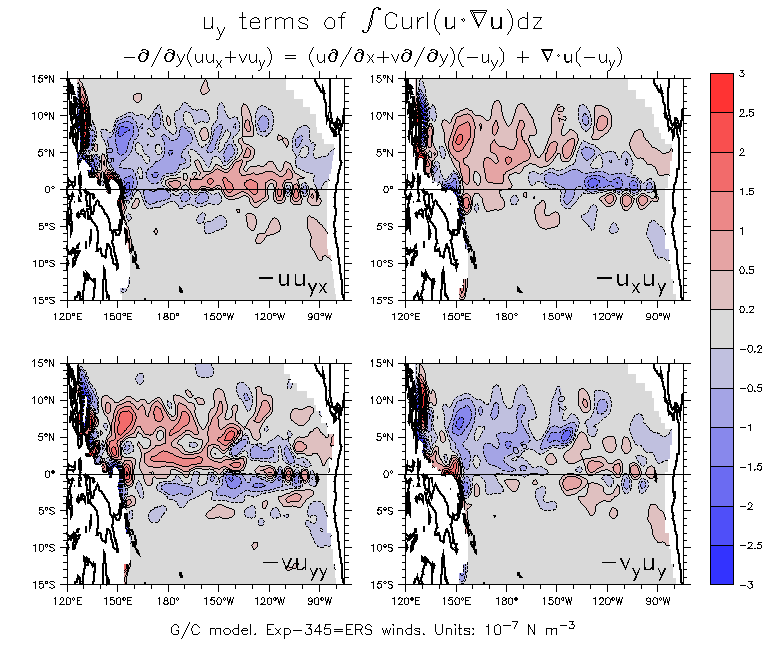
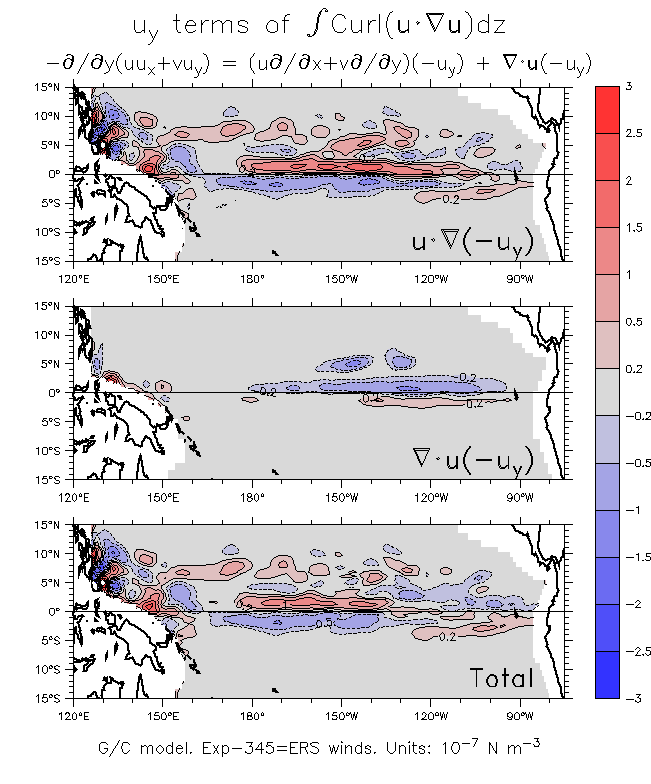
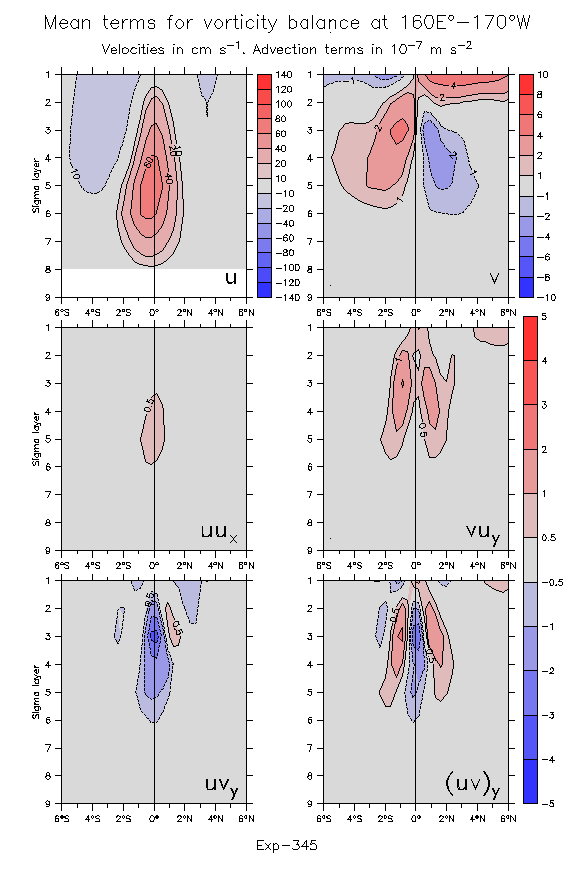
- u_y terms of Curl(u dot Grad(u)): Individual terms Sums
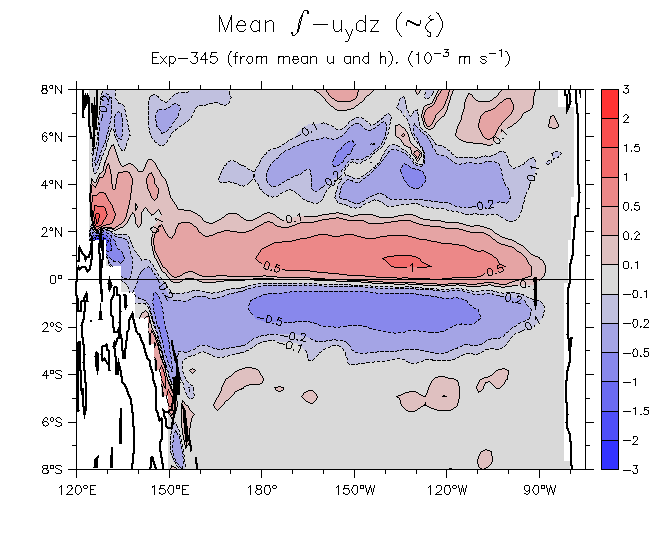
- Mean relative vorticity
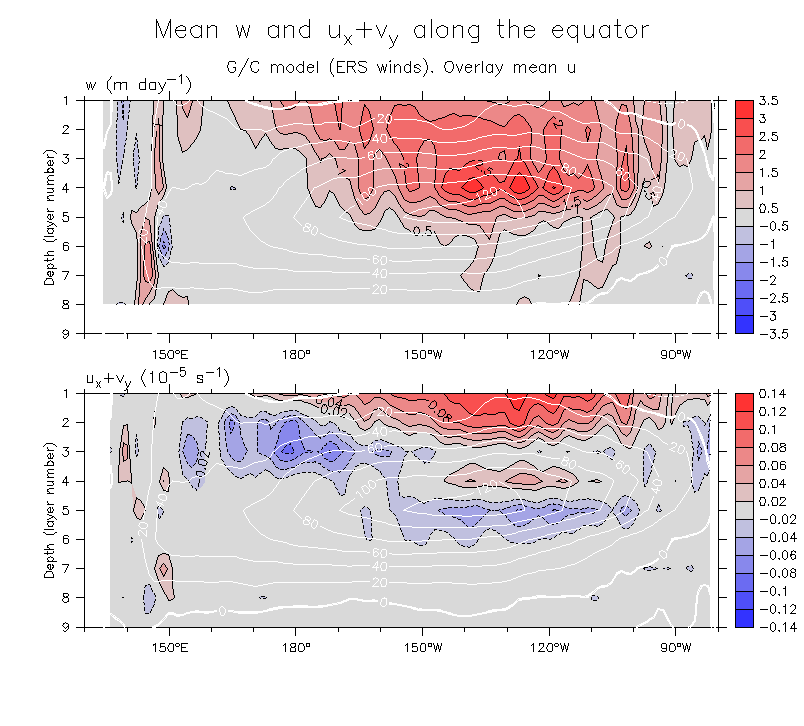
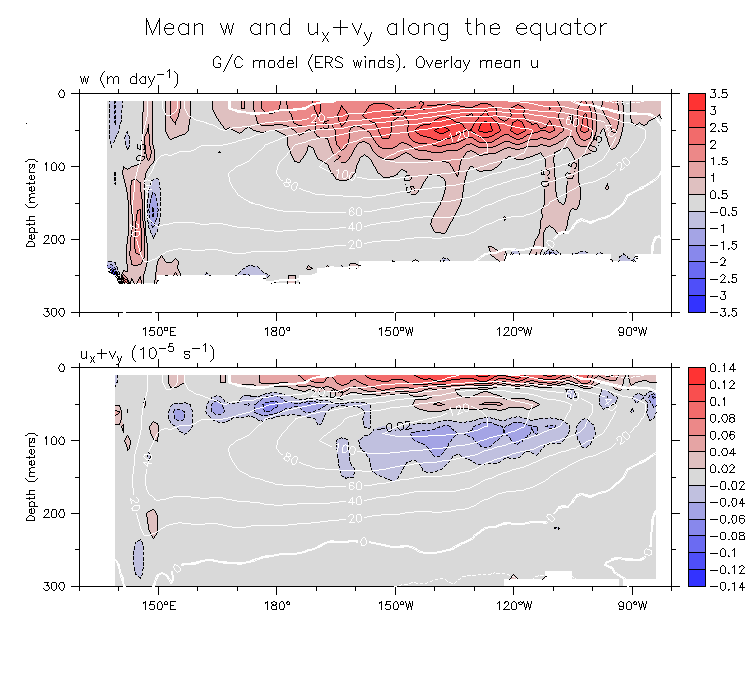
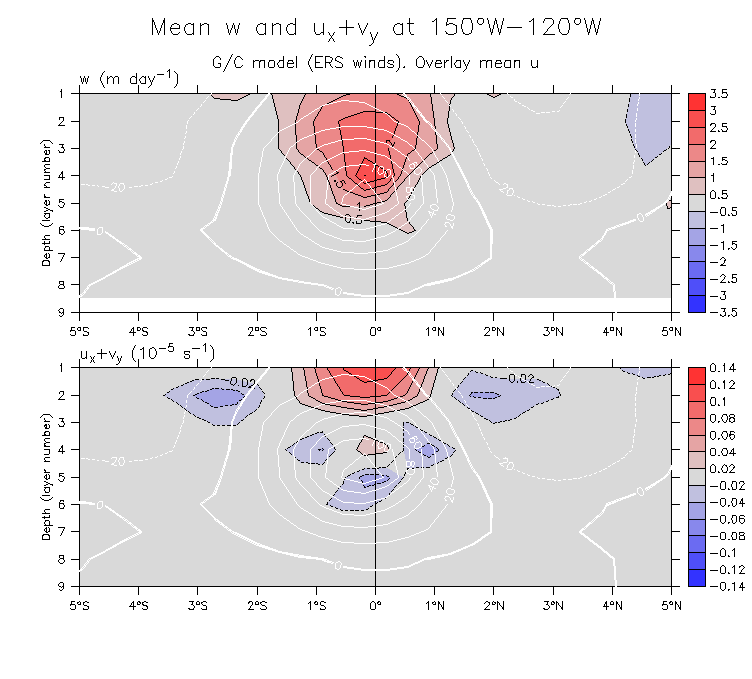
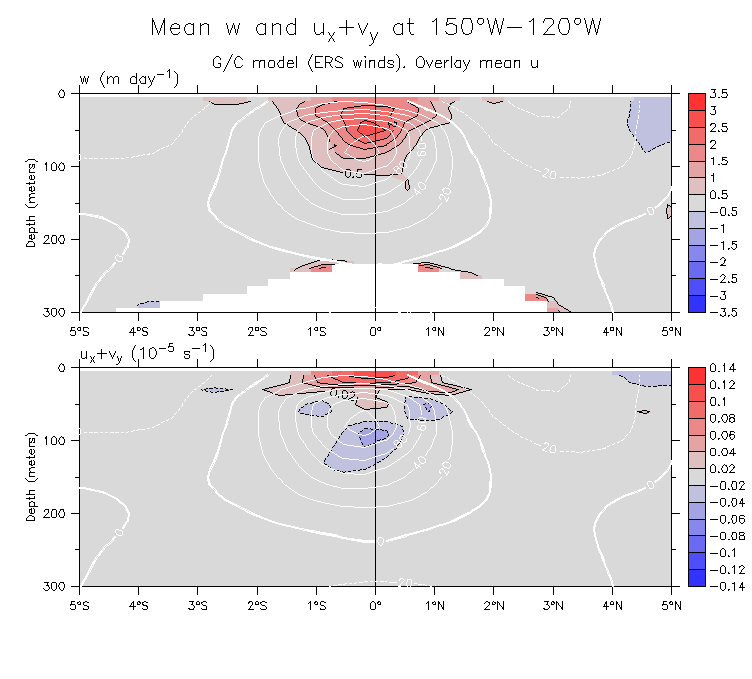
- Vertical structure of w and u_x+v_y: Equator: On sigma On z 150°-120°W meridional section: On sigma On z
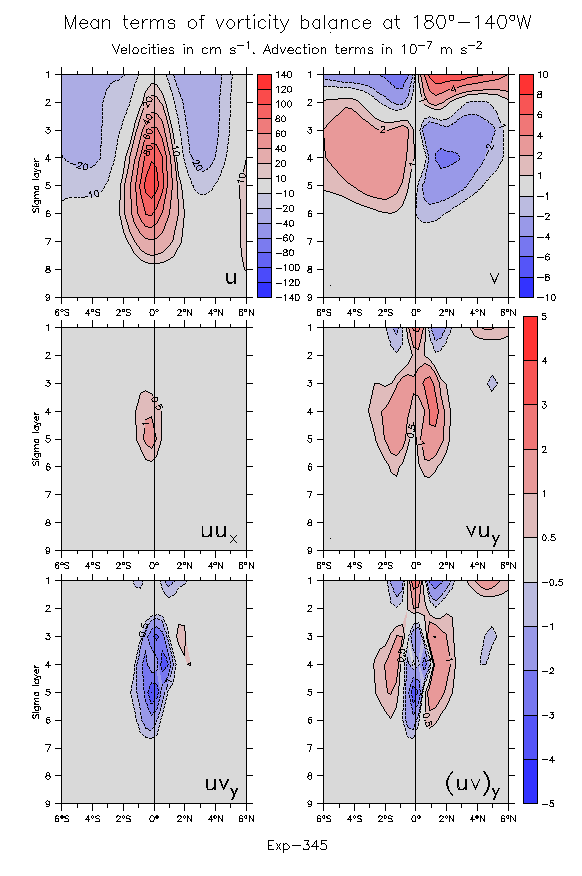
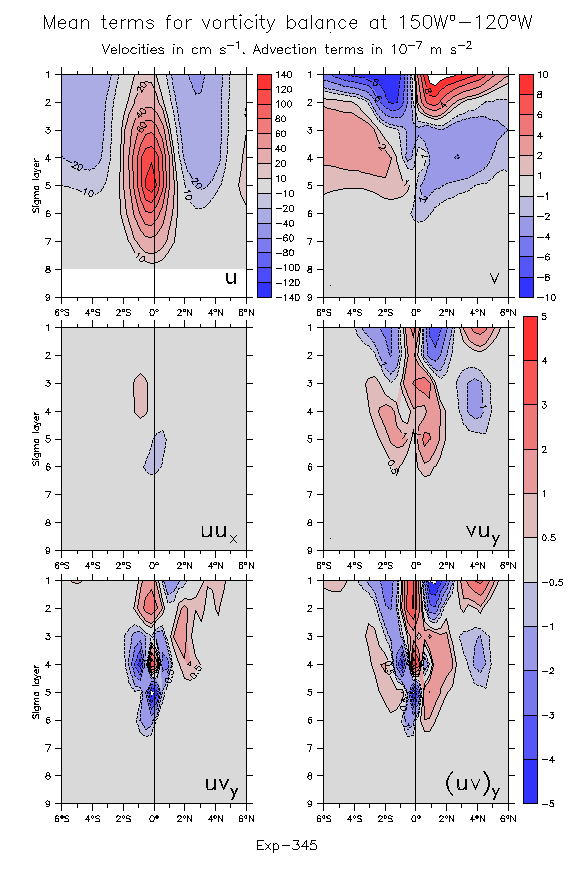
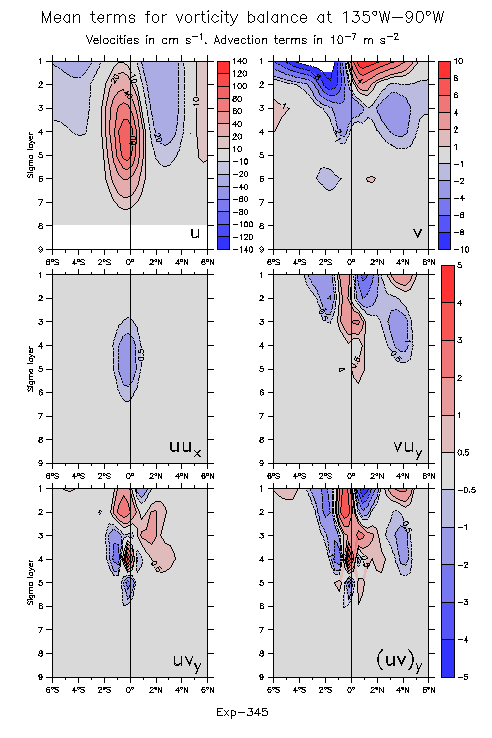
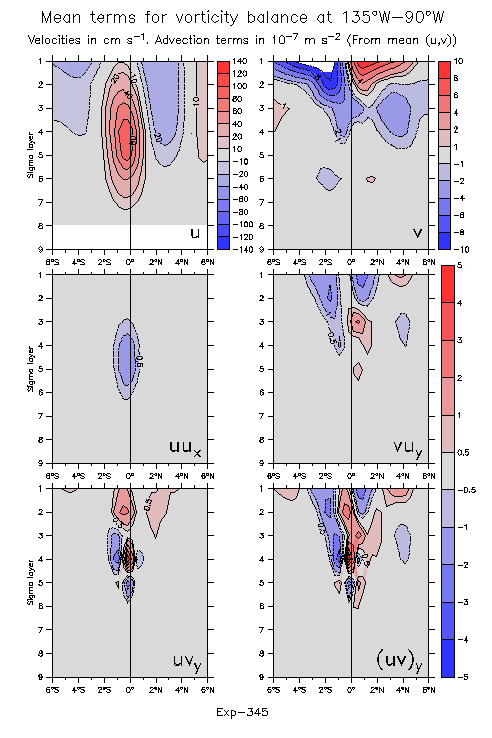
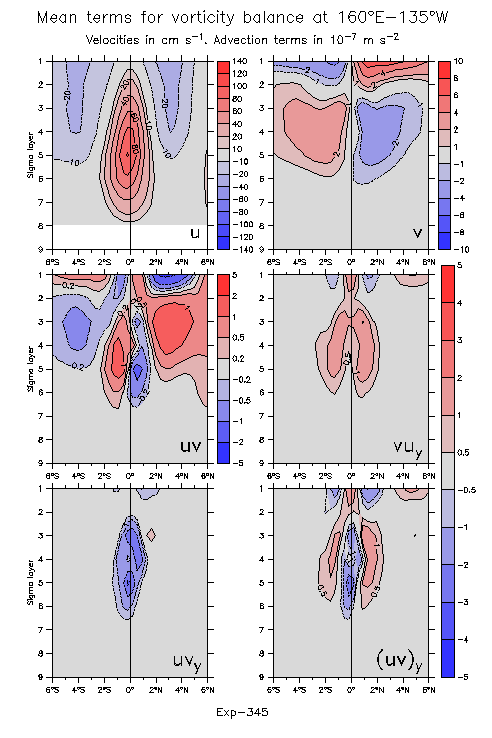
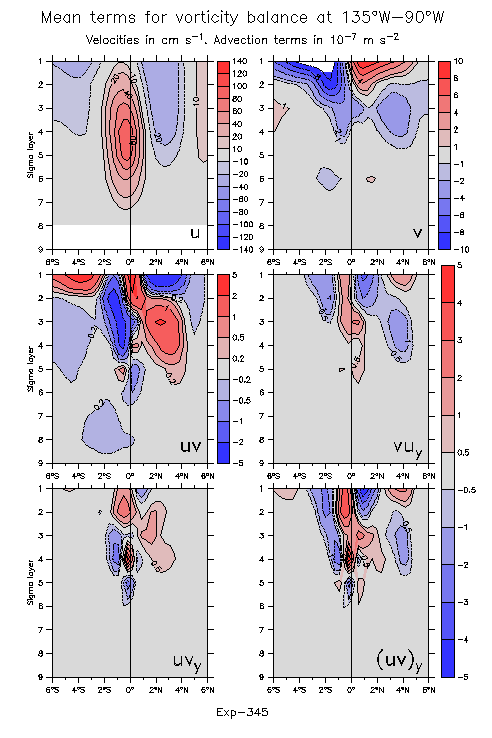
- Vertical structure of u,v,uu_x,vu_y,uv_y,(uv)_y: 160°E-170°W 180°-140°W 150°W-120°W 135°W-90°W 135°W-90°W from mean (u,v)
Omit uu_x, show (uv): 165°E-135°W 135°W-90°W
- V. Int. advection terms (incl continuity eqn: uv_y,vu_x):
Individual terms Sums vu_y+uv_y From smoothed u Full-Smooth (=TIW)
- Indiv terms plus sums: Zonal terms More smoothing
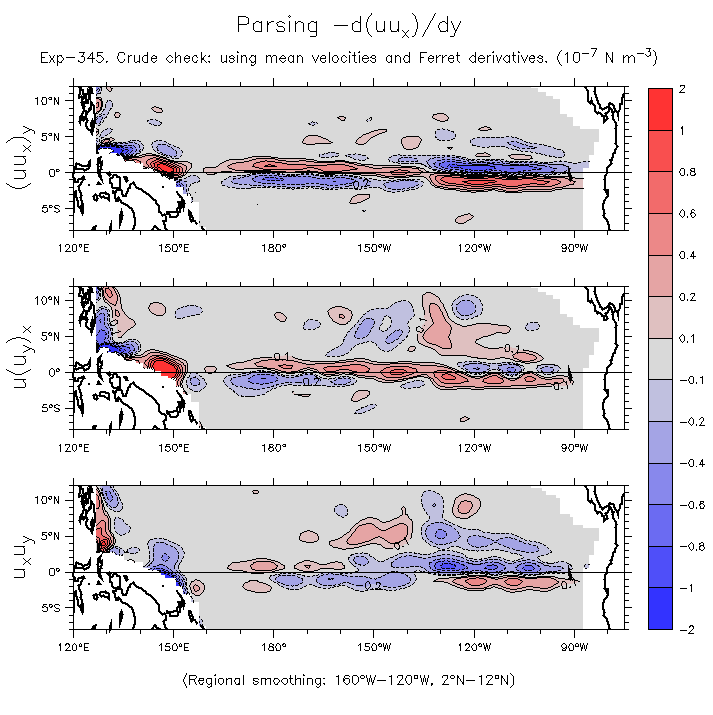
- Parts of d(uu_x)/dy
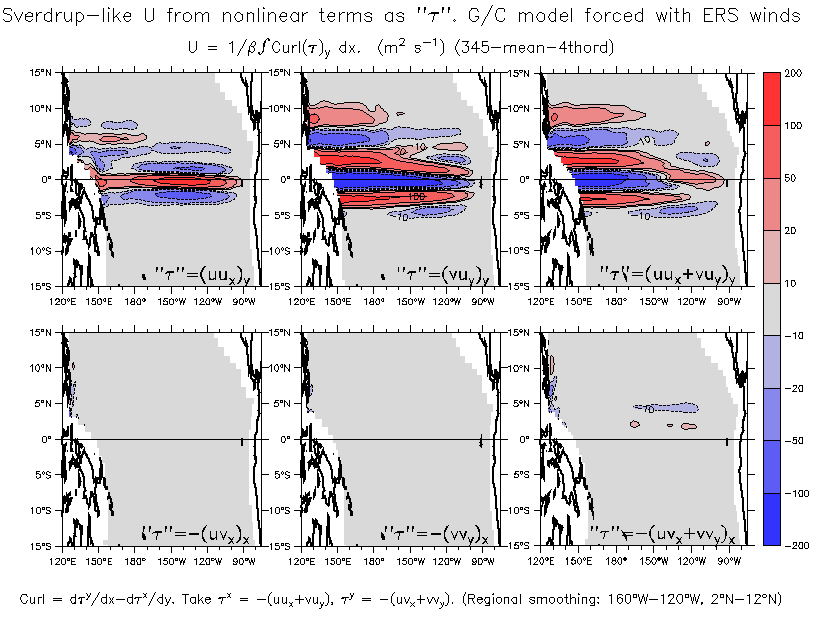
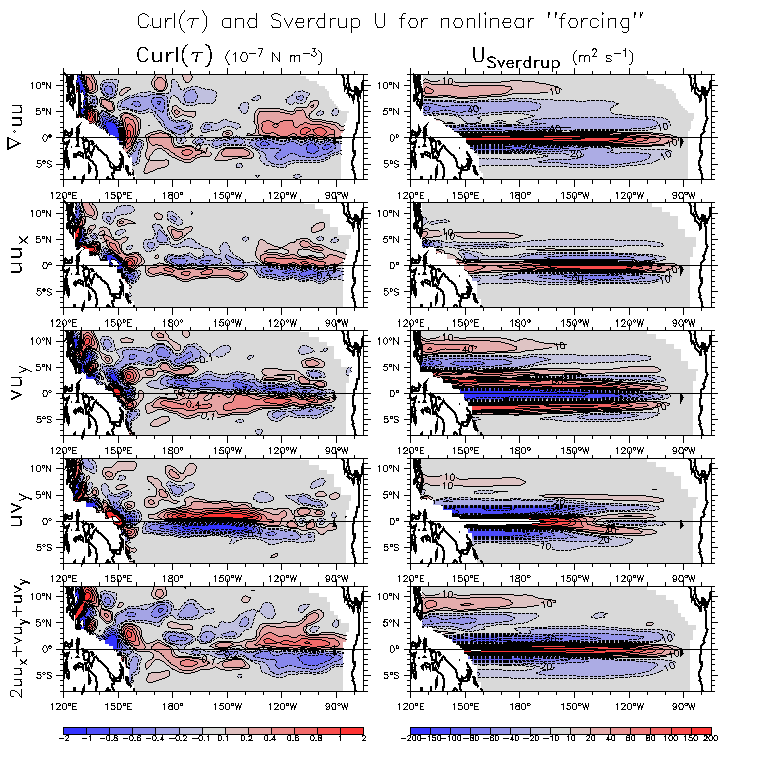
Sverdrup-like U from parts of Del dot(uu: uu_x, vu_y, uv_y, sum
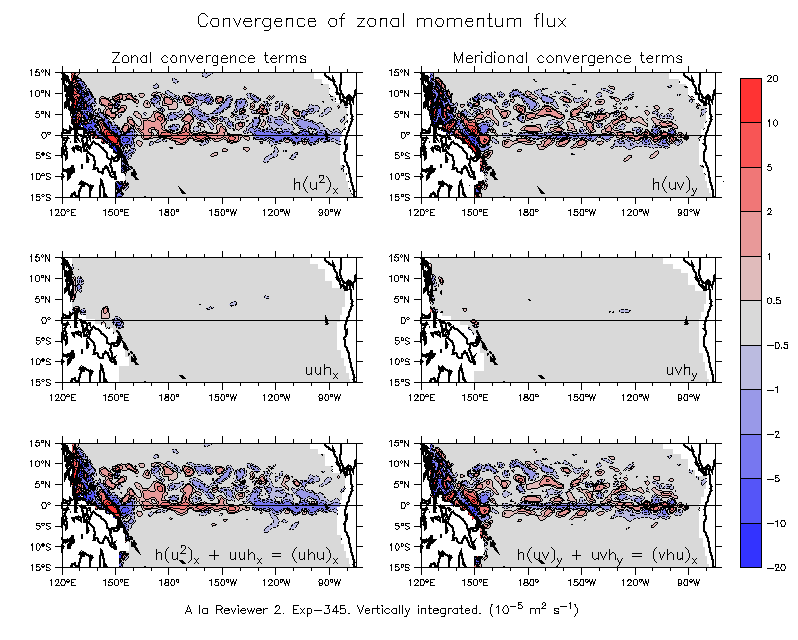
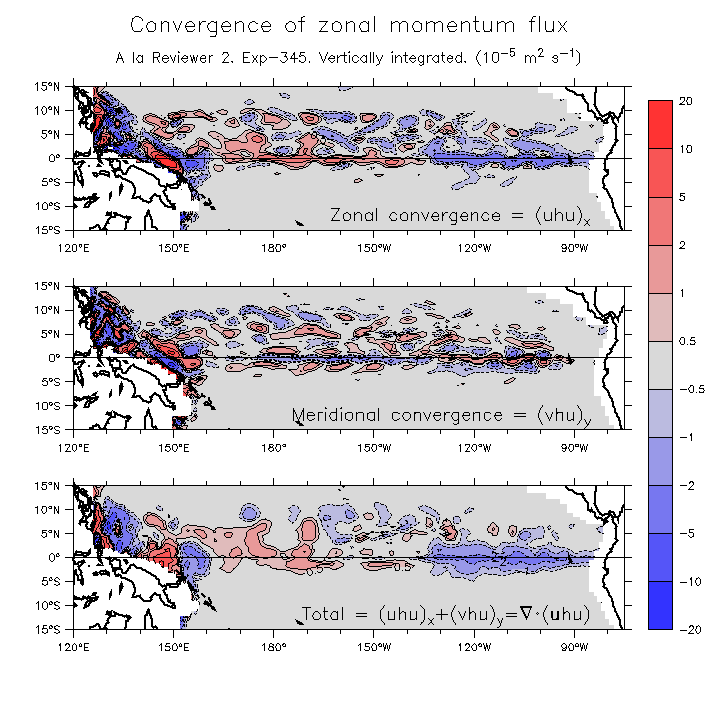
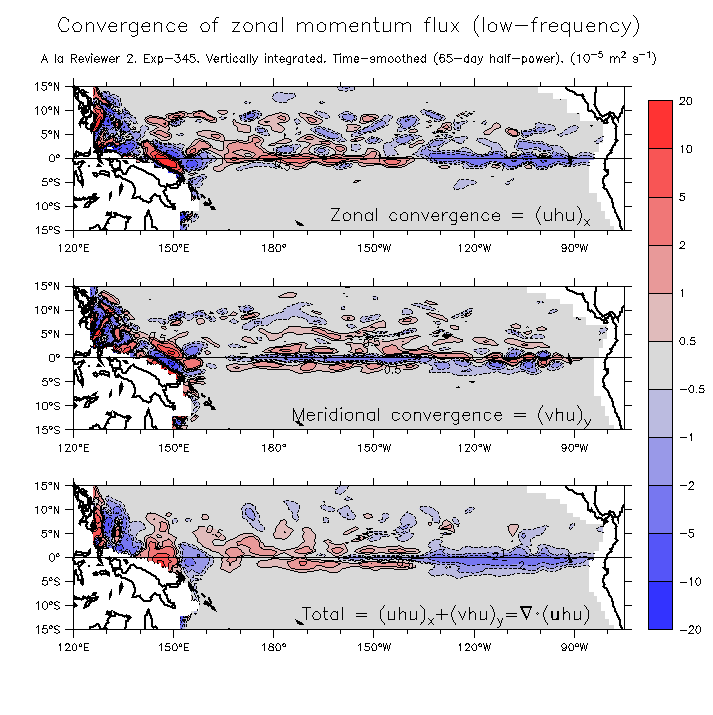
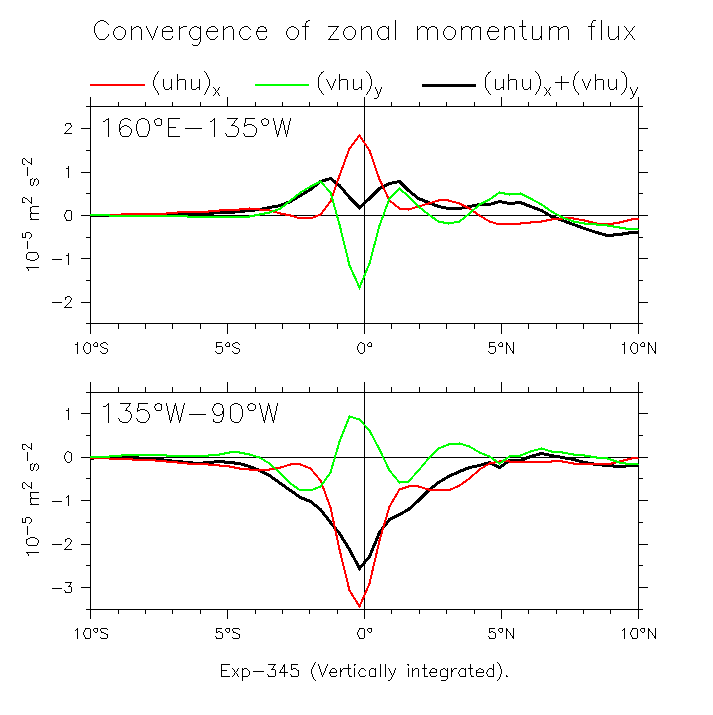
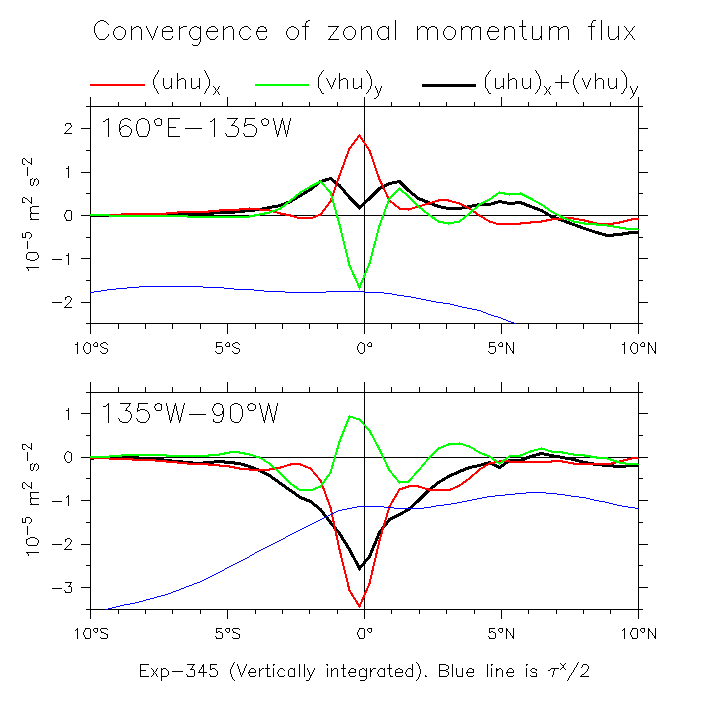
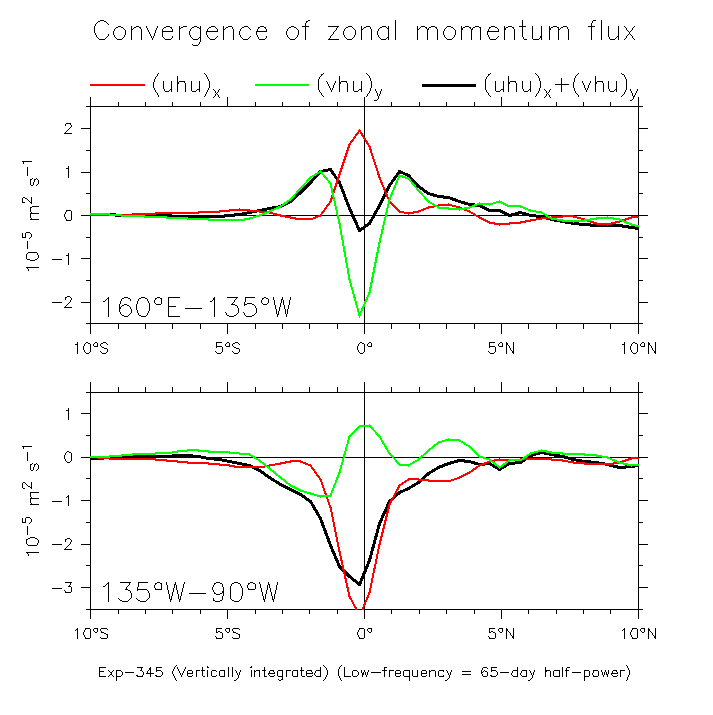
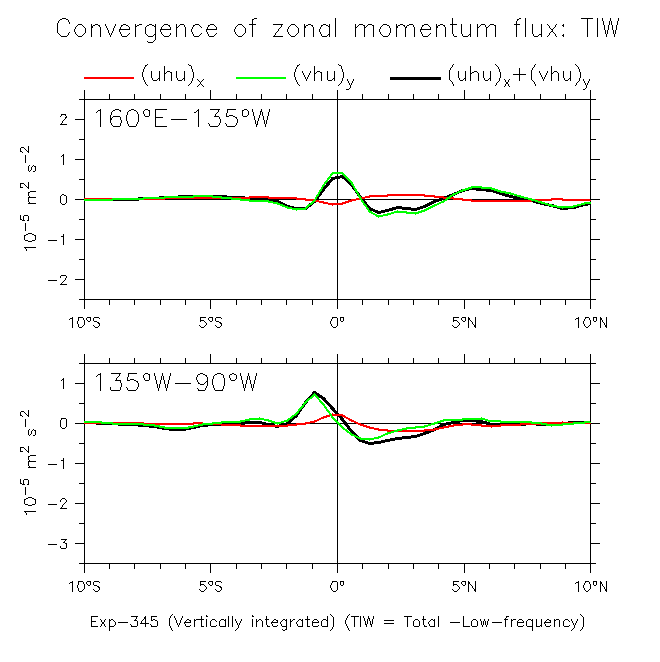
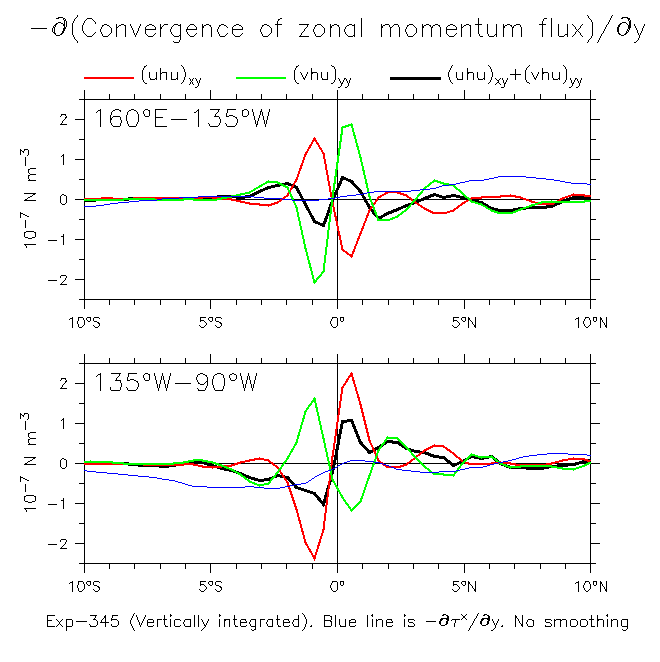
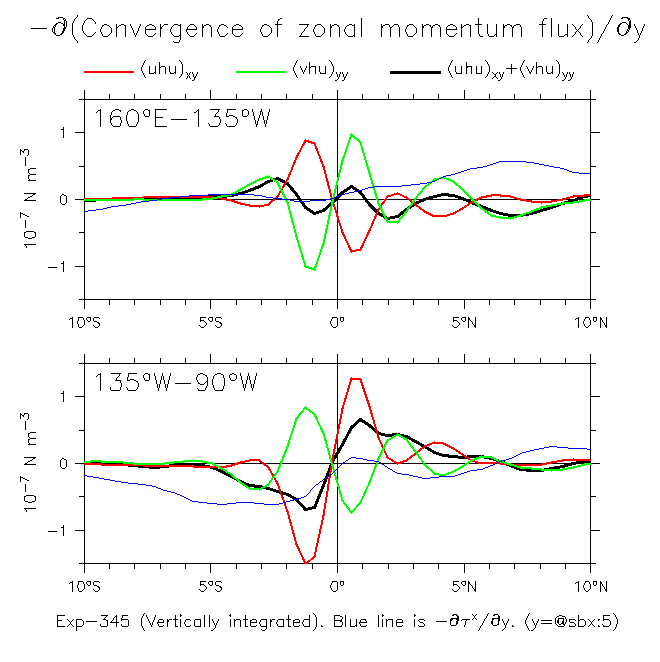
- Terms split a la Reviewer 2: convergence of zonal momentum = (uhu)_x+(vhu)_y:
Maps: Individual terms Sums Low-frequency
E and W Pacific averages: Full time dep Overlay Taux Low frequency TIW Curl Smoothed curl
Plot convergence of meridional momentum the same way: E and W Pacific averages
d(uv)/dy with overlaid u, dv/dy, and T
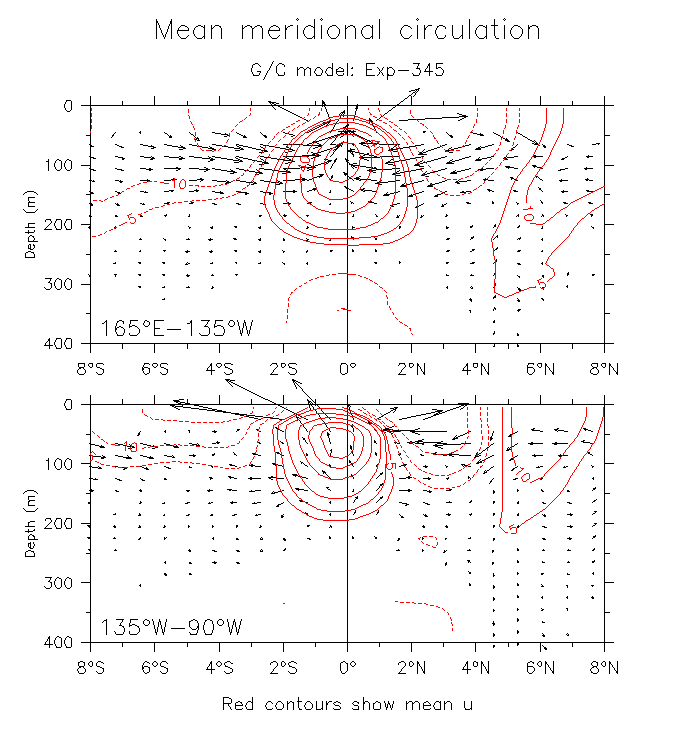
Model meridional circulation (E and W Pacific): V1 V2 V3
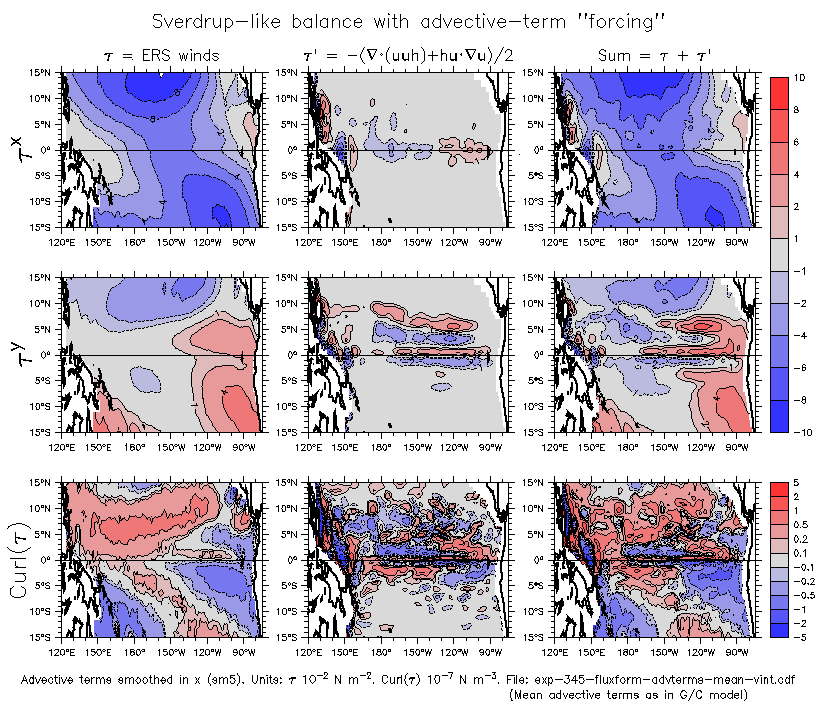
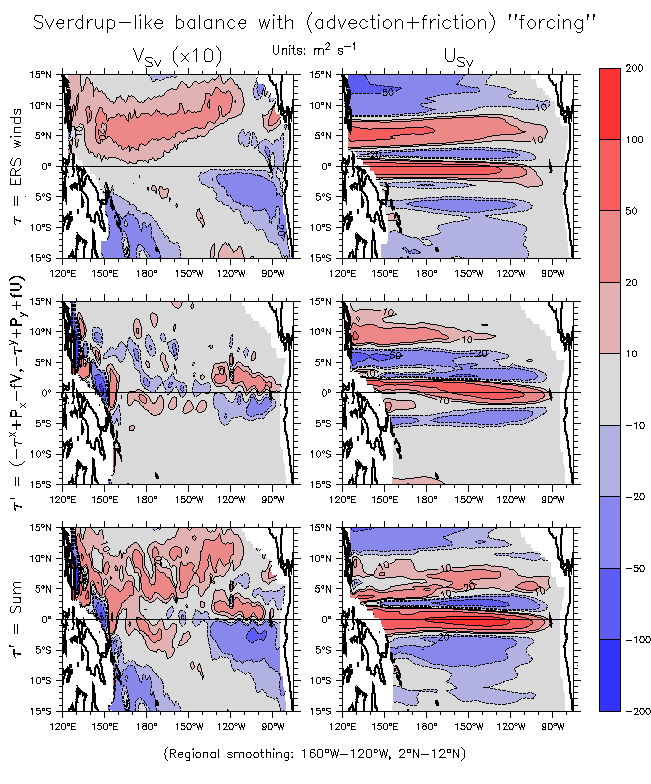
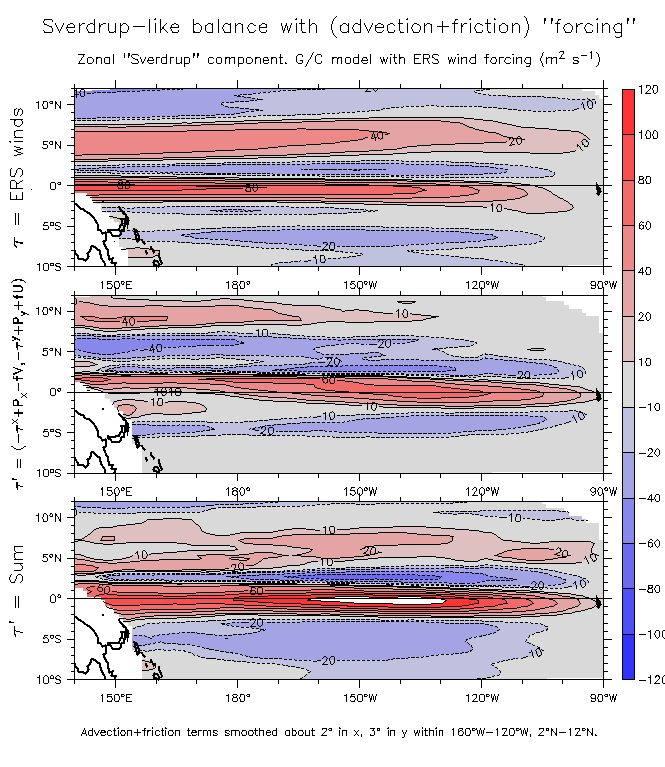
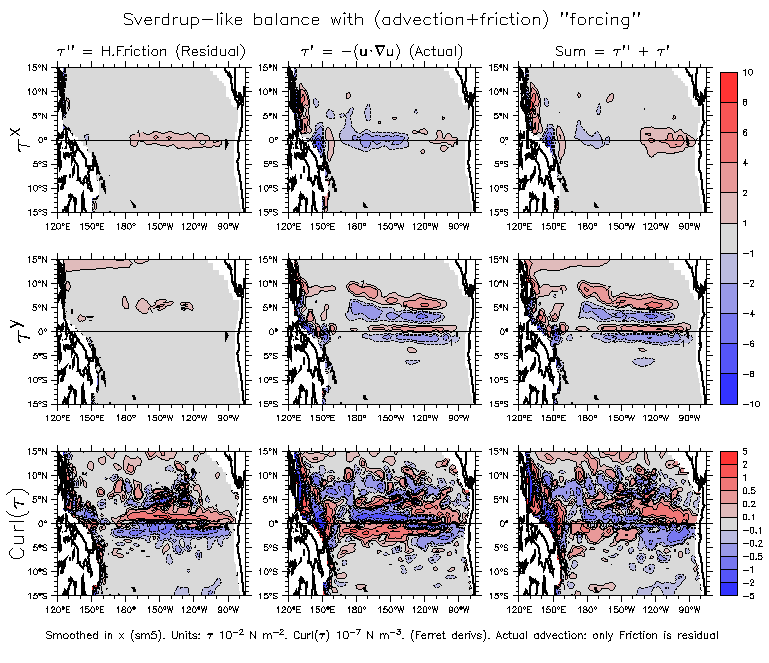
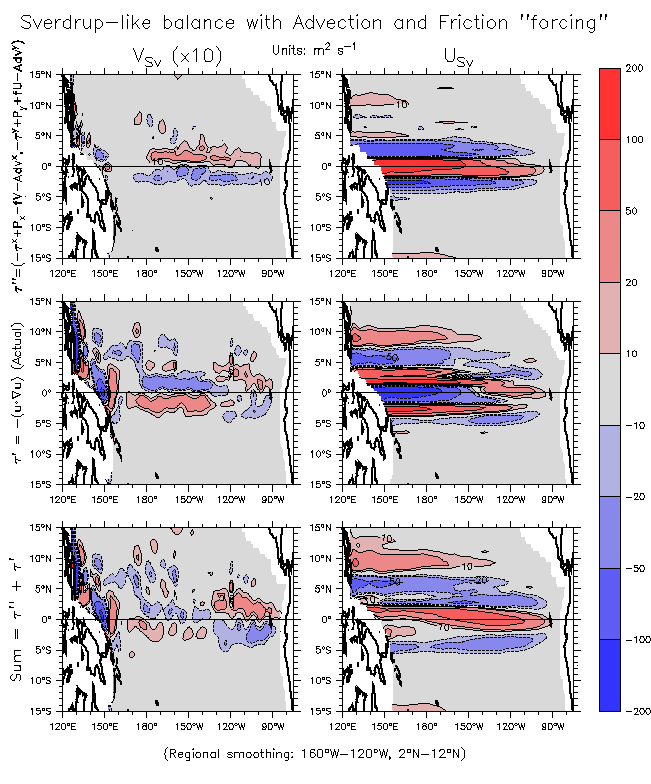
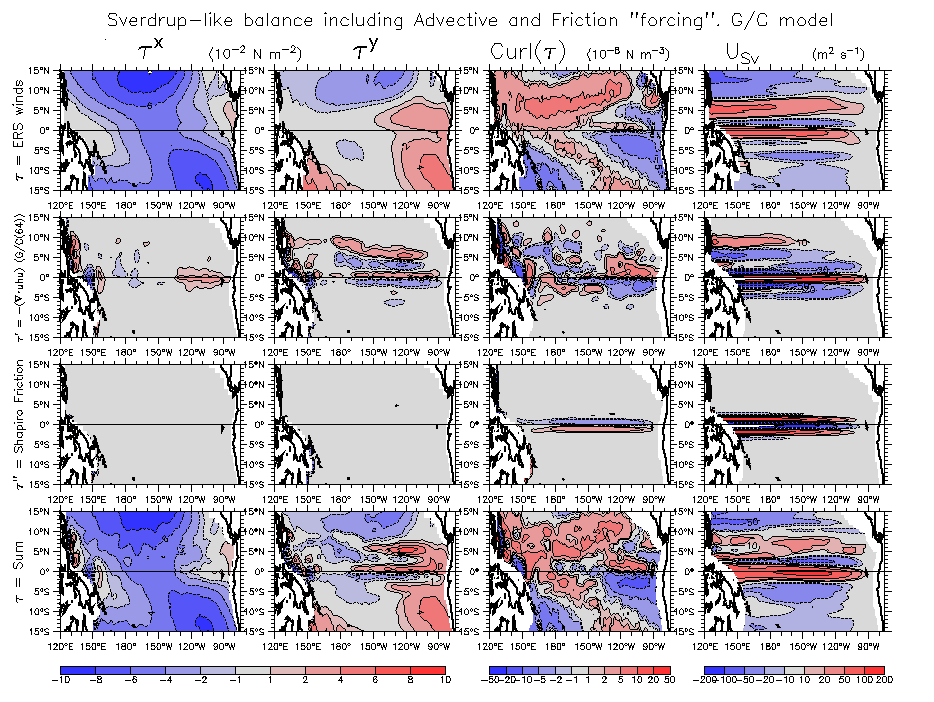
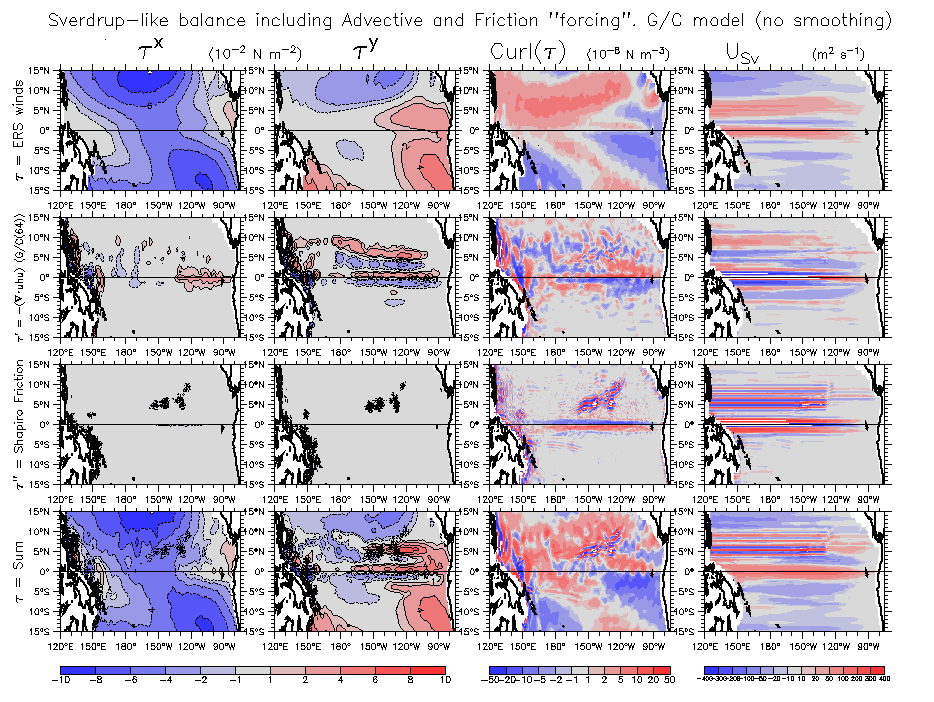
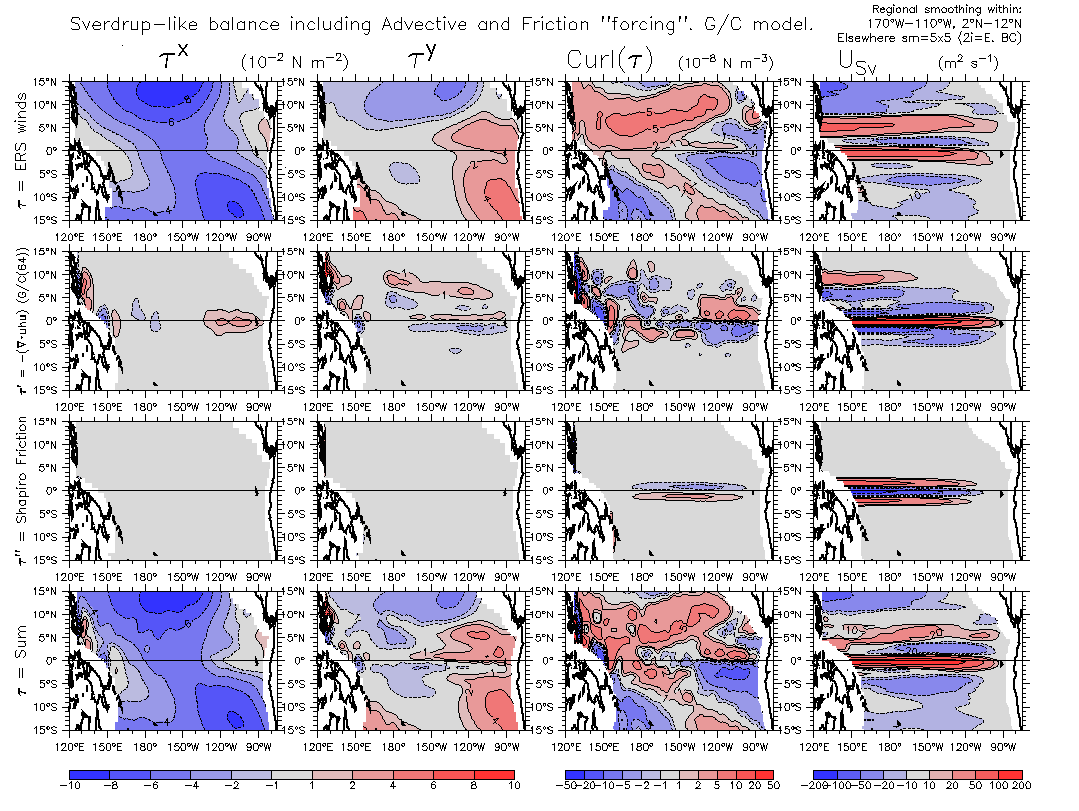
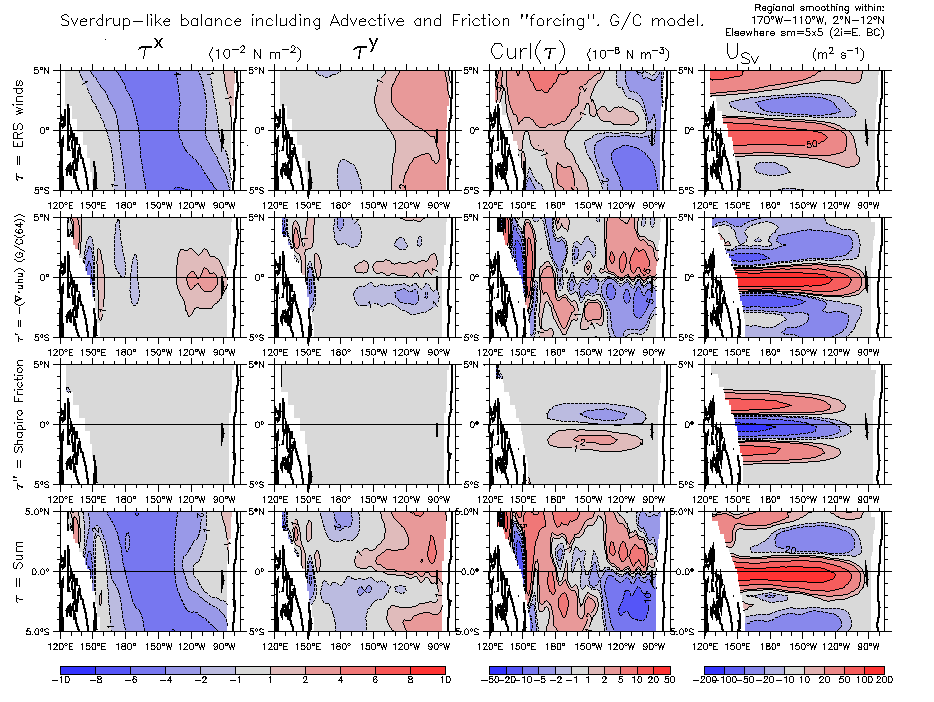
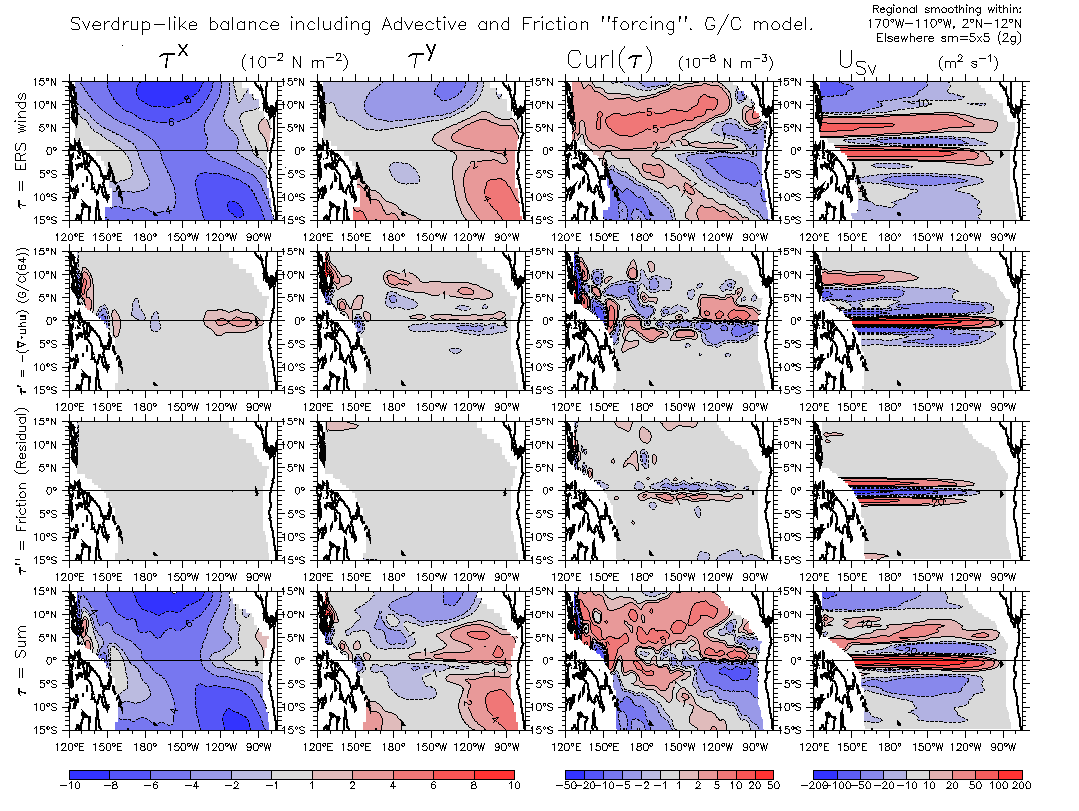
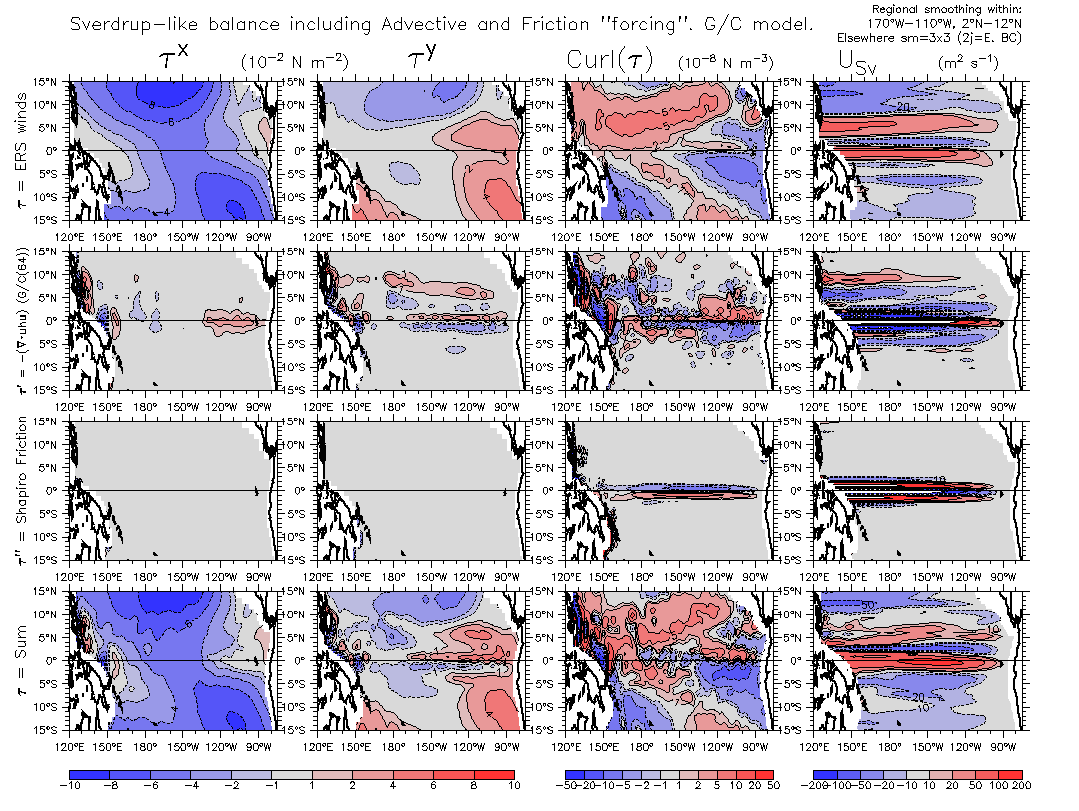
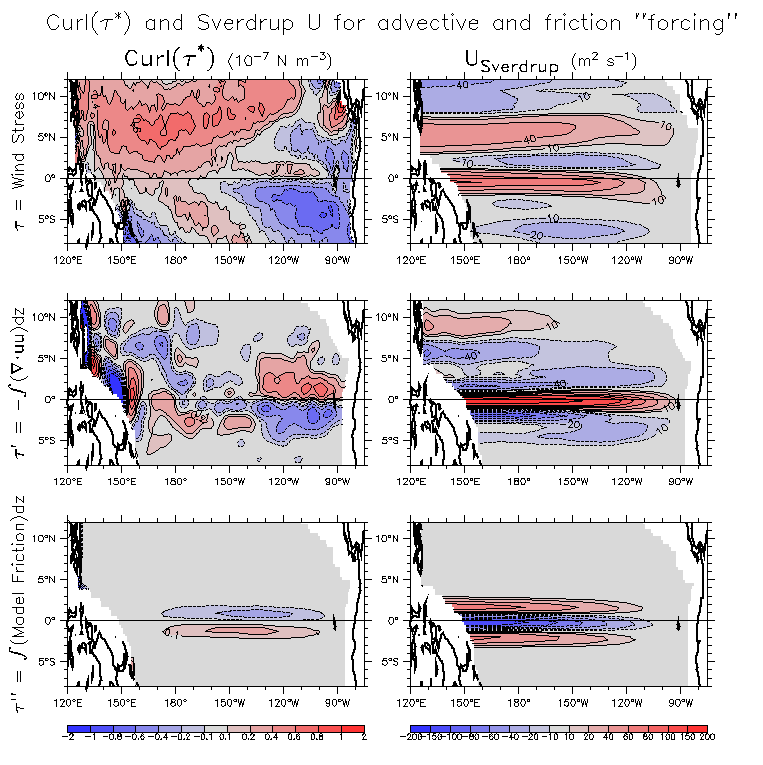
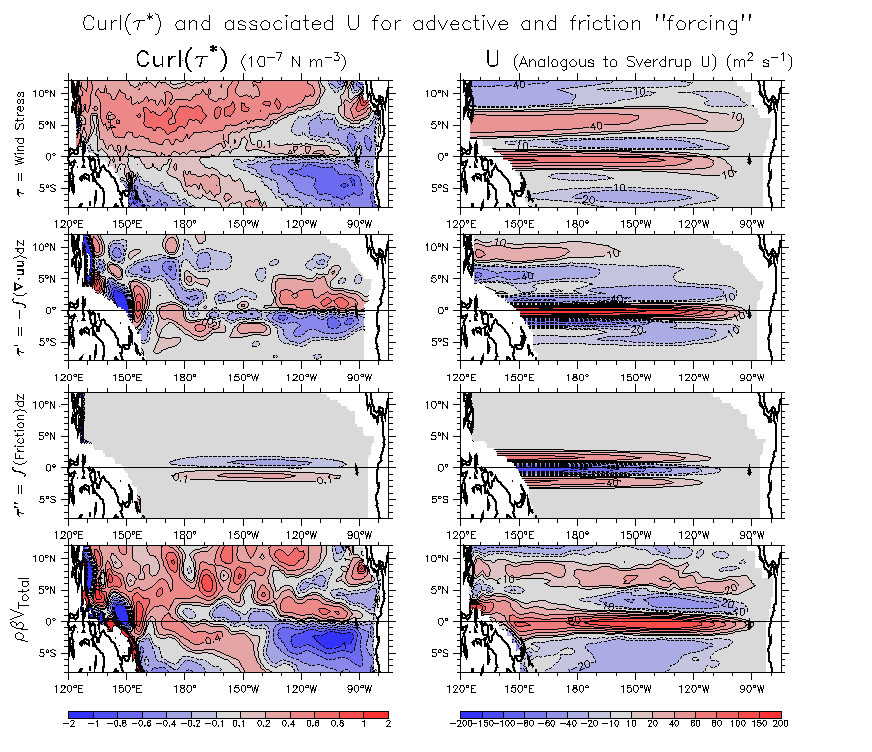
- An idea of Dennis's: Take advection terms as a Tau-like "forcing":
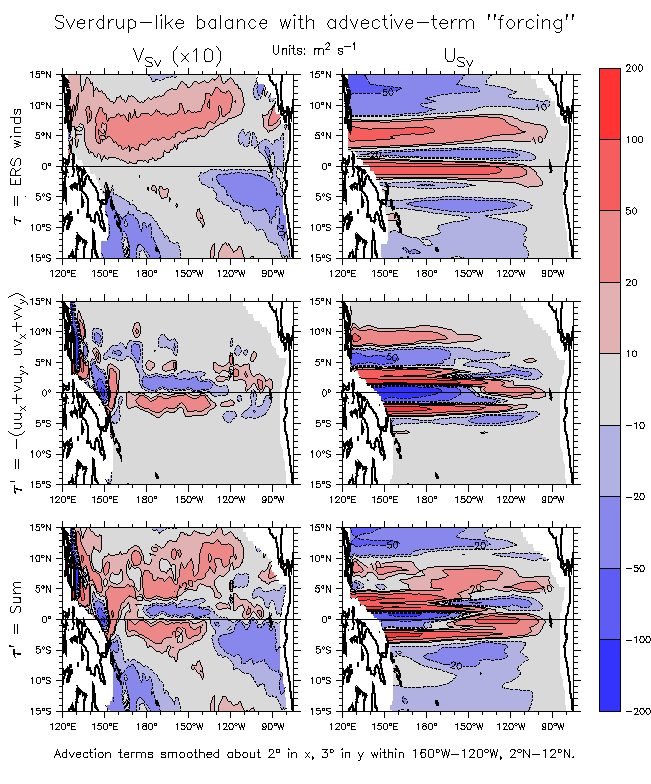
- Tau's and Curl's USv and VSv
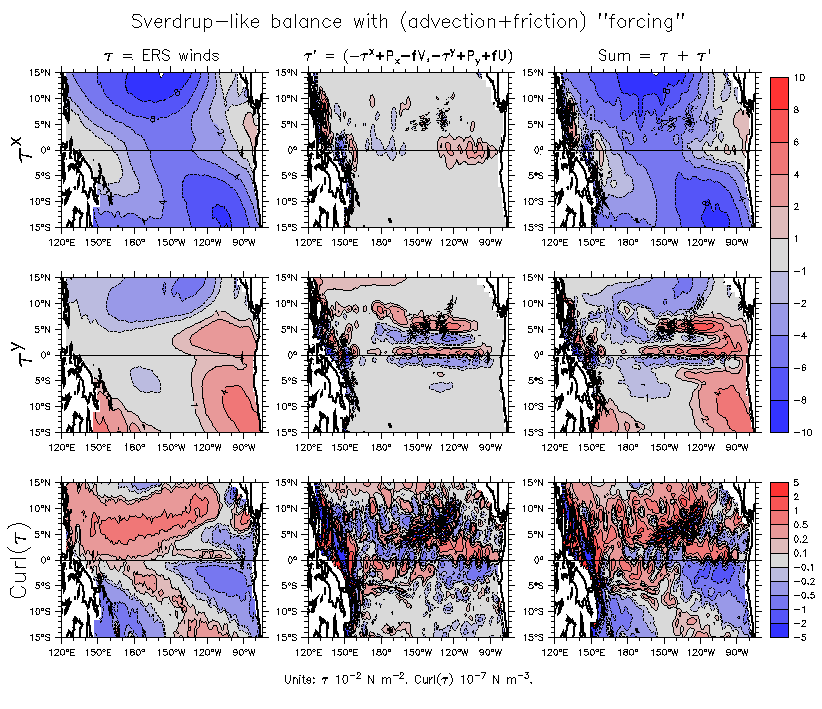
- Include Horizontal Friction term in "forcing":Tau's and Curl's USv and VSv Compare ADCP
- Just Horizontal Friction term in "forcing":Tau's and Curl's USv and VSv
- Summary figures with most of the above combined:
Shapiro friction:Too smooth Unsmoothed Regional smoothing Correct BC Detail 5°S-5°N Friction as a residual
2j = adjusted smoothing
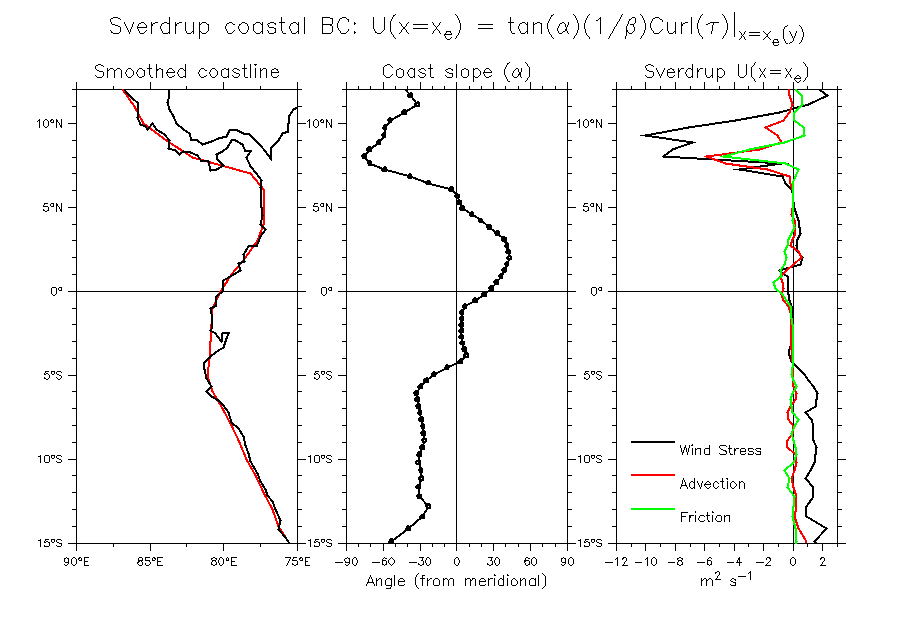
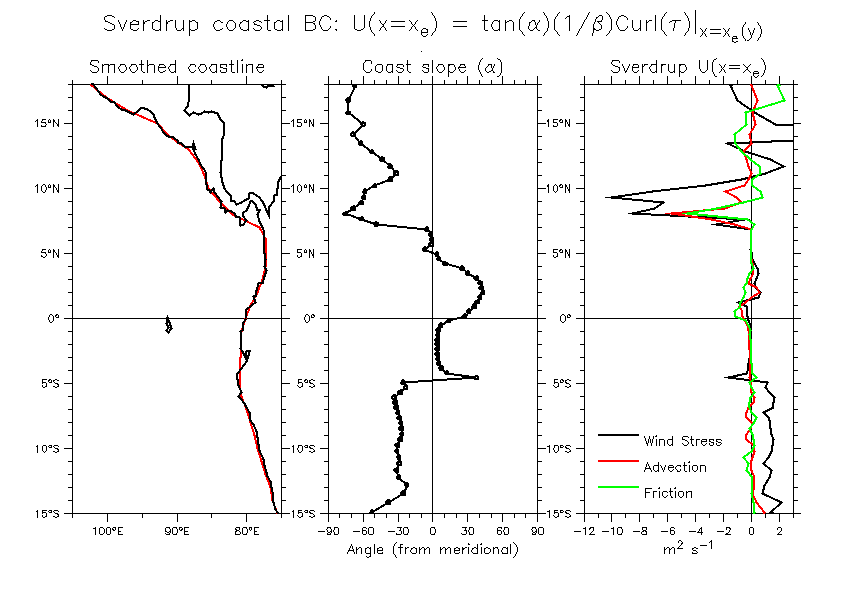
- Eastern boundary condition fields (To 18°N)
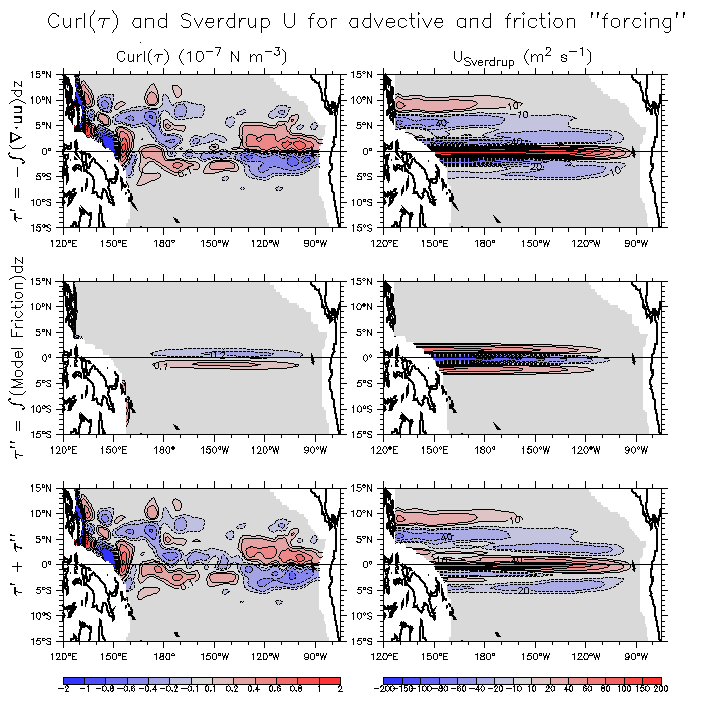
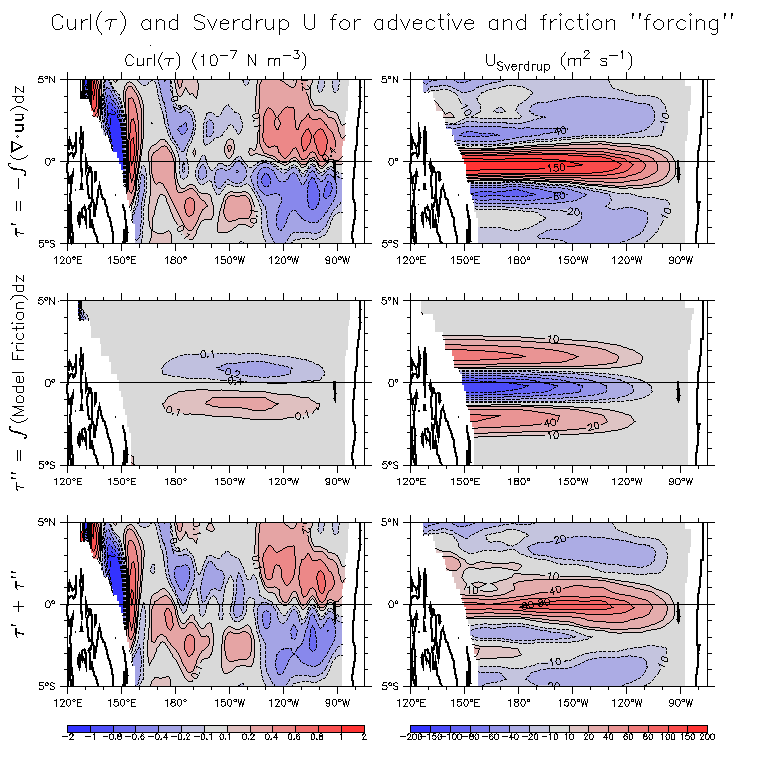
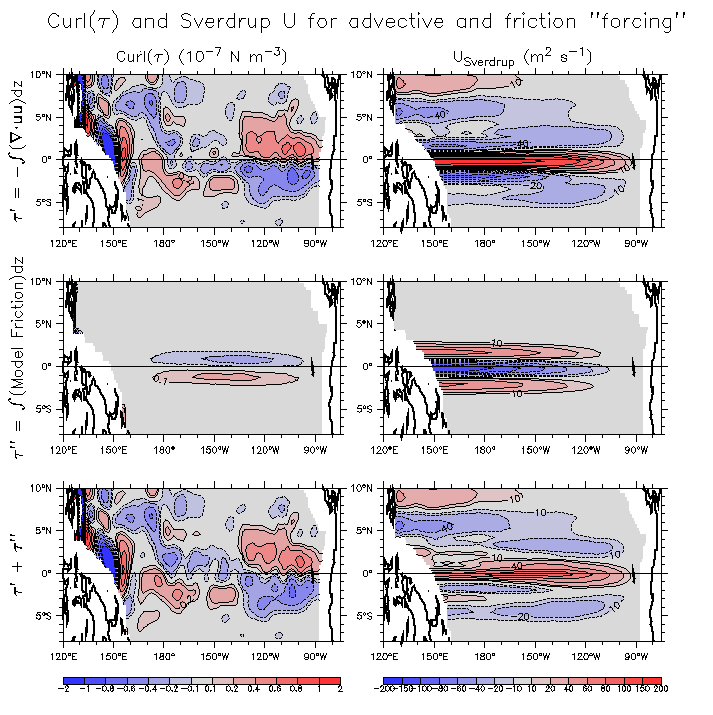
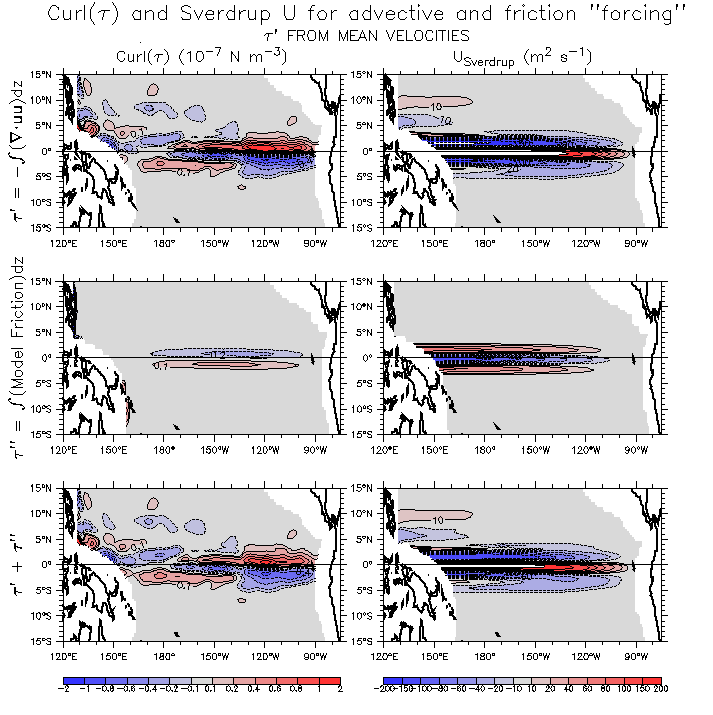
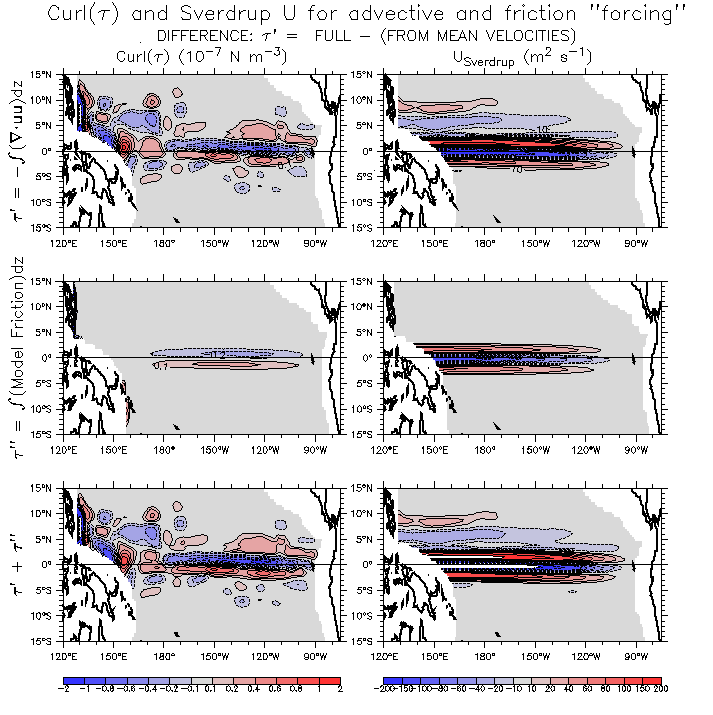
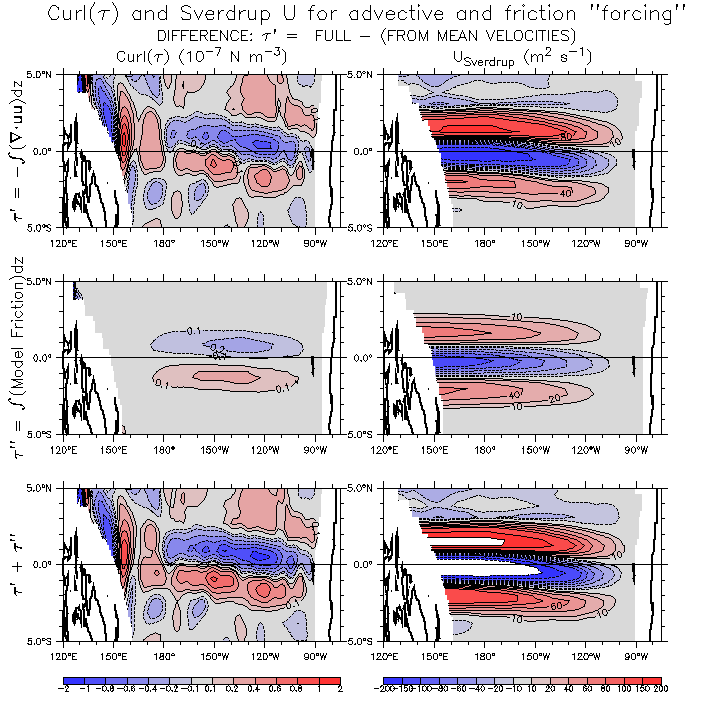
- Curl and Sverdrup U due to adv+friction terms only: Fig FFF (Tau', Tau'' and sum)
15°S-15°N 5°S-5°N 8°S-10°N Advective term from mean velocities Difference Detail 5°S-5°N
Include wind term (talk slide)
Add panel for Beta*V
Sum of Tau+Tau'+Tau''
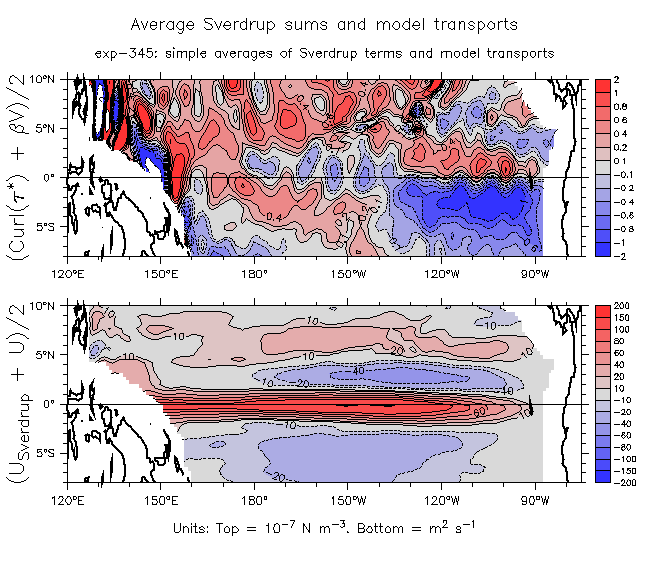
Sum checks: Sverdrup sums Beta*V and U Differences Averages U comparison V comparison (Smooth V)
- Advective vorticity term: compare full time dependence and term from mean or smoothed u:
Curl and U_Sv
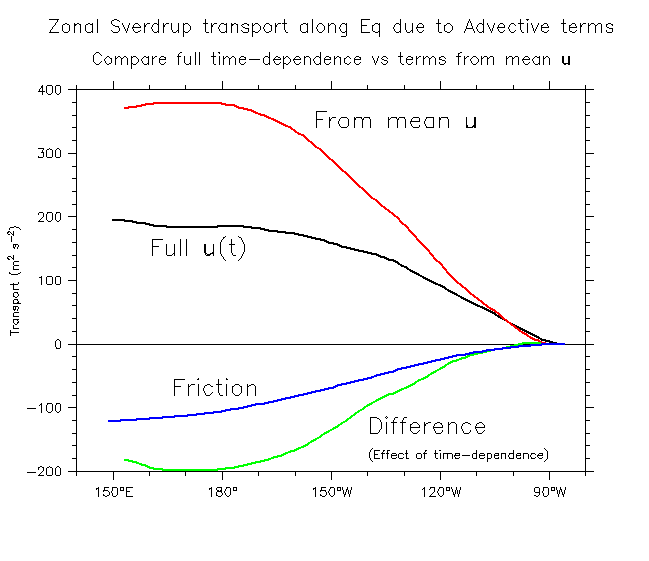
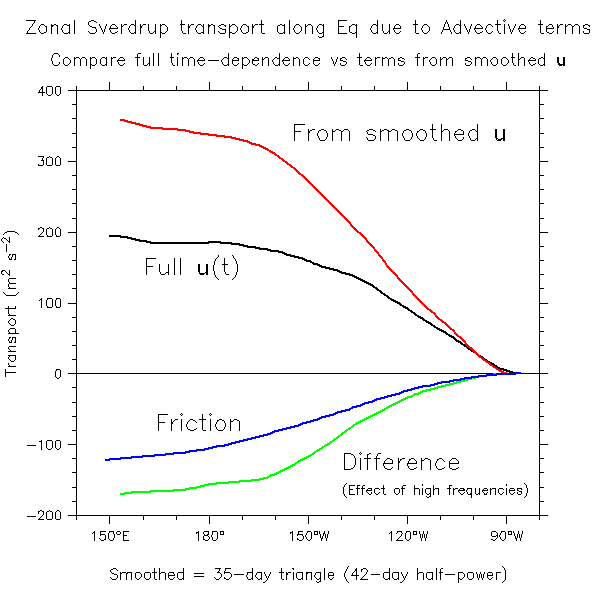
Line plots of U_Sv along equator: Mean u Smoothed u
- Consistency checks on these things:
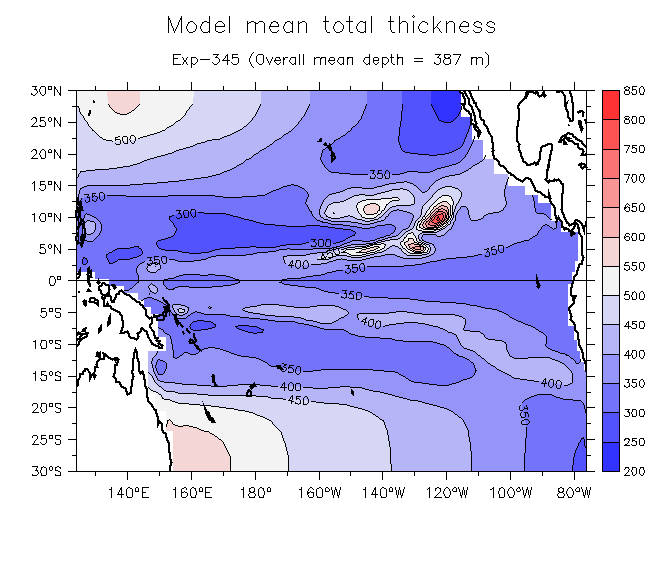
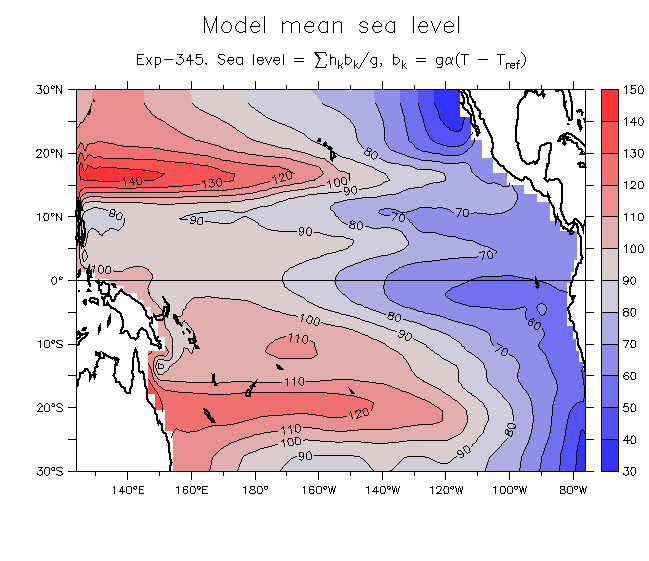
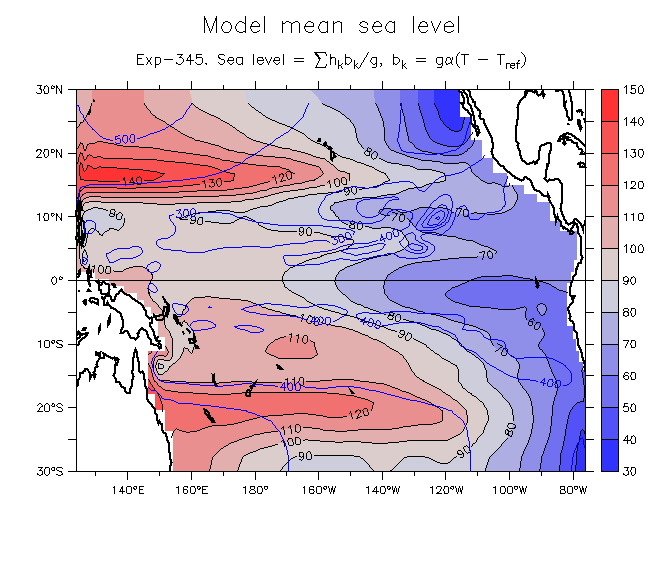
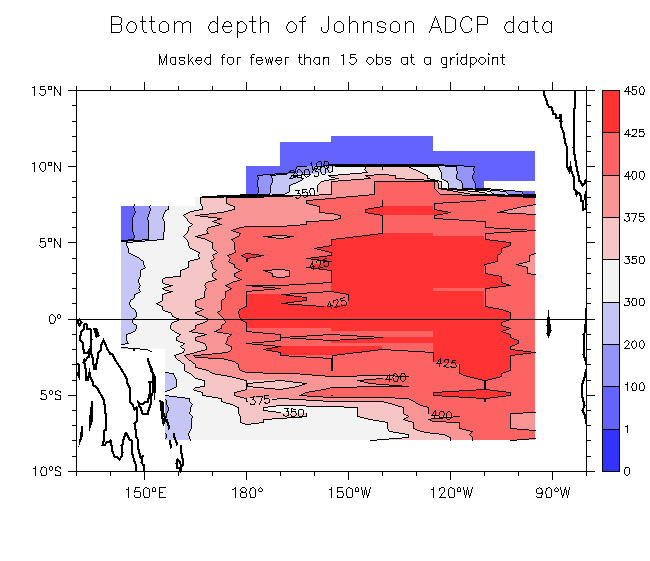
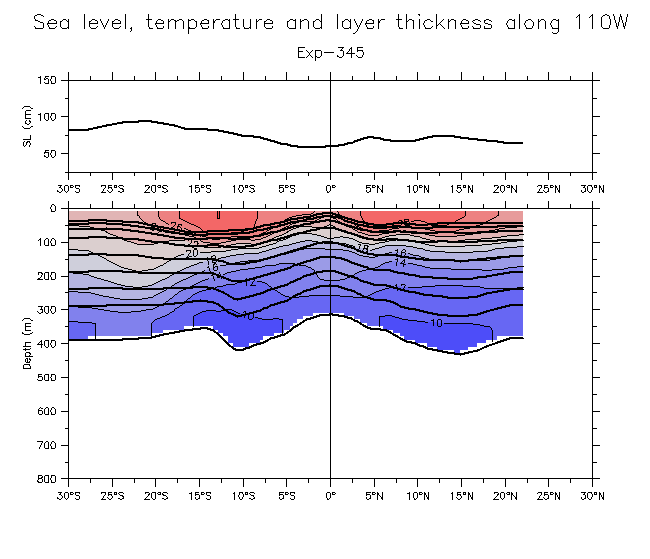
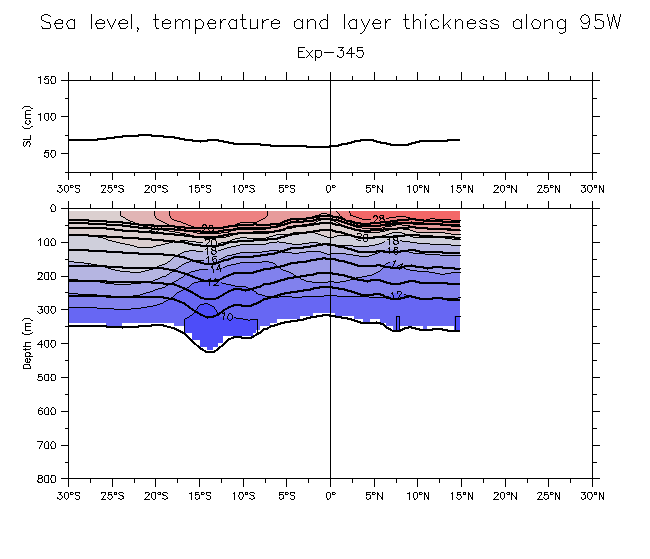
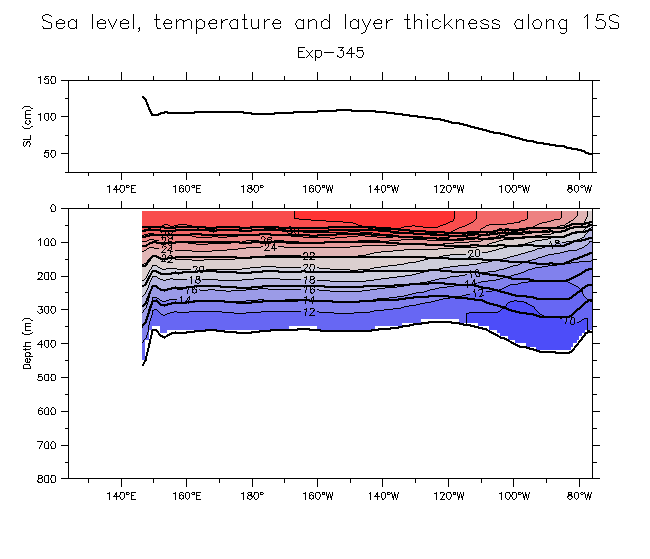
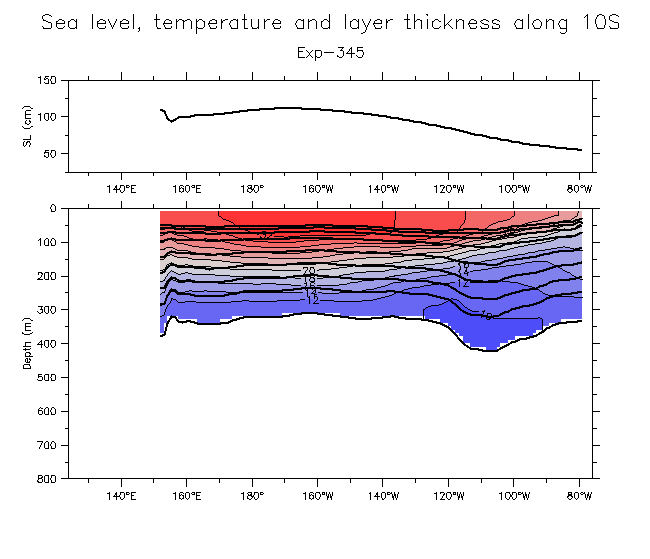
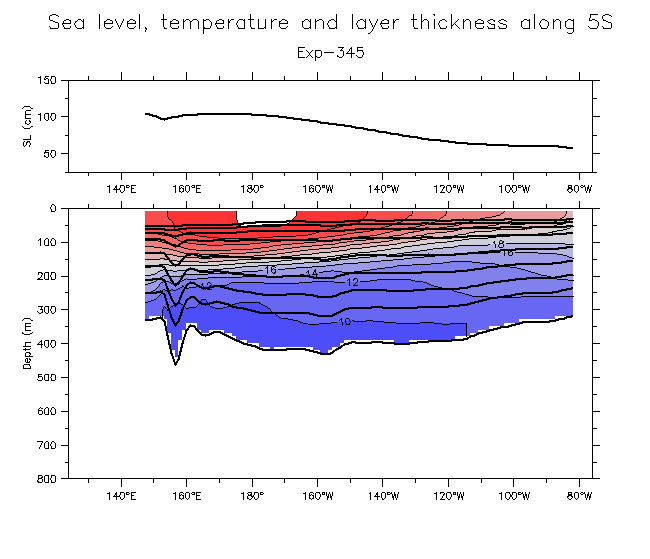
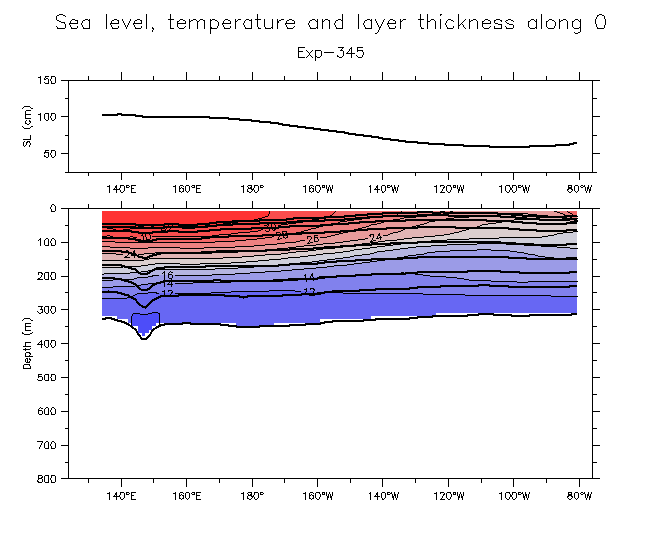
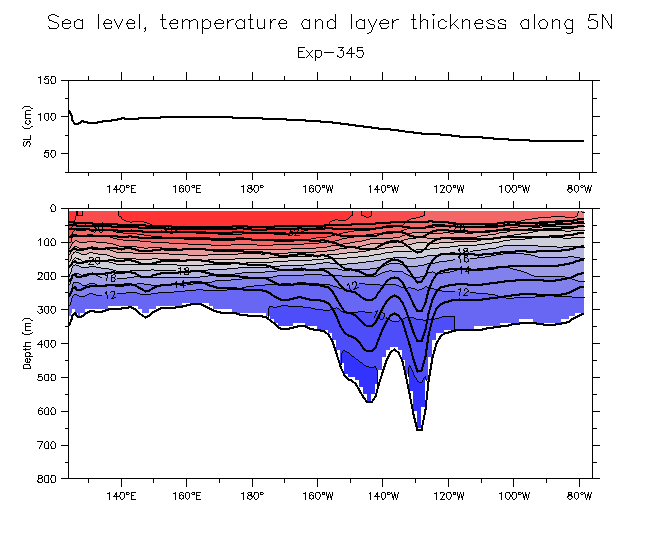
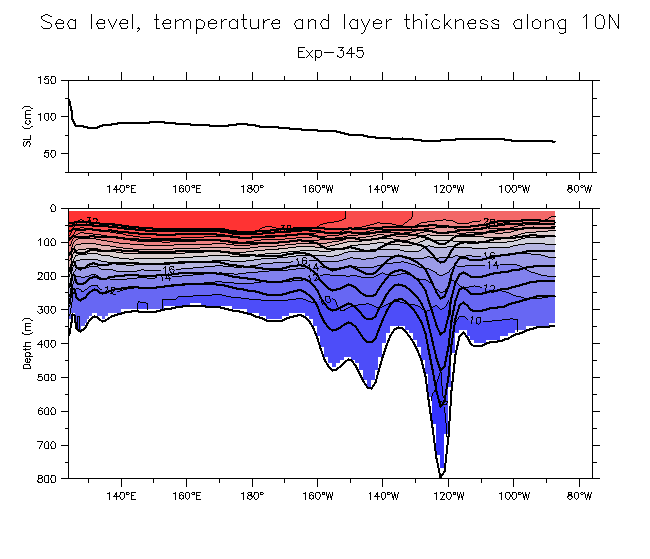
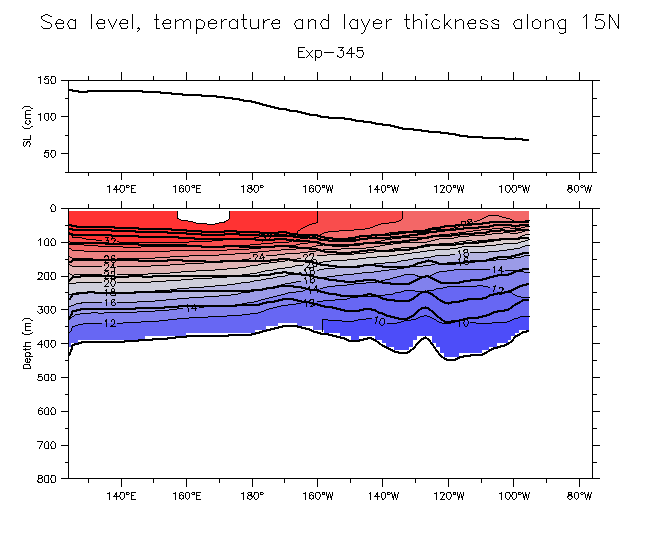
- Model mean thickness:
Maps: Thickness Sea level Overlay Bottom depth of ADCP data
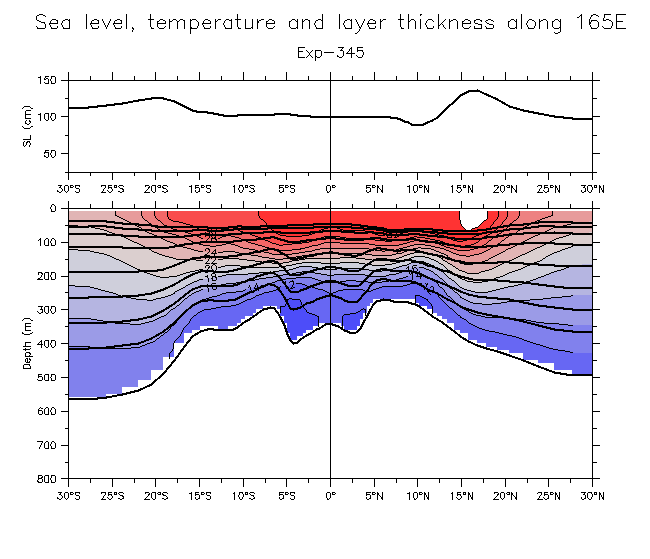
Sections: 165°E 170°W 155°W 140°W 125°W 110°W 95°W 15°S 10°S 5°S Eq 5°N 10°N 15°N
Layer thickness evolution over extended run: Sea level Thickness Thickness difference
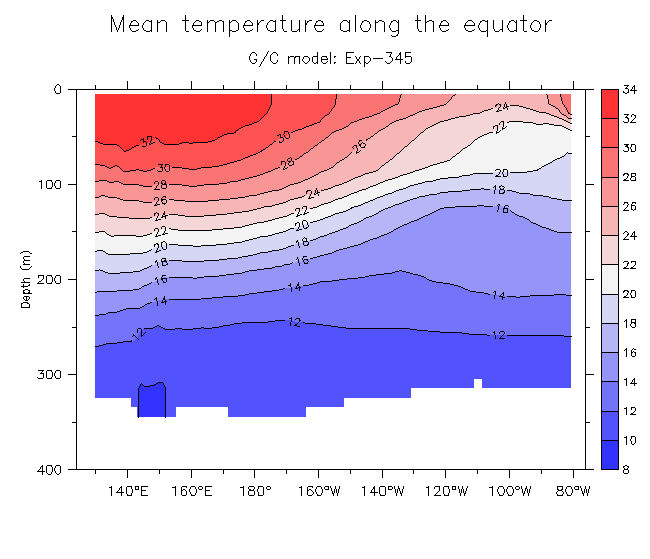
Mean T(x,z) along Equator
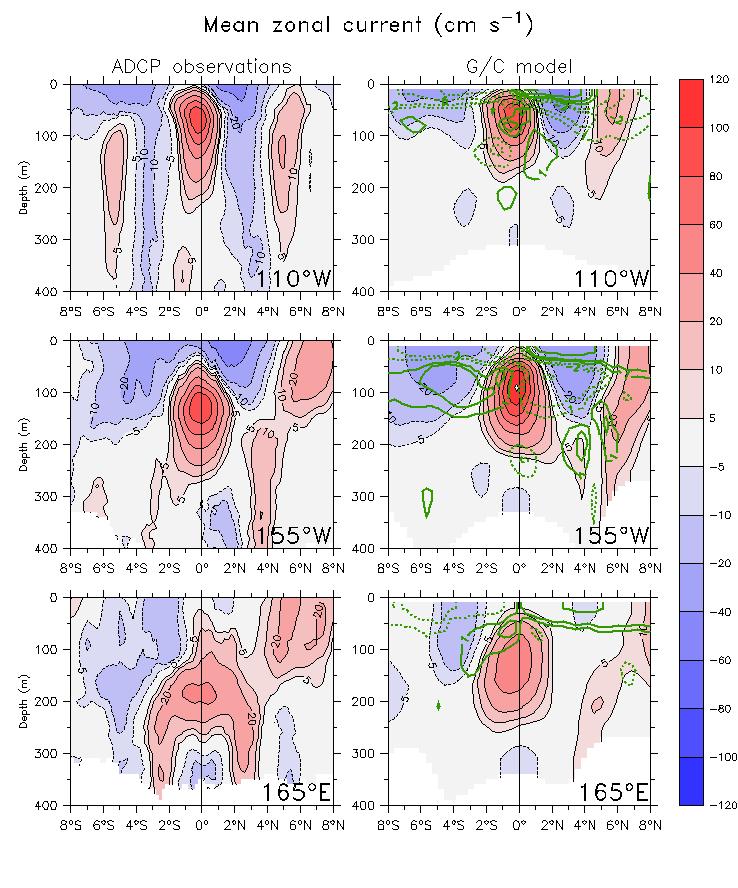
- Meridional sections of u from: Observations Model Combined Overlay v
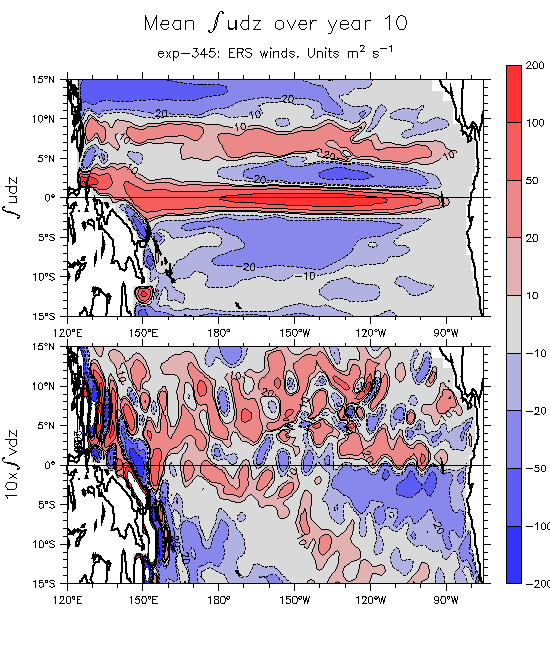
- Mean (uh) and (vh) over year 10
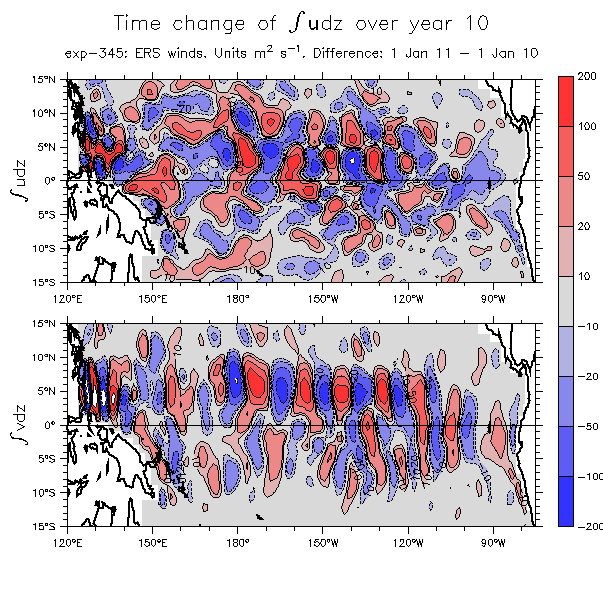
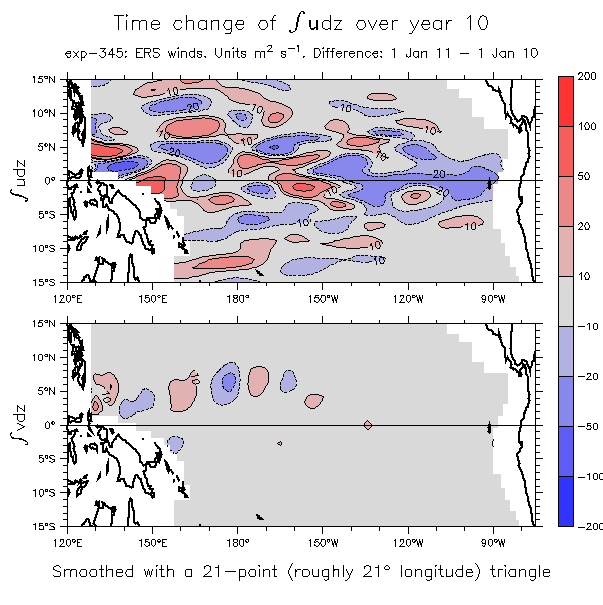
- d(uh)/dt (Smoothed) (uh) at start and end of year 10 (uh) during years 10 and 12 (Demeaned)
- Check smoothing to eliminate sharp h-wiggles near 5°N, 150°W-120°W: Before and after smoothing
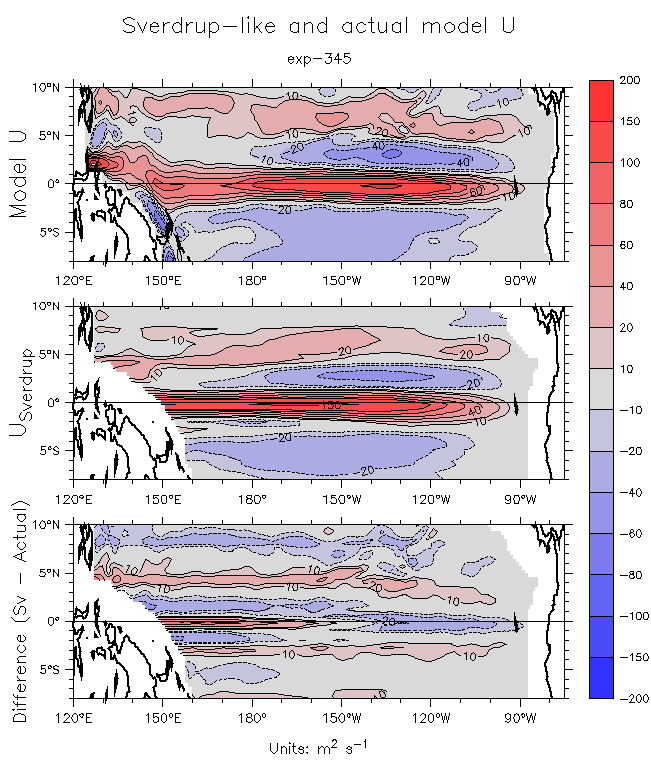
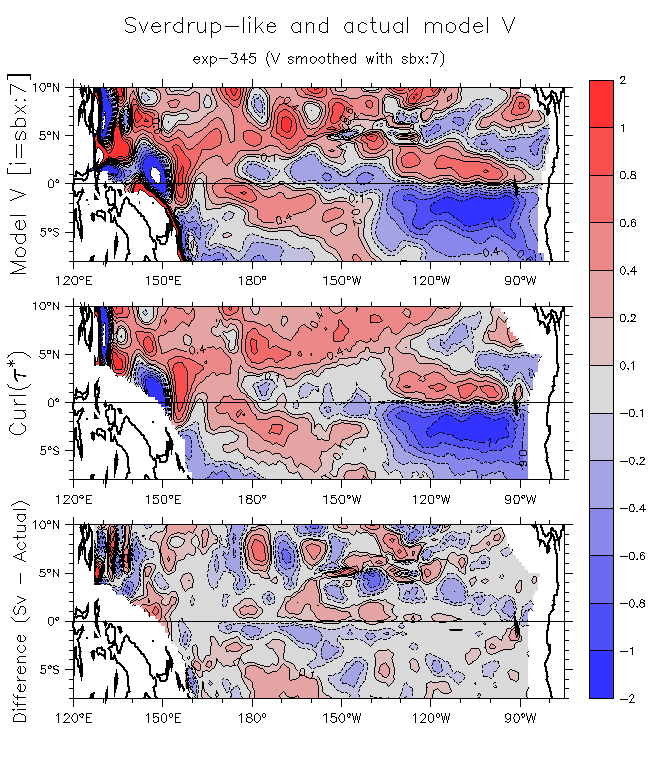
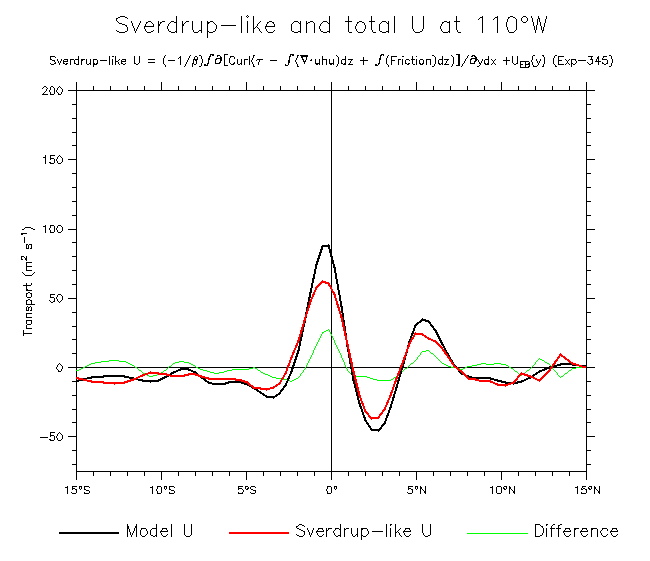
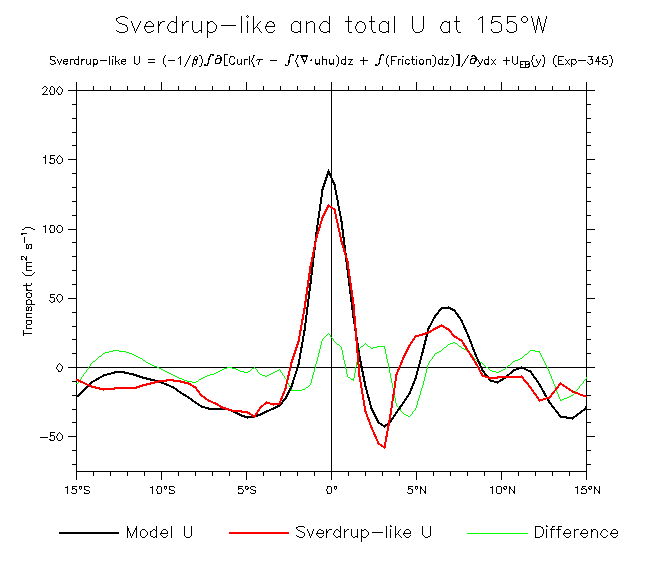
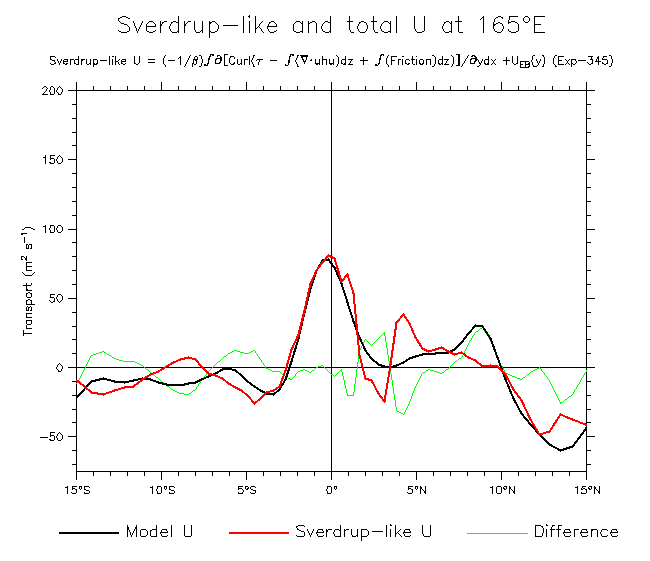
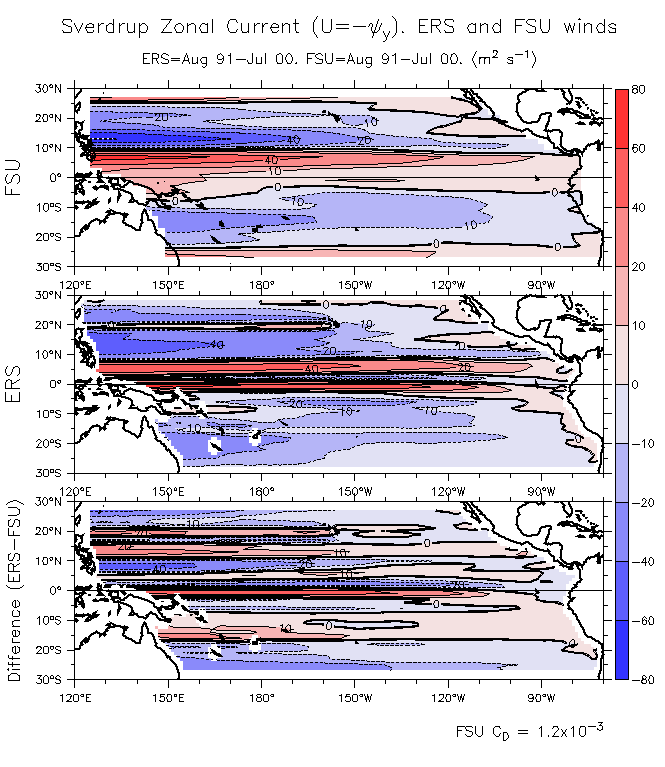
- Compare Sverdrup-like and total V U Lineplots of U: 110°W 155°W 165°E
- Does the PGF contribute to the curl? Along Eq With PGF x10 Maps (like Fig 6)
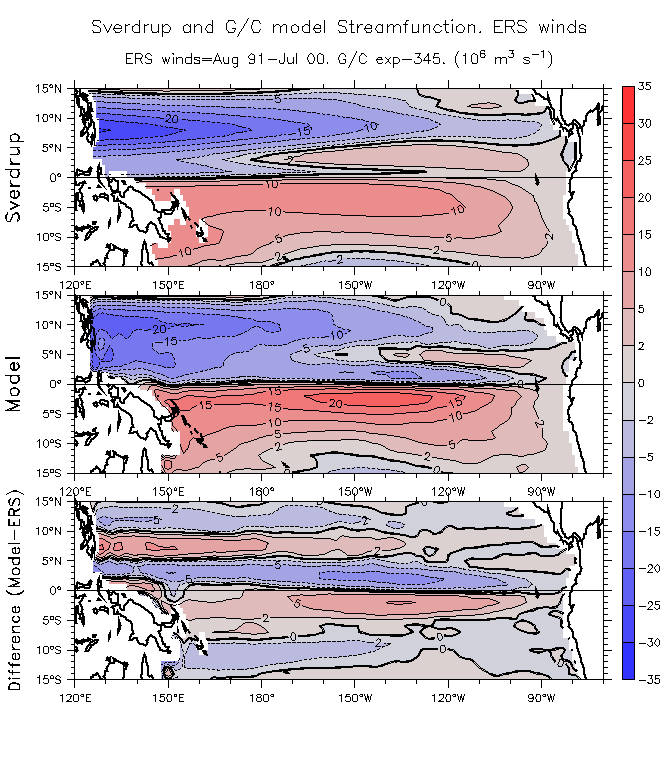
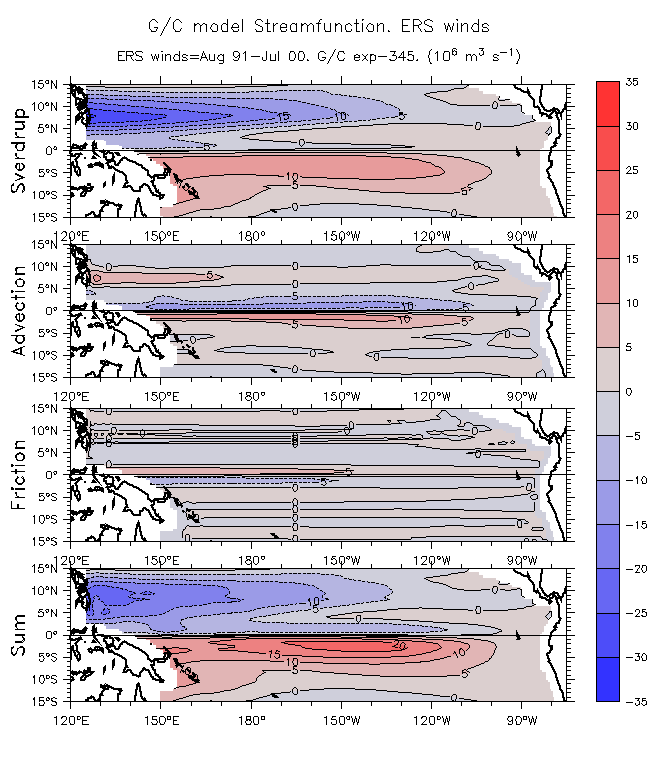
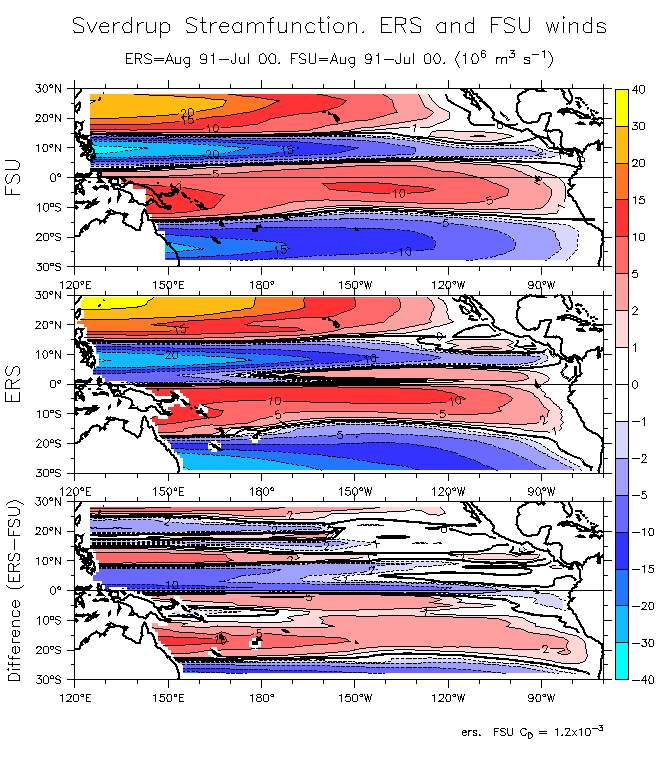
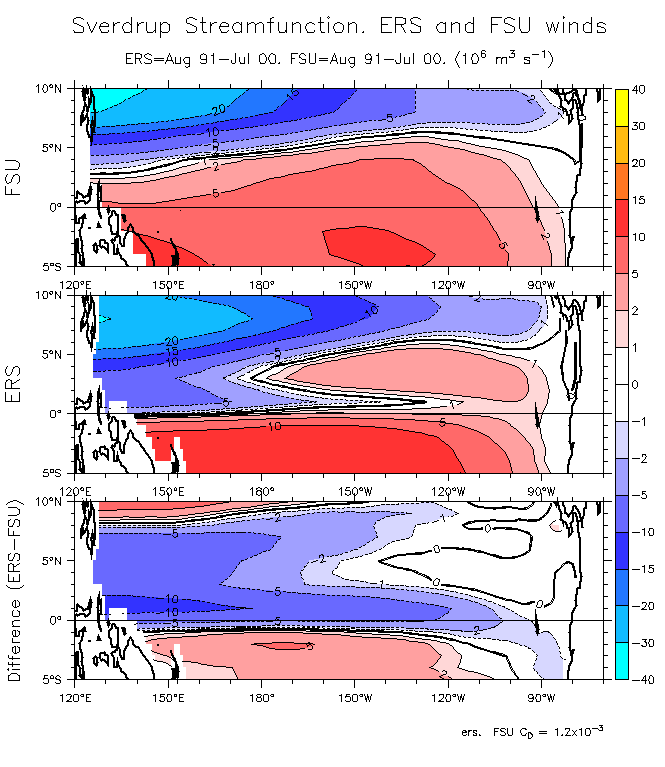
- Compare model and Sverdrup streamfunction: 15°S-15°N 8°S-10°N
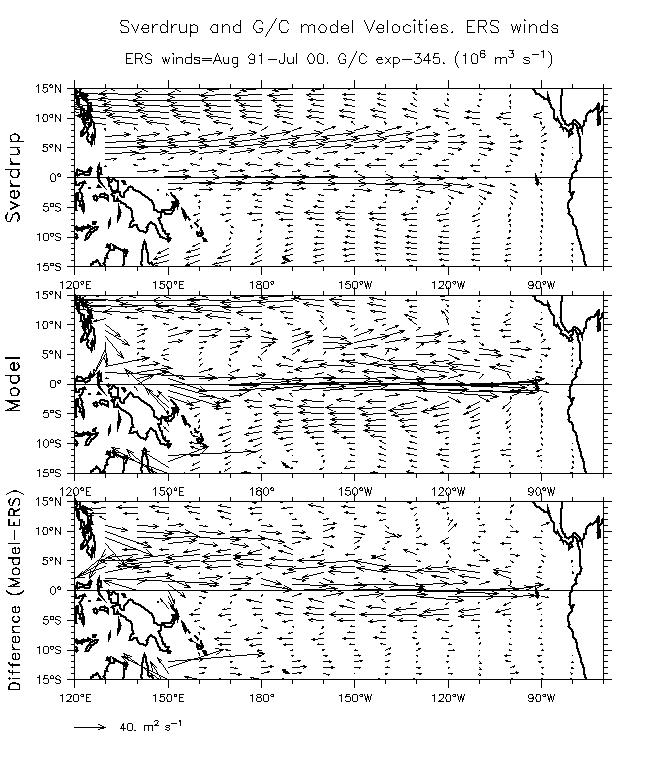
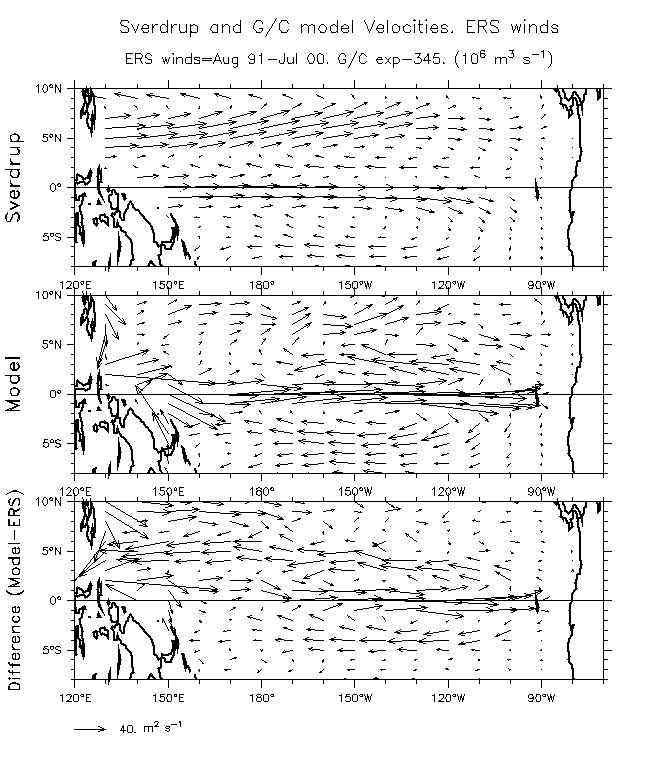
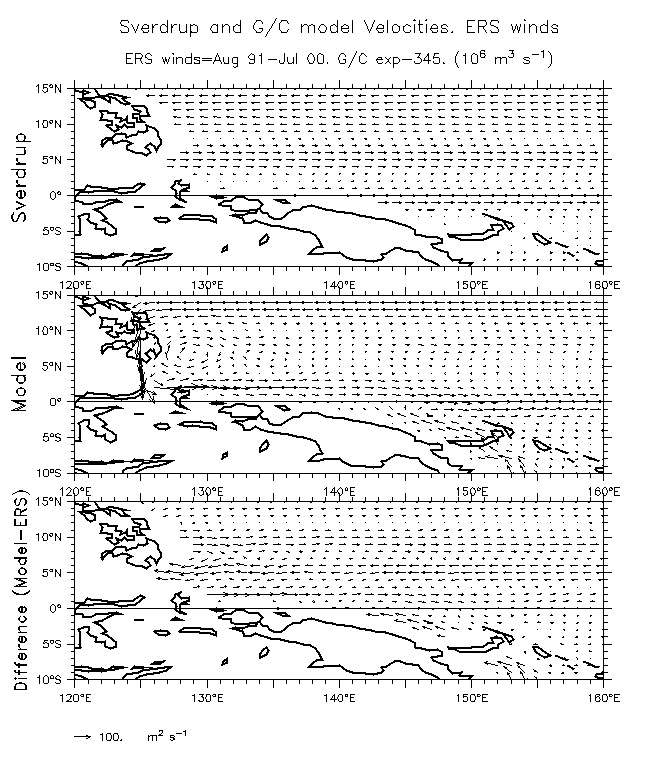
Vectors: 15°S-15°N 8°S-10°N West Pacific
Streamfunction from nonlinear and frictions "curls"(show components): 15°S-15°N
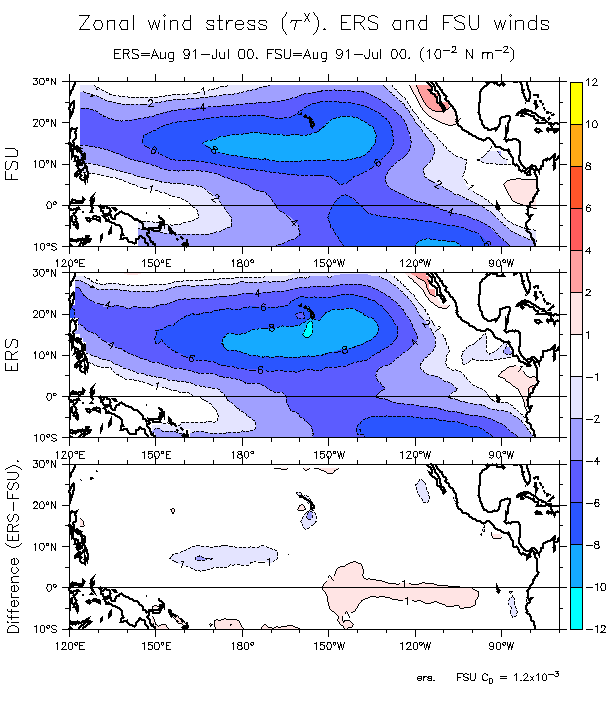
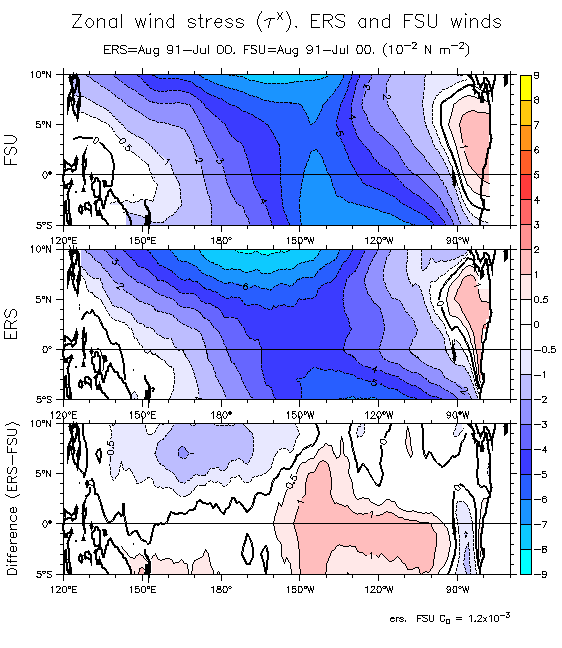
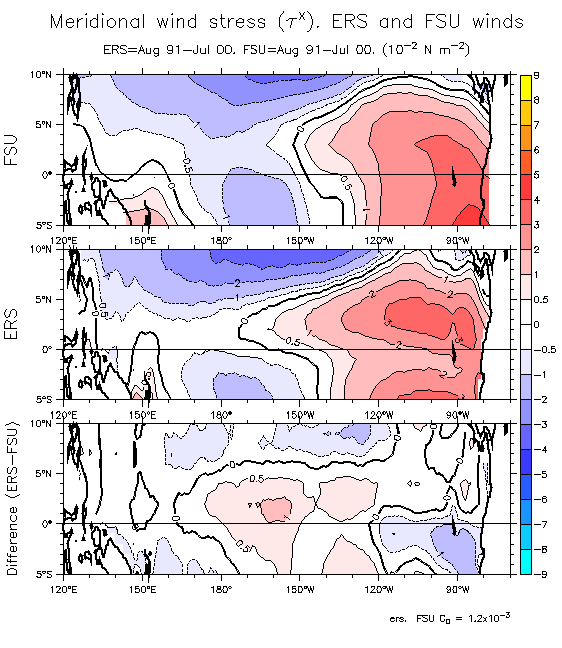
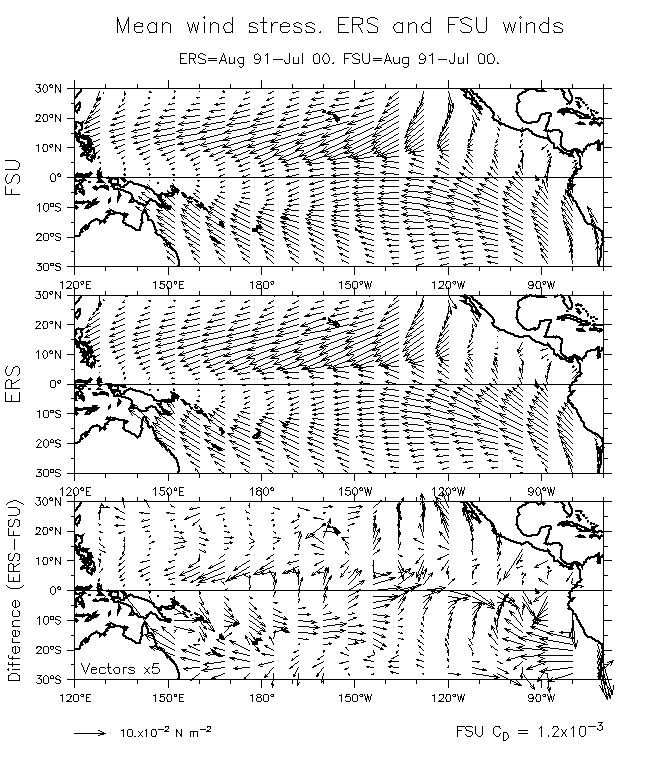
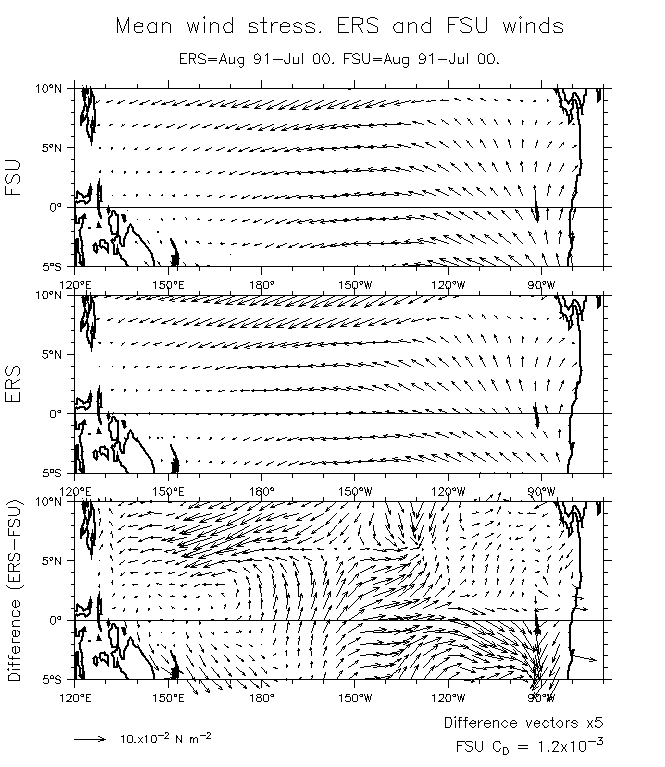
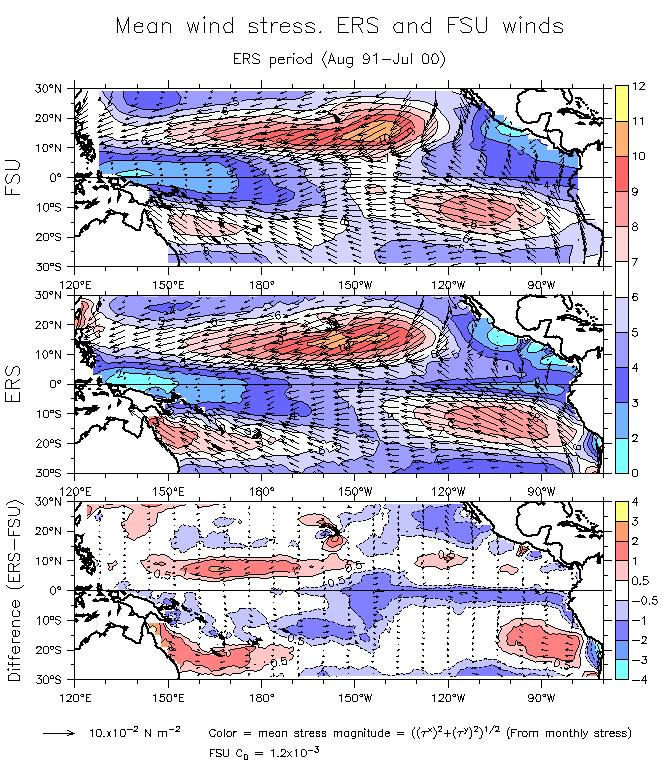
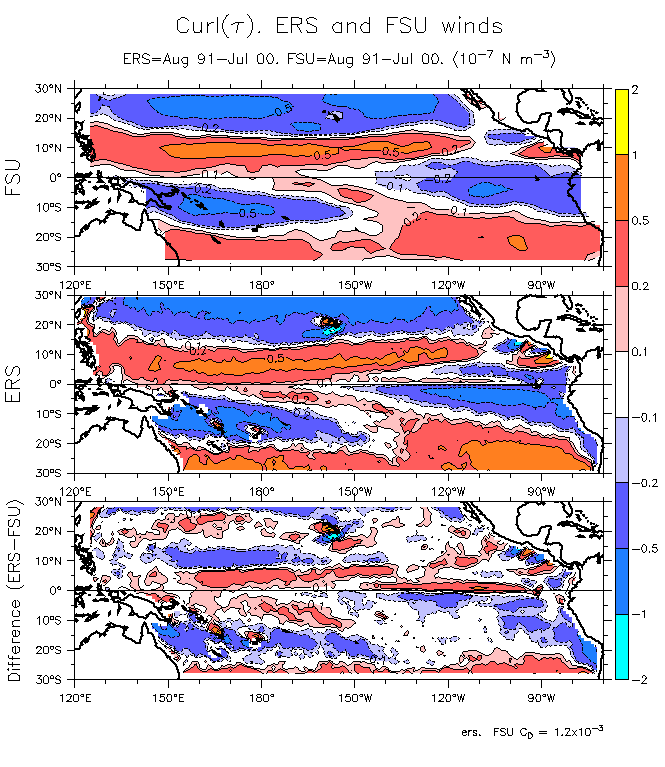
- Comparisons with FSU:
- Tau-x (Near-Eq)
- Tauy (Near-Eq)
- Vector Tau (Near-Eq) (With stress magnitude)
- Curl (Near-Eq)
- Streamfunction (Near-Eq)
- Sverdrup U (Near-Eq)
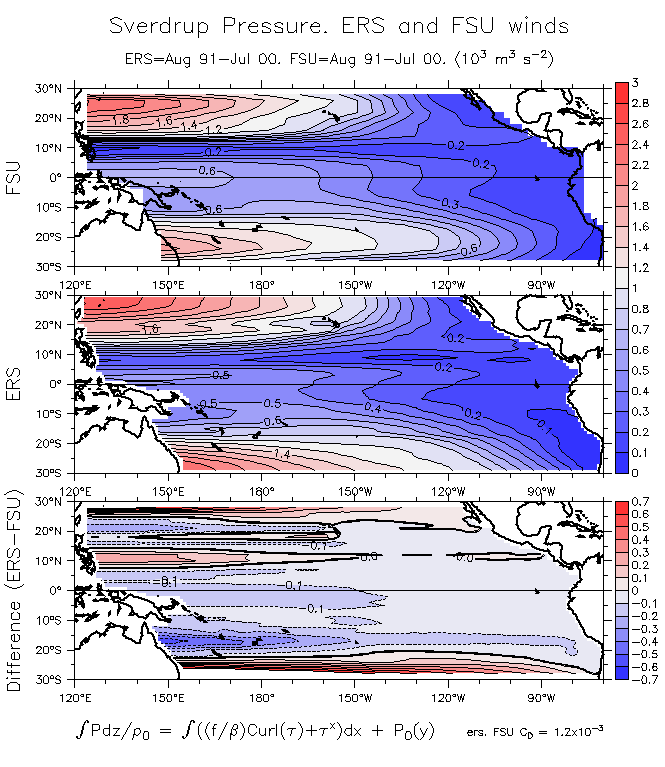
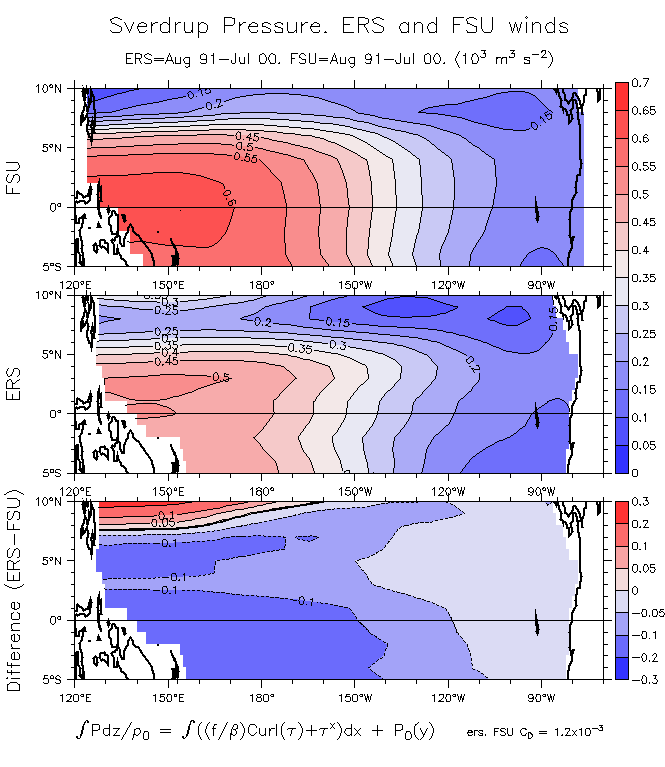
- Sverdrup P (Near-Eq)
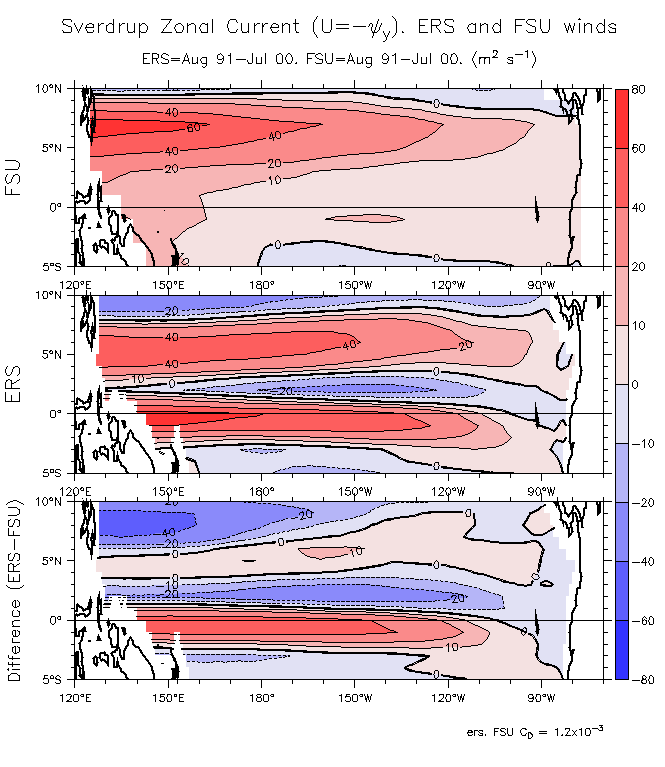
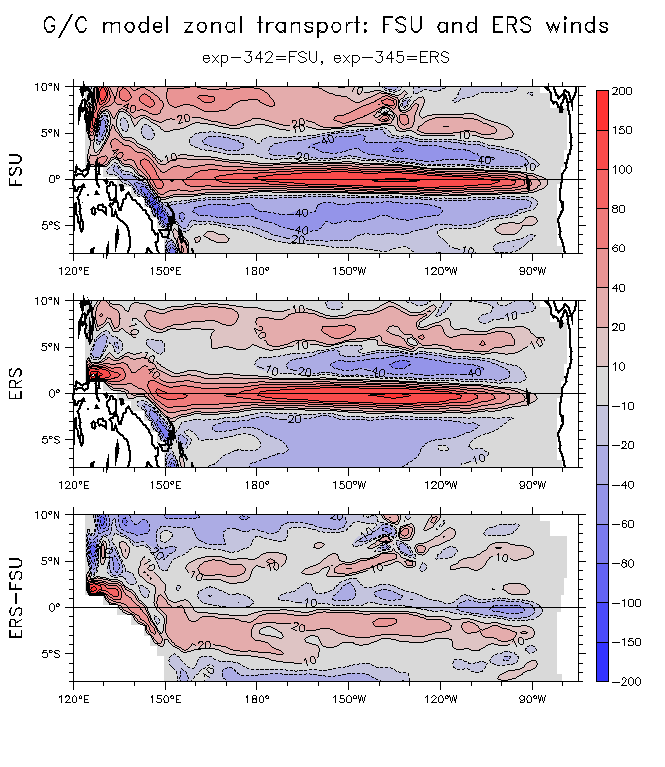
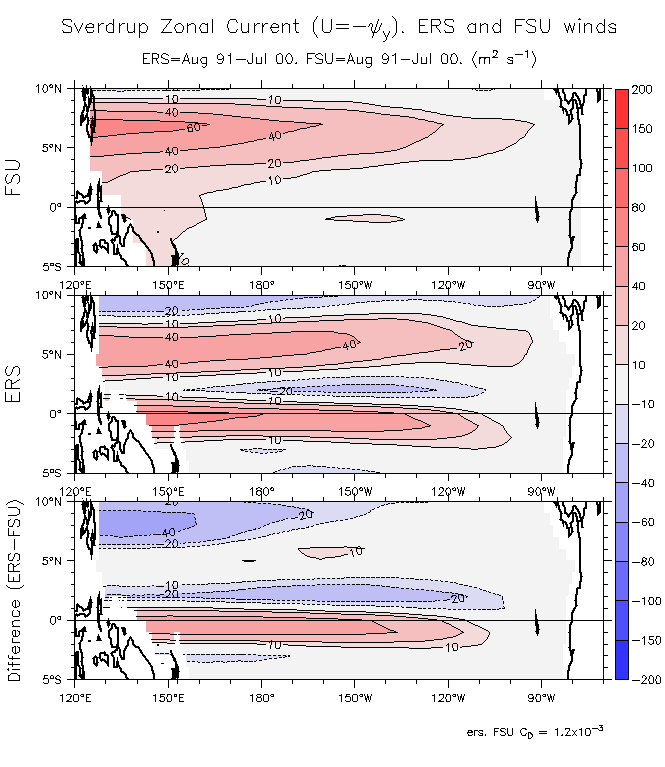
- Model and Sverdrup U vs Obs FSU and ERS Model U FSU and ERS Sverdrup U
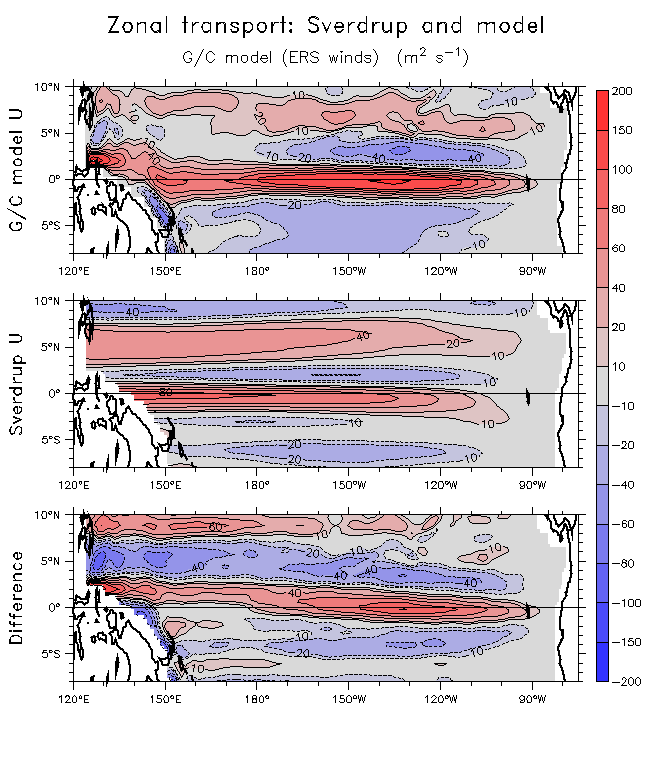
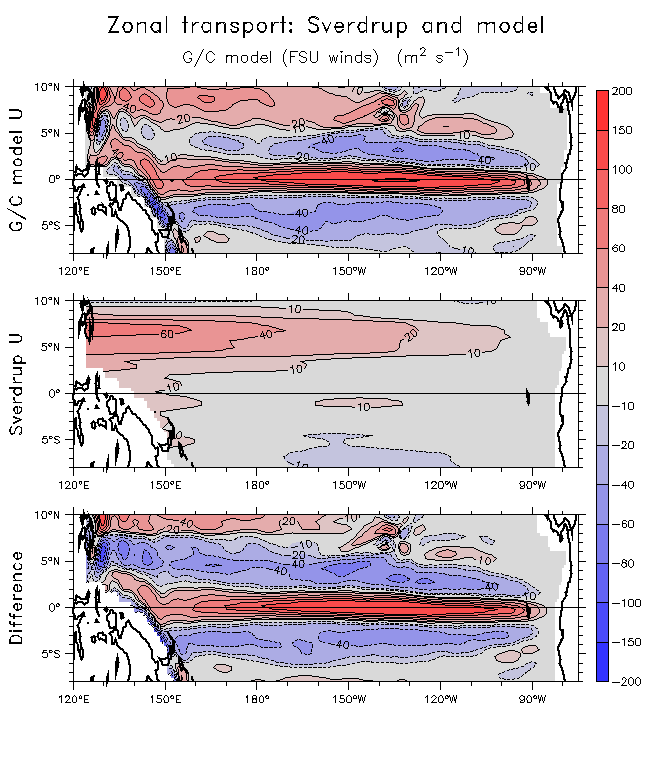
- Difference model vs Sverdrup U: ERS winds FSU winds
- Model transport of zonal currents
- Model zonal pressure gradients
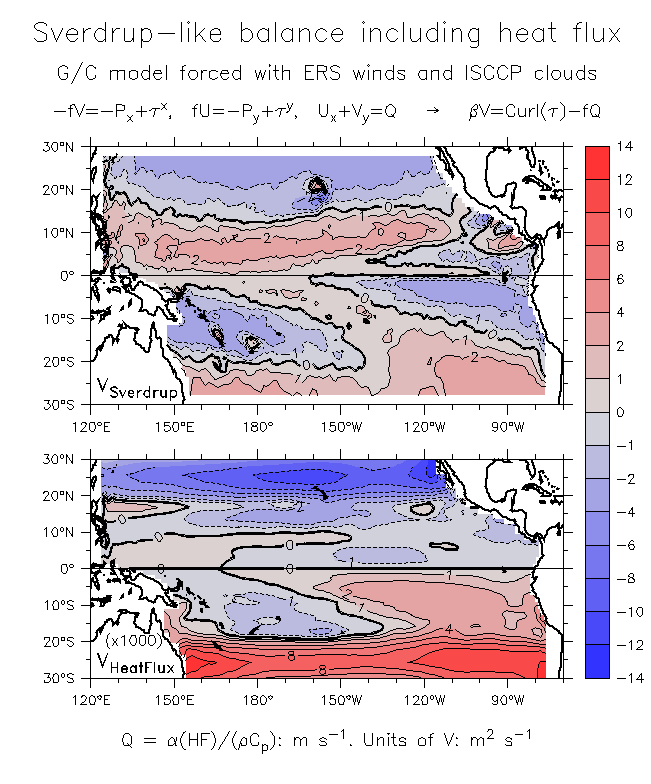
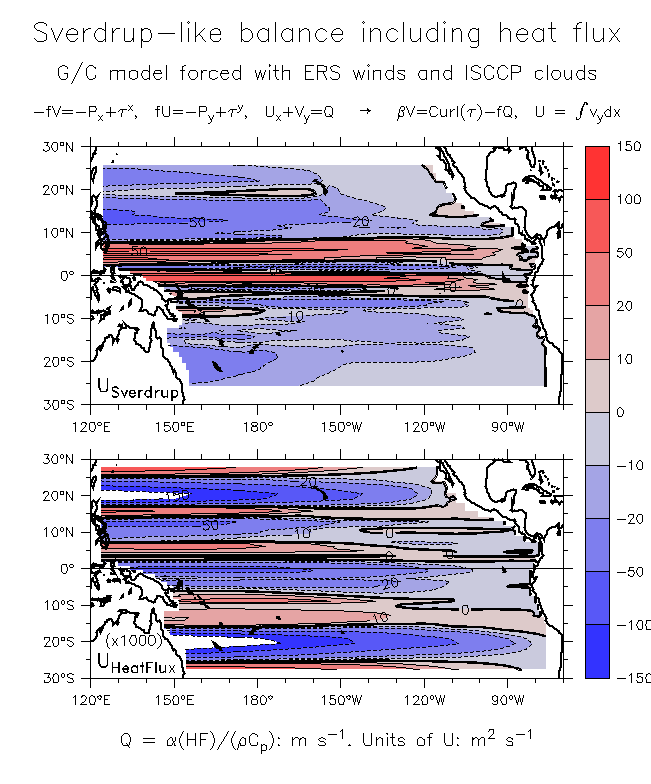
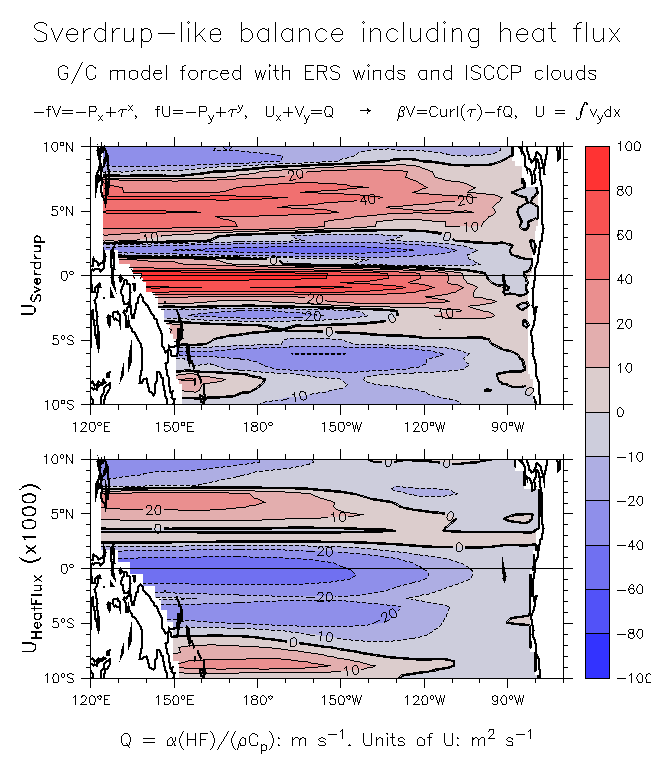
What about the effect of heat flux on the Sverdrup balance?
As in Stommel's "Goldsbrough variations", suppose the continuity equation was Del dot U = Q, and carry through the same manipulations to get the Sverdrup balance:

Bottom line is that the VQ and UQ term is 100 to 1000 times smaller than the Sverdrup term.
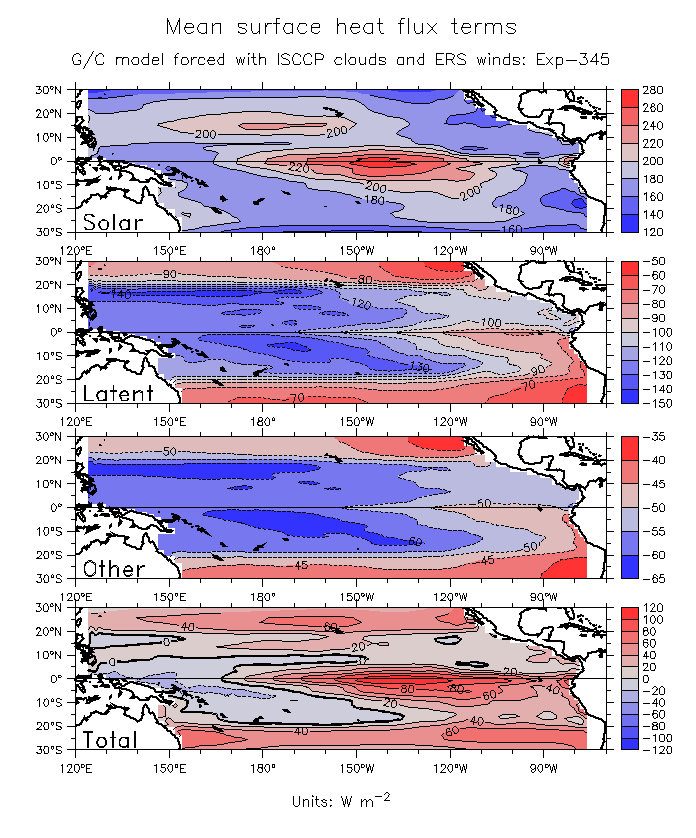
- Surface heat flux
- V
- U 30°S-30°N 10°S-10°N
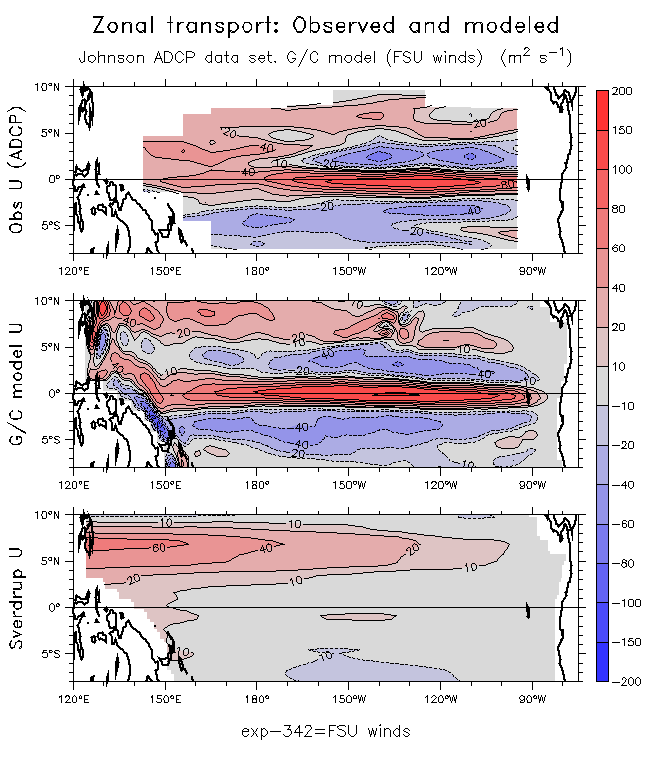
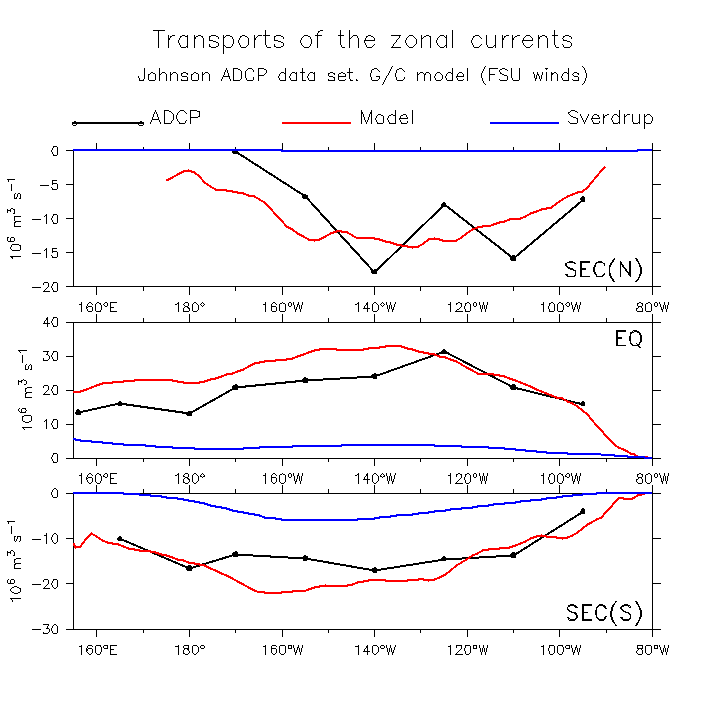
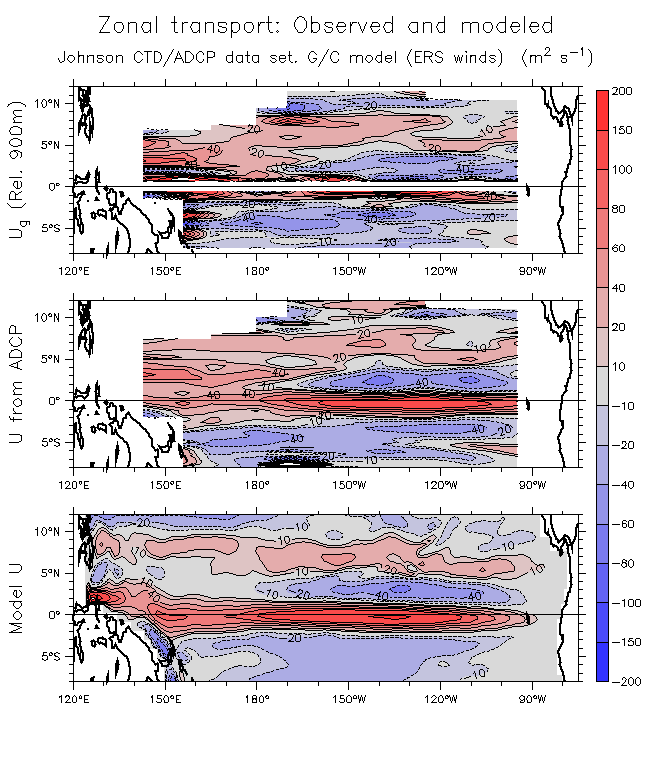
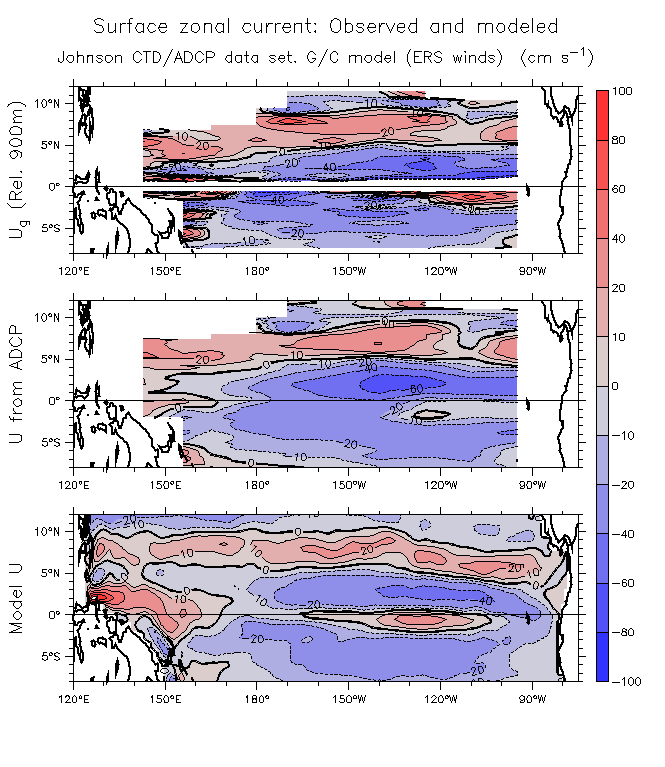
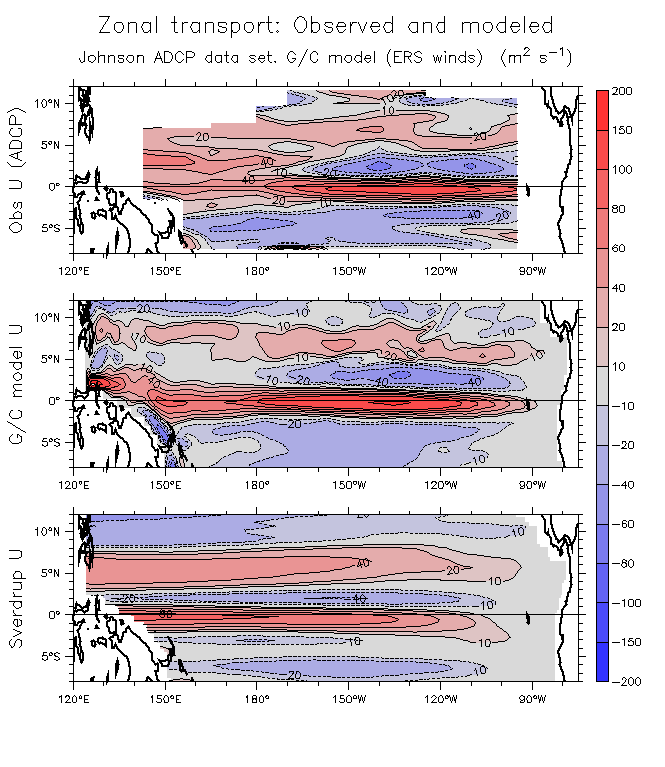
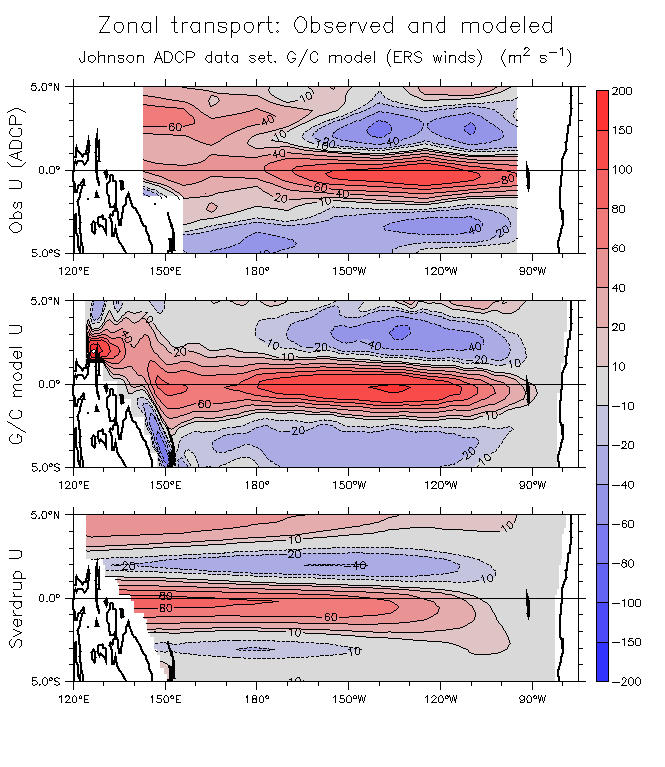
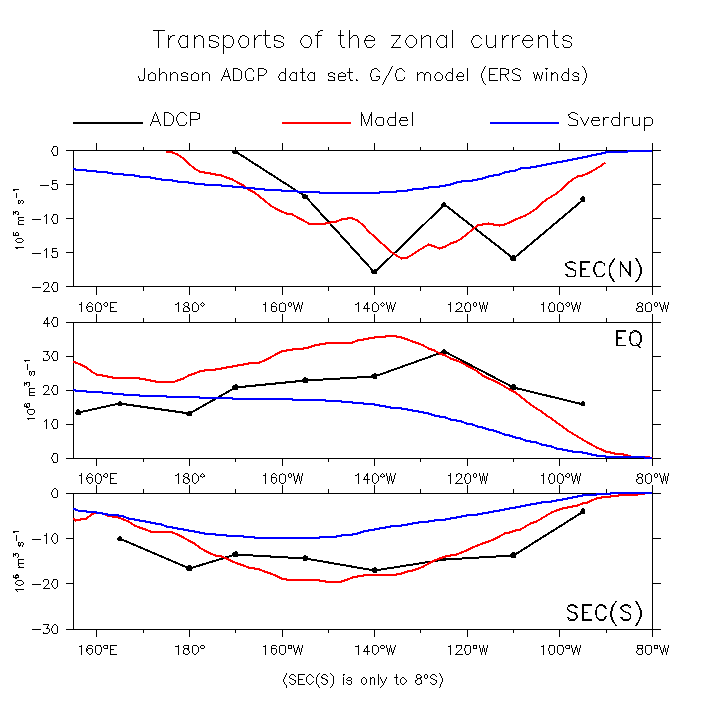
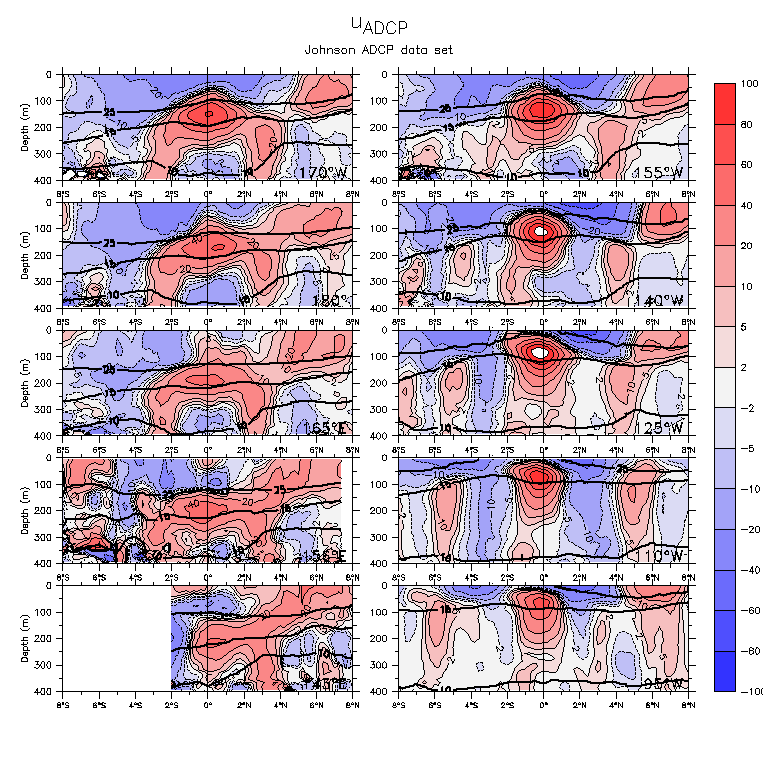
Compare model and observed (Johnson) zonal transport:
- Transport: Ug, U from ADCP, Model U
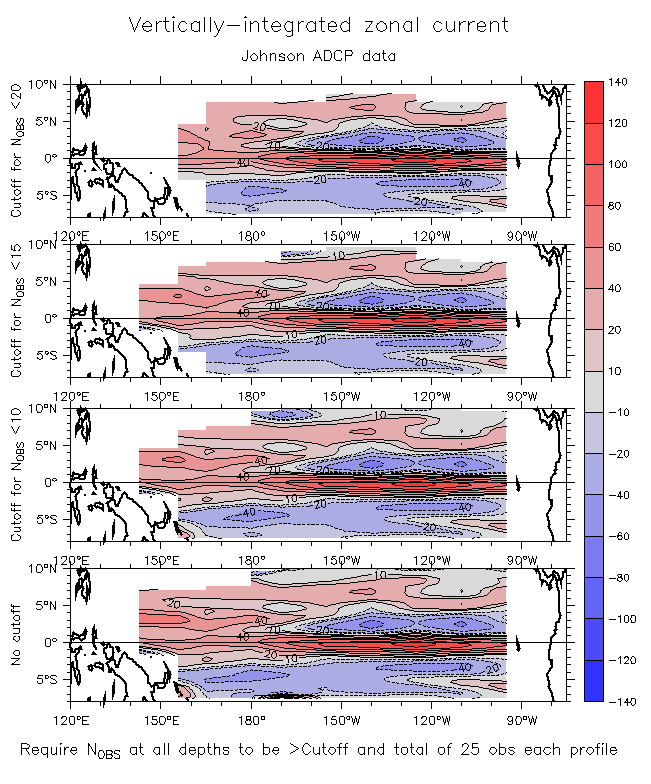
Check ADCP transport by Nobs cutoff
- Surface current: Ug, U from ADCP, Model U
- ADCP, Model, Sverdrup U: 8°S-12°N 5°S-5°N
- ADCP, Model, Sverdrup transports of the zonal currents Modern version
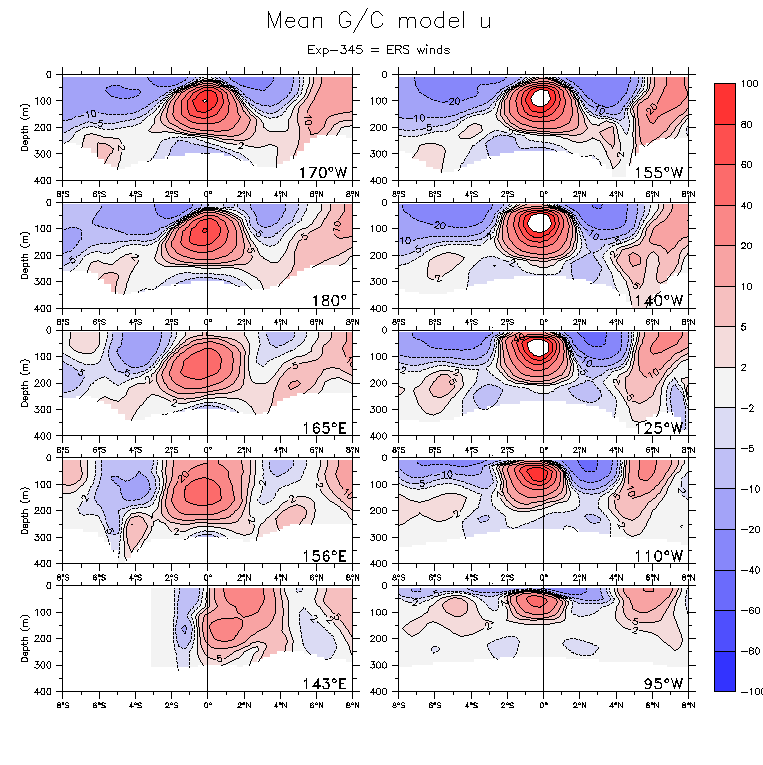
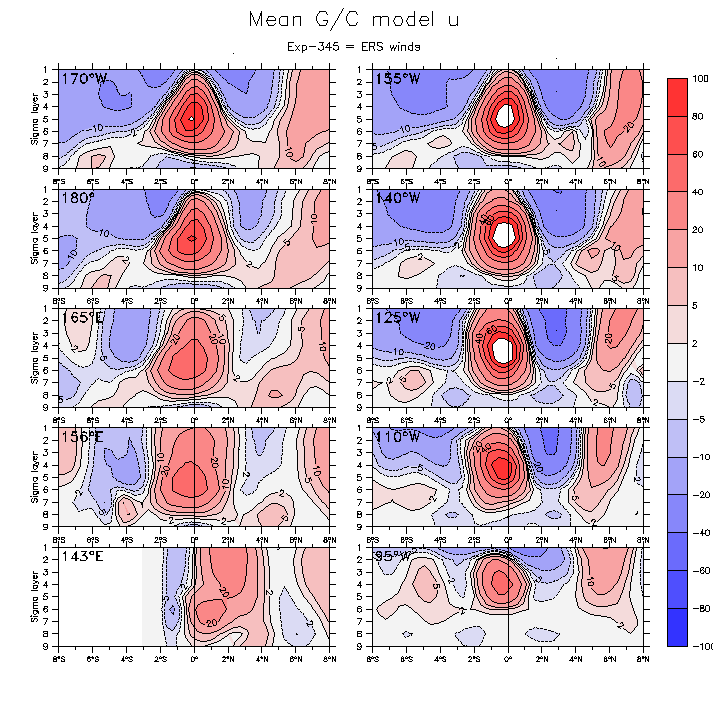
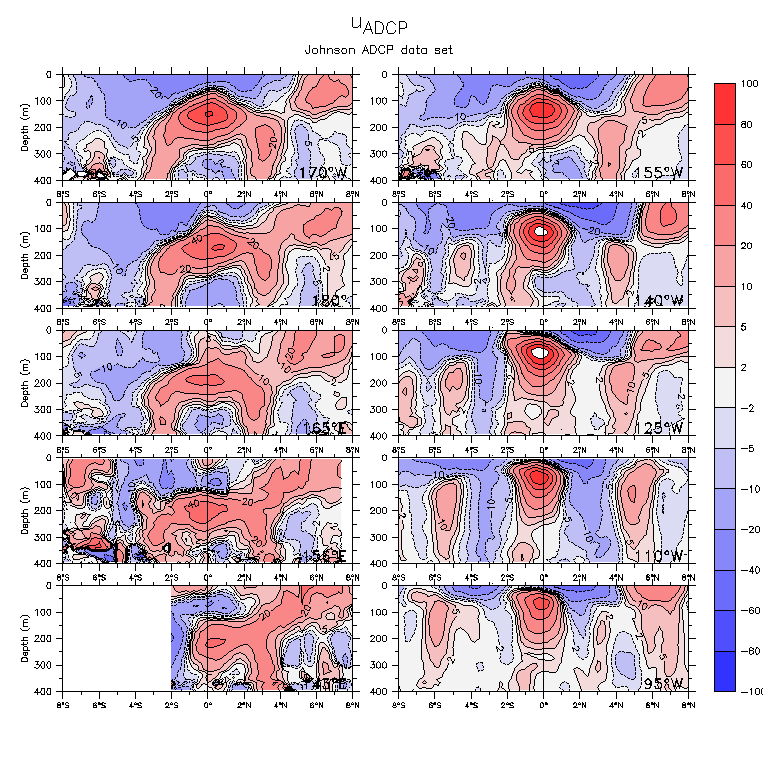
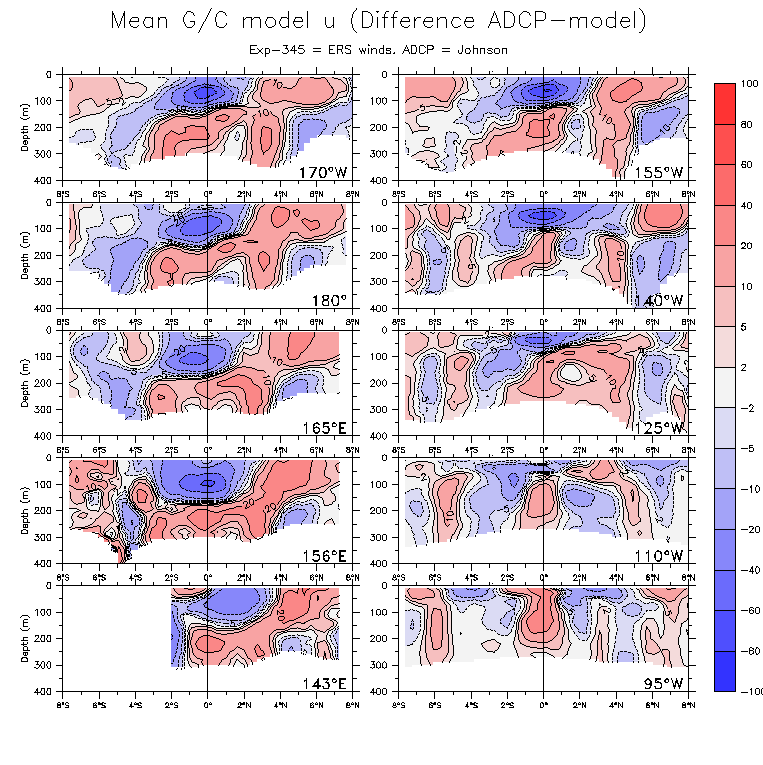
- Meridional u sections:
- Model (on z) Model (on sigma levels) Obs ADCP Difference
- Overlay isotherms: Model Obs ADCP
- Compare FSU winds: Model (on z) Difference ERS - FSU
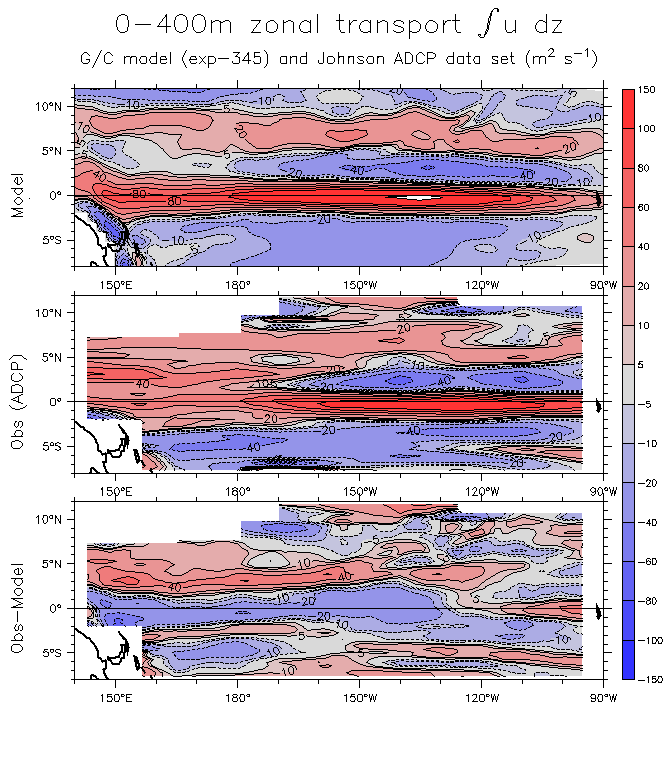
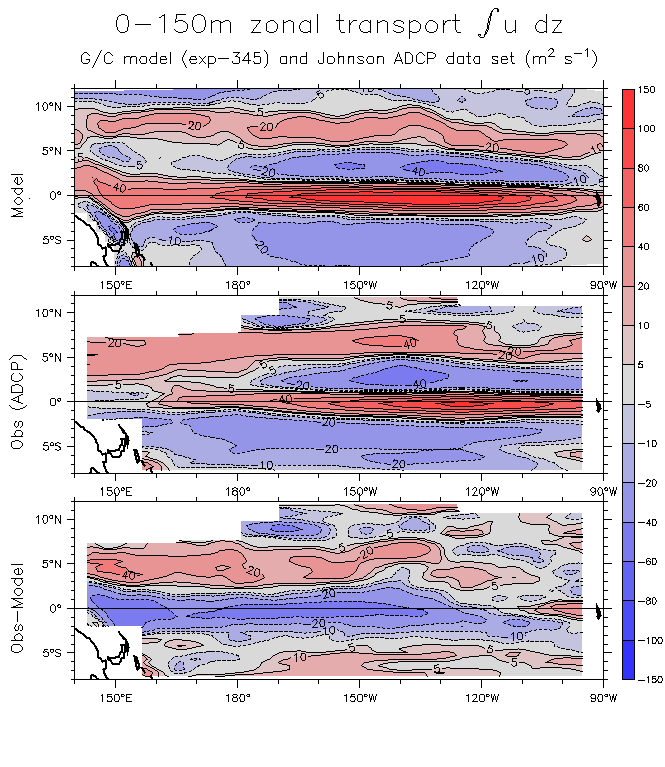
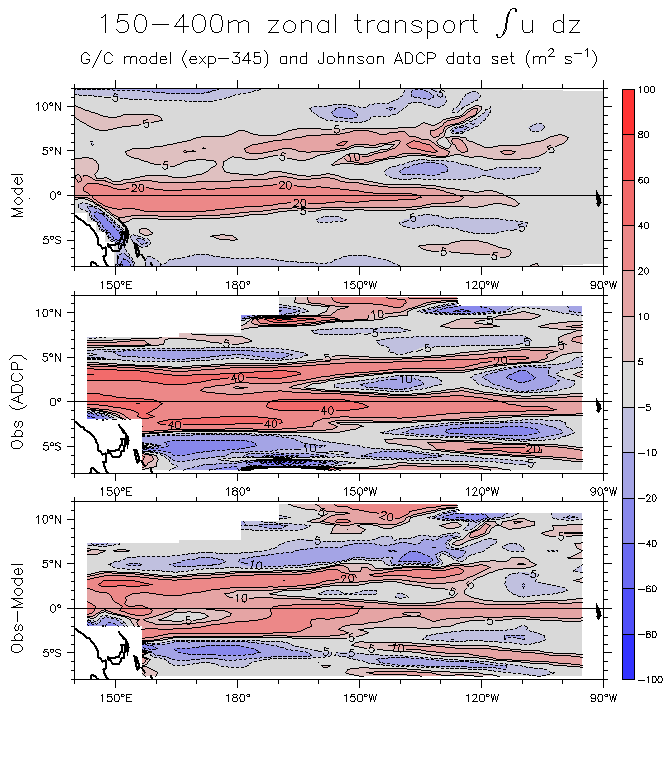
- Integrated transport comparison: 0-400m 0-150m 150-400m
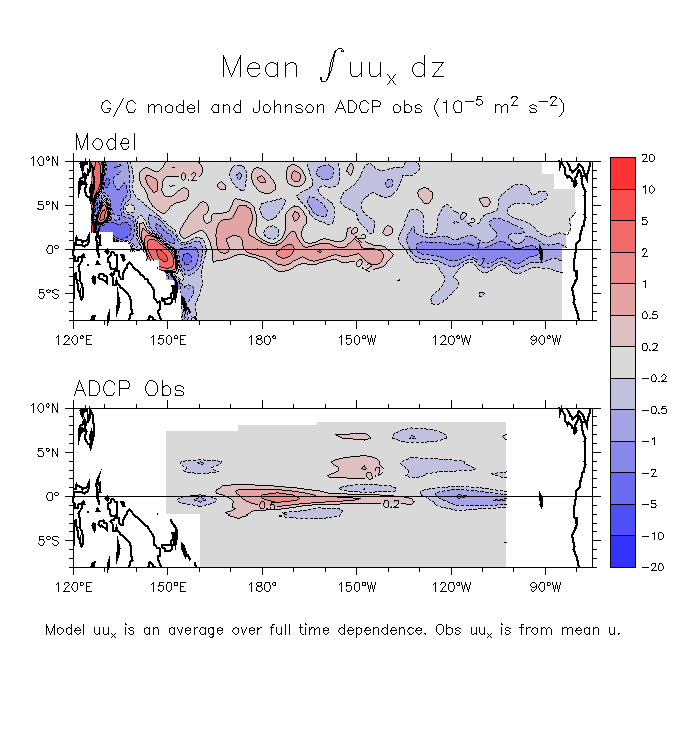
- uux from model and ADCP obs
Back to the main Sverdrup page
Work with the Johnson CTD/ADCP data set
Paper figures
Slides for talk
Extended run page