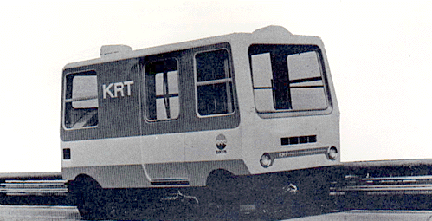
KRT - New Transportation System
 The
Kobe Personal Rapid Transit (KRT) project was a joint endeavor of Nissho_Iwai and
Kobe Steel, Ltd. It was conducted in the early 1970's in Japan and was carried through a
complete development, testing and deployment cycle. It was designed to satisfy, as closely
as possible, the following nine objectives:
1. Blend in with the environment
2. Be available 18 hours per day
3. Be available without much waiting for passengers
4. Have a low fare or be free
5. Be quiet, safe and non-polluting
6. Allow easy maintenance and coupling
7. Be capable of carrying freight
8. Run about twice as fast as average current urban transport
9. Provide an enjoyable ride for passengers
It was a software-oriented automated transport system with small vehicles operating
under computer control. It was built and operated at a 1975 International Ocean Exposition
in Okinawa and carried around 5 million passengers during the Exposition. The route length
was about 3 km it had a curve with a 9 m radius and operated over grades of 8%. Sixteen
air-condition vehicles were provided with each vehicle having a capacity of 23 passengers
(8 seated, 15 standing). Three stations were provided. Maximum capacity was 30 persons.
The technology was developed at a test track at Shinko Electric Company in
Toyohashi. It had a length of about 1 km, a maximum grade of 8% and a minimum curve radius
of 9 m. Figure 1 is an
annotated diagram that shows most of the details of the KRT vehicle. Figure 2 describes several
station design concepts and Figure
3 shows the four main guideway configurations that were planned.
Illustrations of possible KRT applications are provided in Figures 4-6. Figure 4 illustrates how KRT
could serve a residential area by providing frequent service to nearby mass transit
stations. Figure 5 shows
how KRT might be used to connect urban locations with nearby recreational areas. Figure 6 depicts a business
district application that provides easy access to mass transit facilities, parking areas
and nearby buildings.
Comparisons between KRT and conventional transit modes (busses and heavy rail like
BART) are given in Figure 7,
using eight criteria. Cost comparisons are provided in Figure 8. Labor costs are
estimated to be reduced by a factor of 10. Some possible future developments in the
technology are described in
Figure 9, including a dualmode option, a family of vehicle types, automated
maintenance diagnosis and cycling, air pad and magnetic levitation and linear induction
motor options.
Figure 10 is a
system planning diagram that shows the comprehensive approach that was contemplated at
that time. It is highly similar to system analyses studies being done today (nearly 25
years later). This flow diagram is supplemented with a more specific technology
development and deployment diagram (Figure 11) that shows the
how well the persons managing this project understood the complex and interdisciplinary
nature of the work they were engaged in. Urban form, politics, psychology, community
relations, architecture were some of the disciplines that were to be involved at the
beginning, according to this diagram.
The reasons why this project was terminated in the late 1970s are not known. If anyone
has some information on this topic, they are invited to send it to J. Schneider for inclusion on this page.
Last modified: August 09, 1998
 The
Kobe Personal Rapid Transit (KRT) project was a joint endeavor of Nissho_Iwai and
Kobe Steel, Ltd. It was conducted in the early 1970's in Japan and was carried through a
complete development, testing and deployment cycle. It was designed to satisfy, as closely
as possible, the following nine objectives: