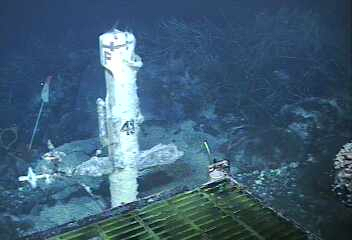
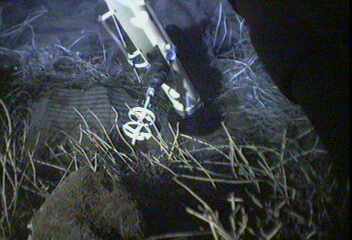
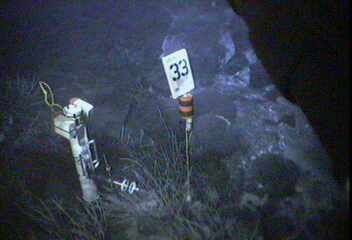
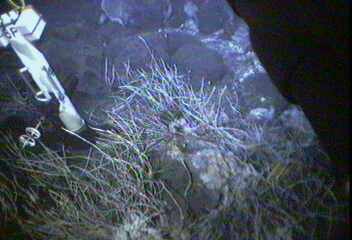
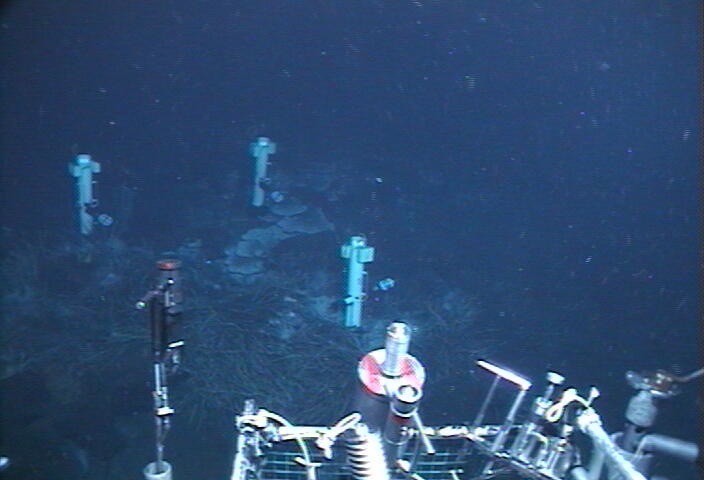
This group of instruments was all deployed within a few meters of each other in a diffuse vent site near the black smoker "Easter Island".
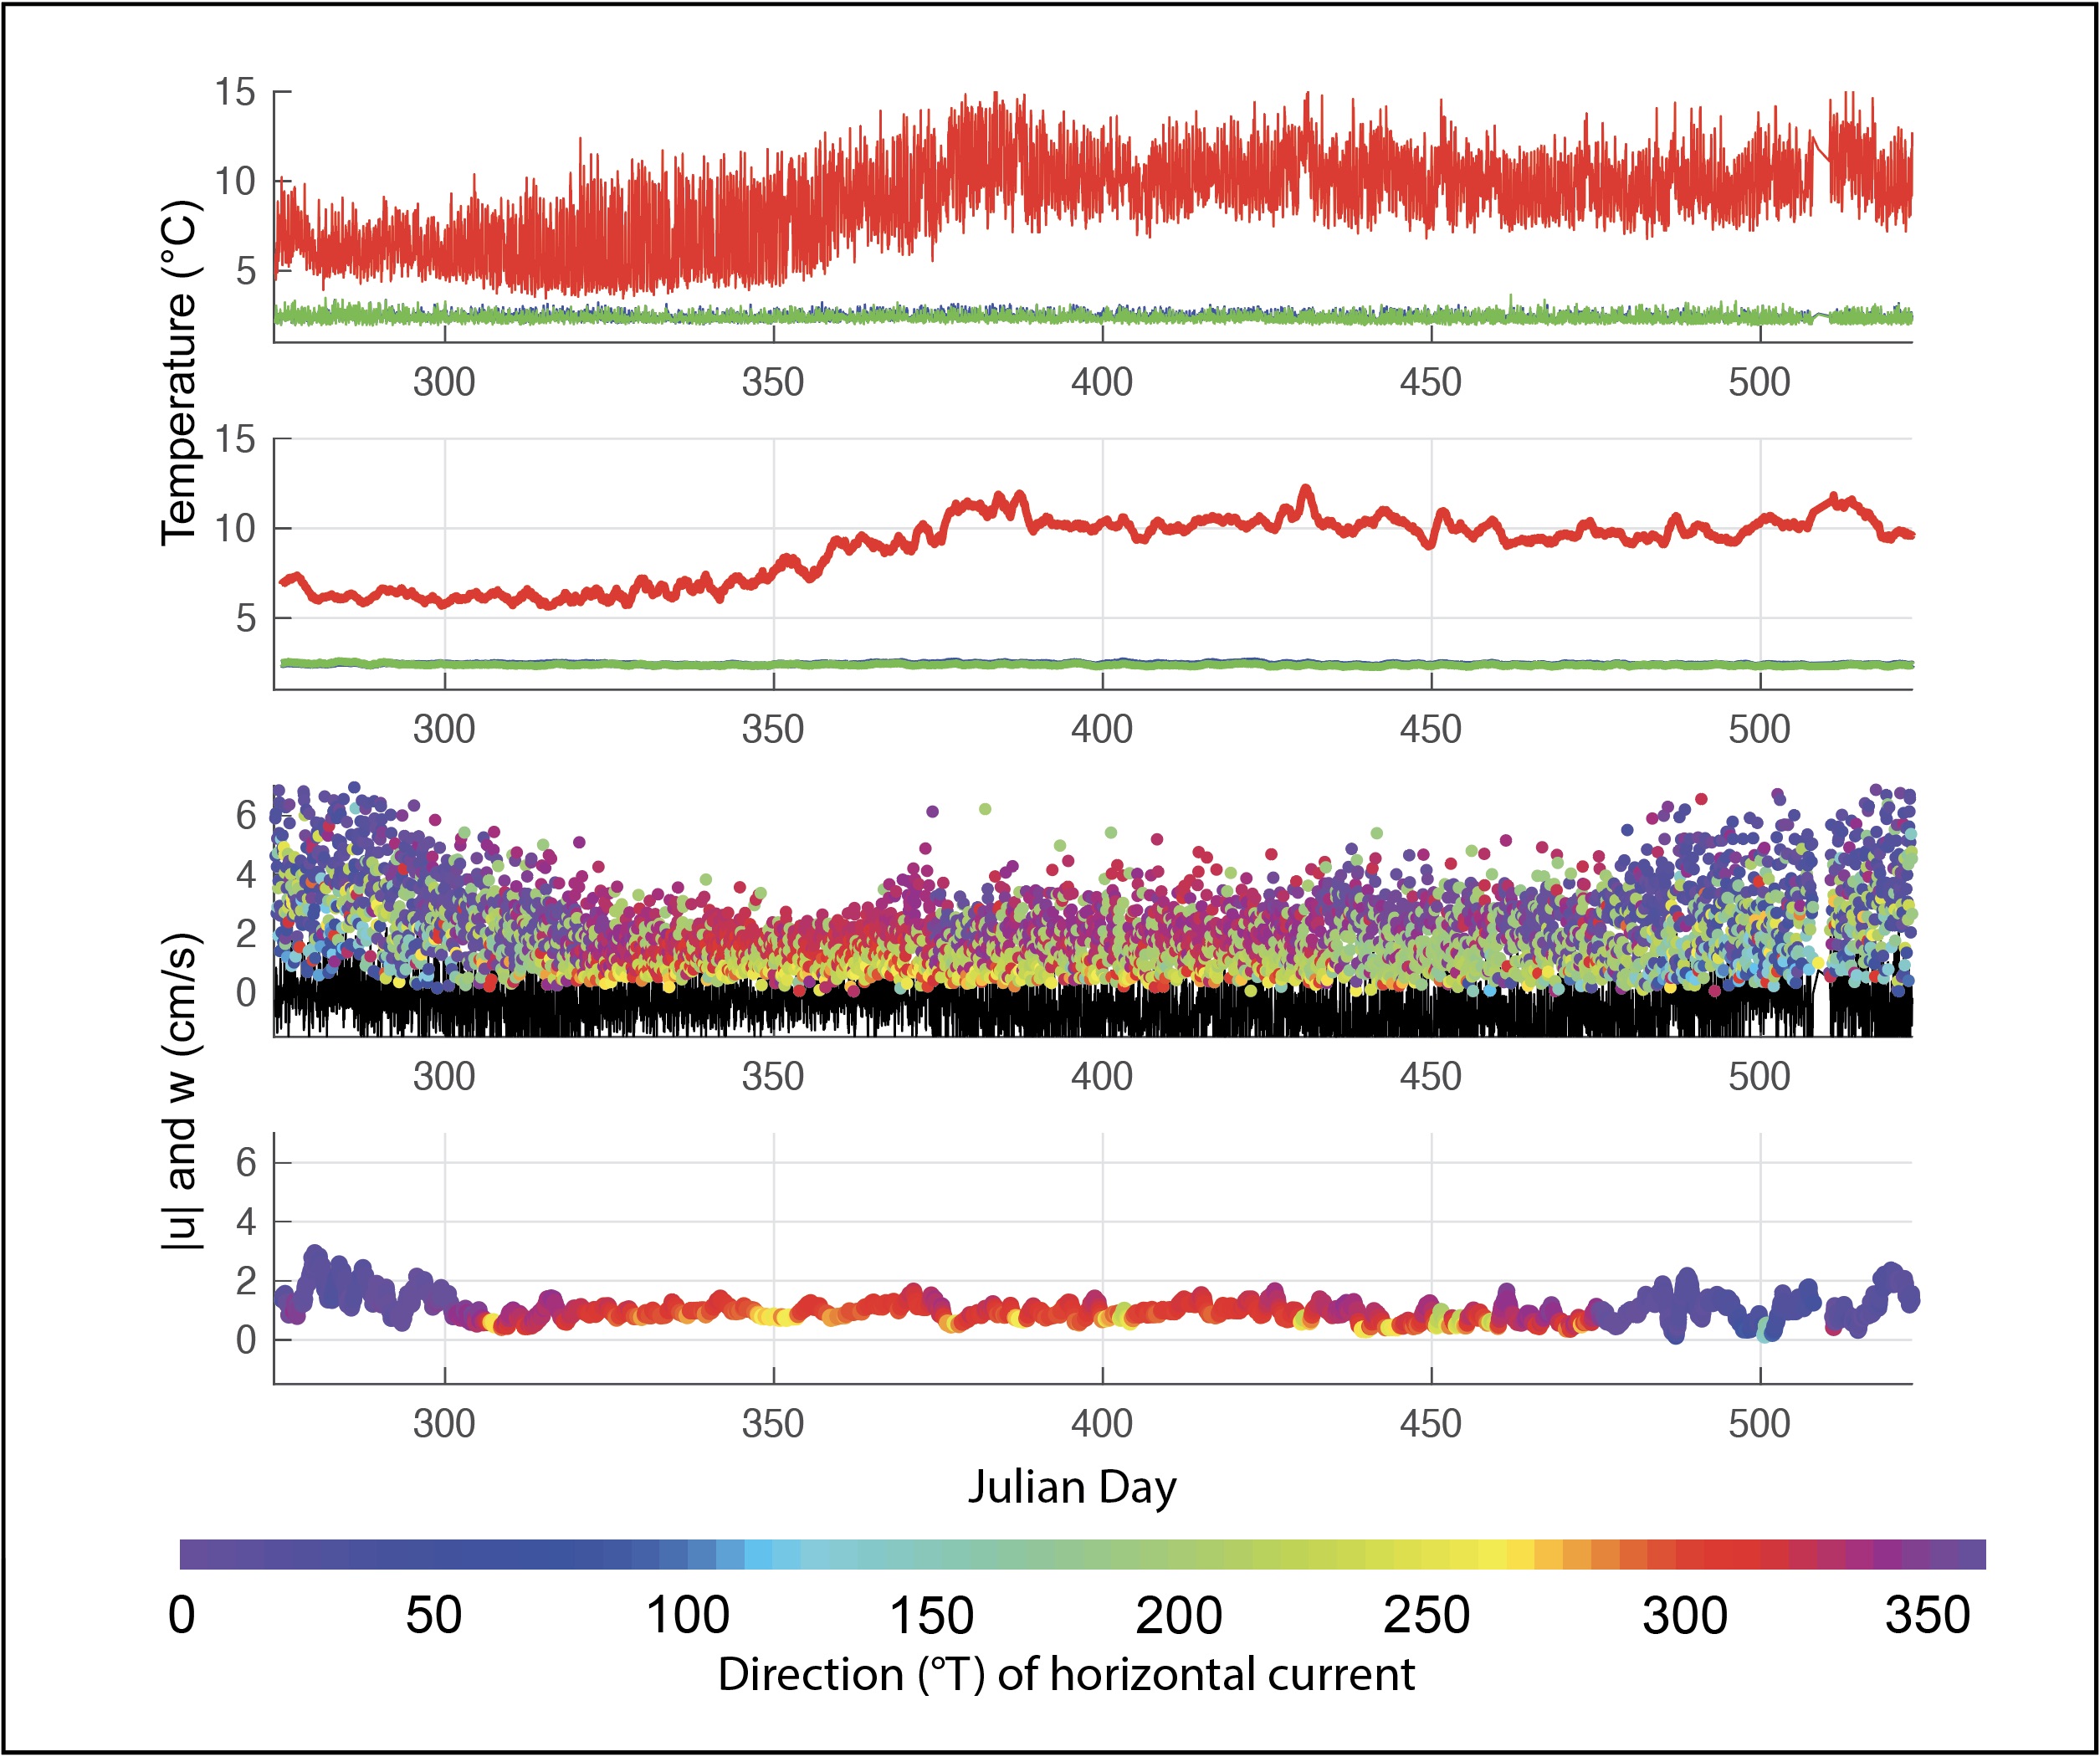
Main Endeavour Field 6
Top Panel: Hourly values of temperature at the seafloor (red), velocity sensor ~0.5 m height (green), and near the top of the instrument stand ~1 m height (blue).
2nd Panel: 2-day running mean of temperature records.
3rd Panel: Hourly values of horizontal speed (colored) and the vertical component of velocity (black). Bottom Panel: 2-day running mean of horizontal speed and direction.
There is no turbulent heat flux record for this deployment. The record mean current at 0.5 m height is 0.9 cm/s directed toward 326°T (Garcia-Berdeal 2006).
| Deployment dates: | 30 Sep 2000 to 9 Jun 2001 |
| UTM coordinates (region 9T): | x = 492573, y = 5310525 |
| Water depth: | 2198 m |
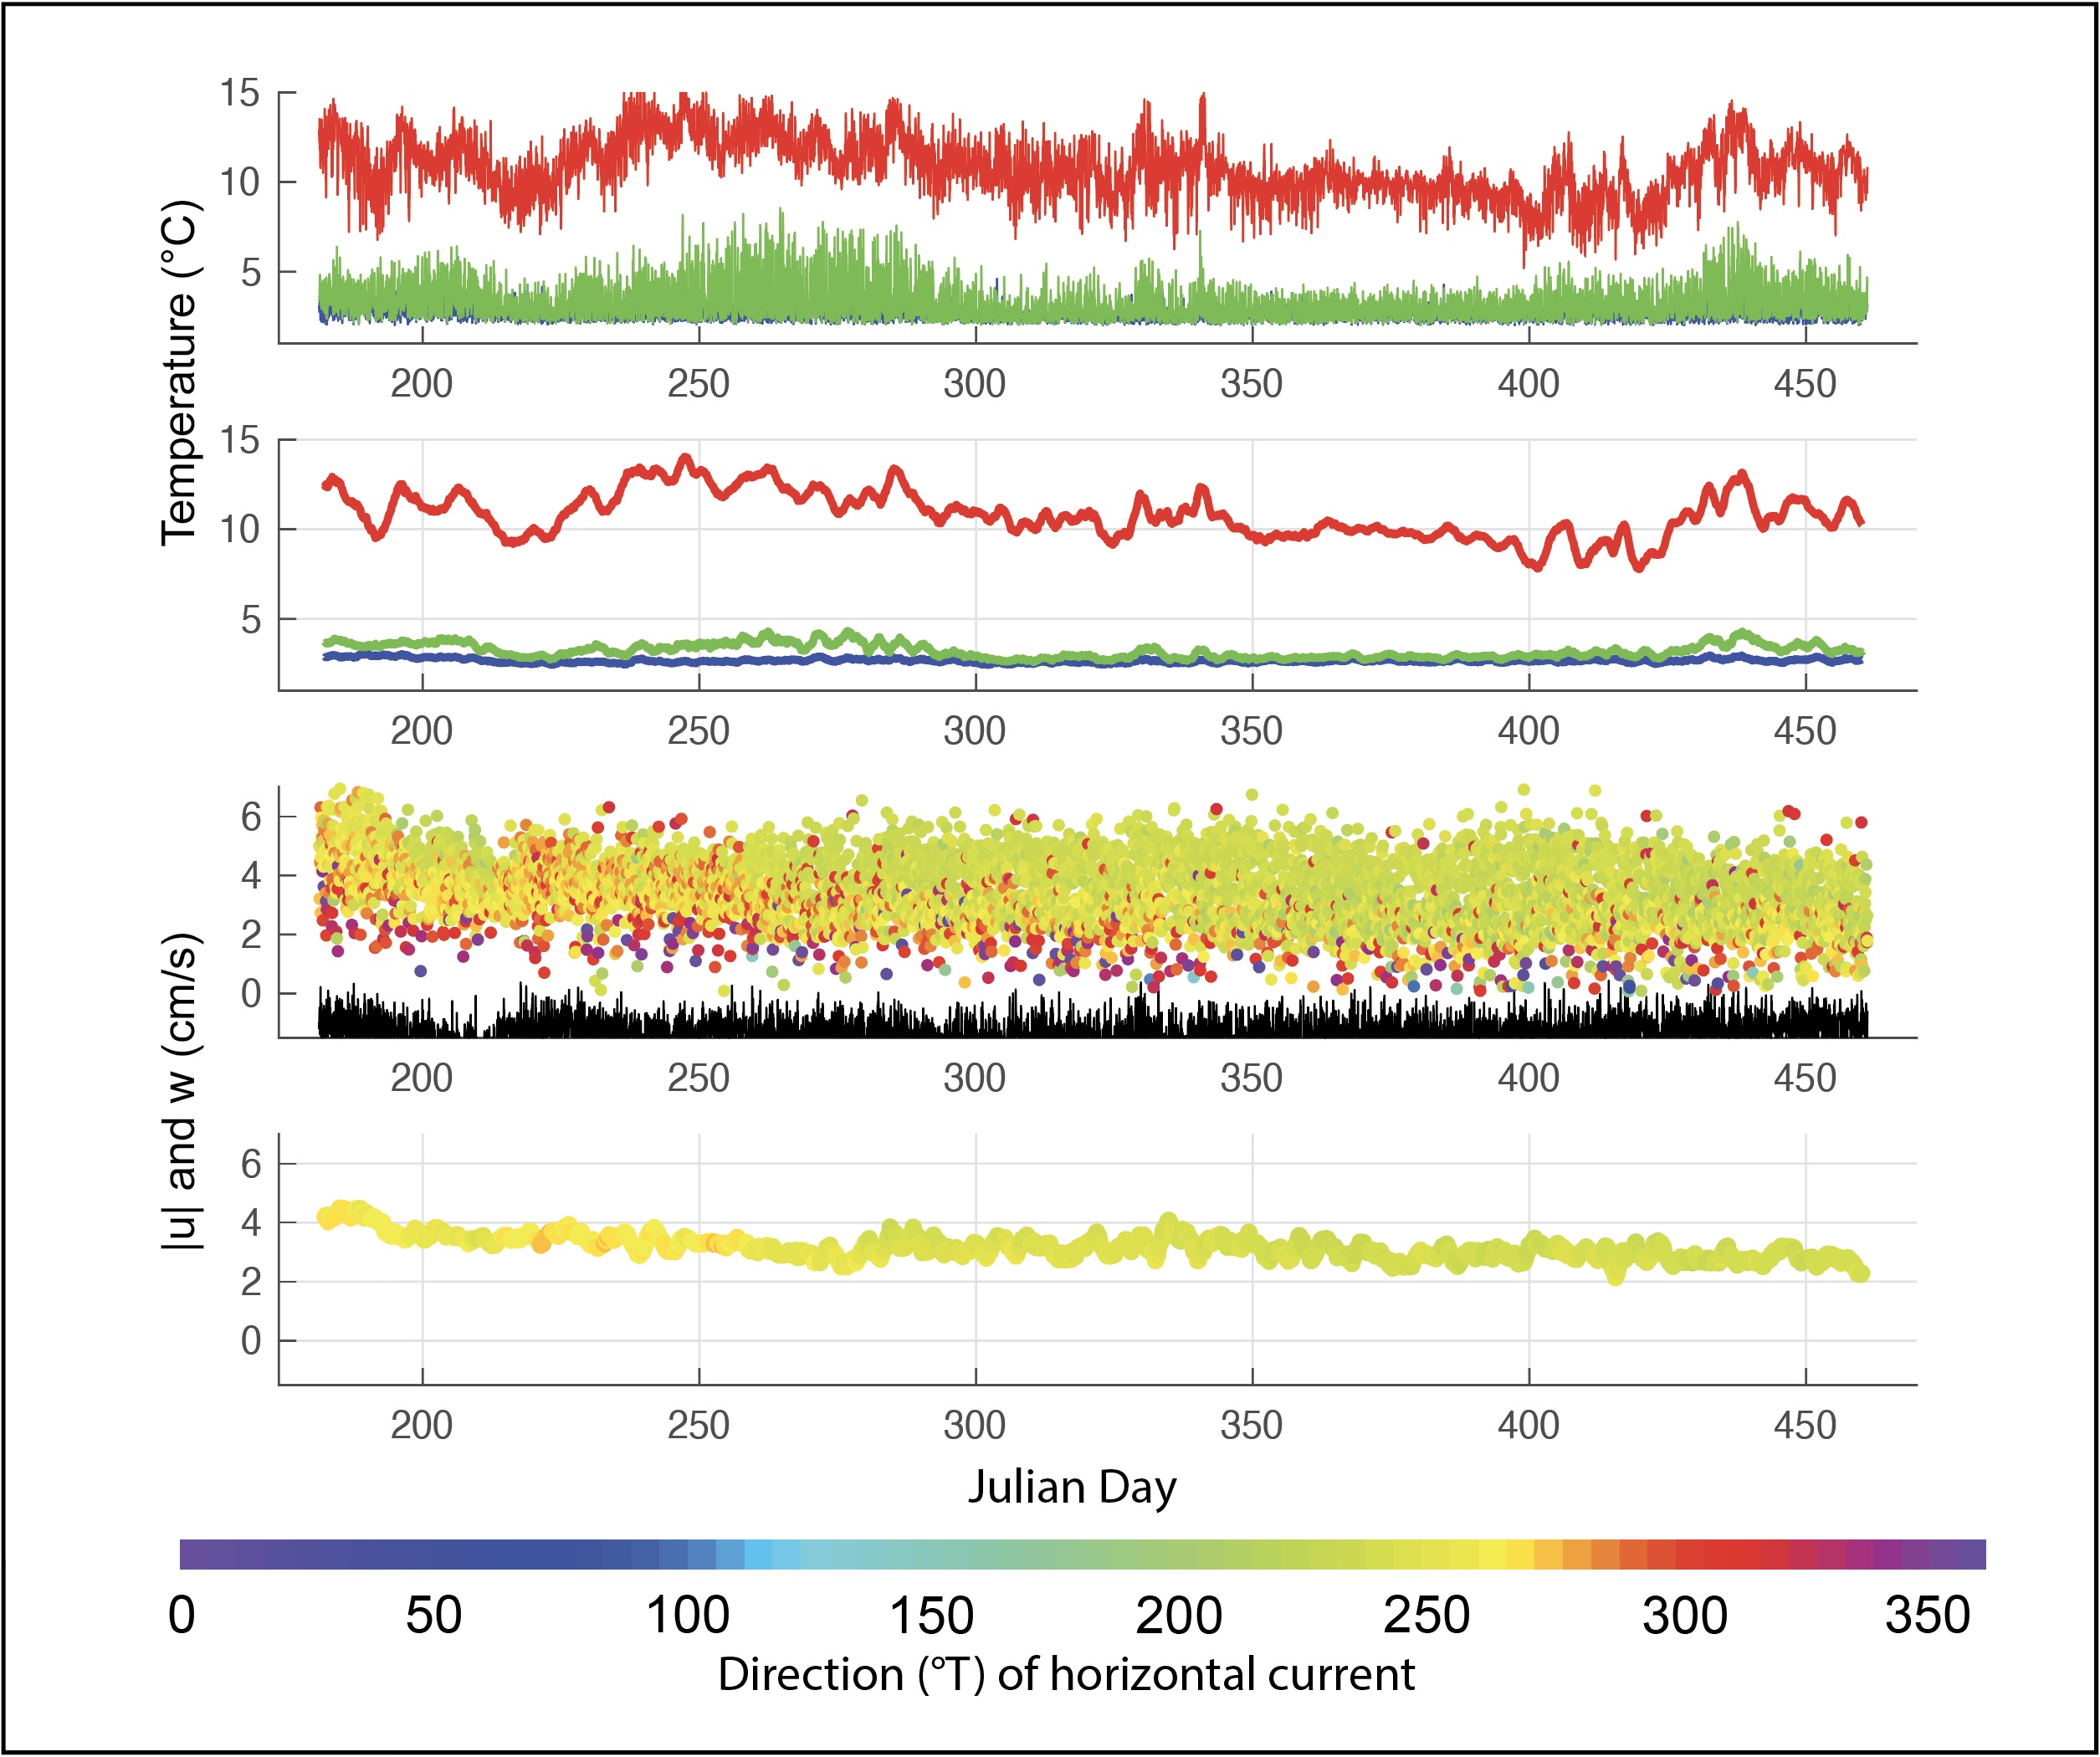
Main Endeavour Field 10
Top Panel: Hourly values of temperature at the seafloor (red), velocity sensor ~0.5 m height (green), and near the top of the instrument stand ~1 m height (blue).
2nd Panel: 2-day running mean of temperature records.
3rd Panel: Hourly values of horizontal speed (colored) and the vertical component of velocity (black). Bottom Panel: 2-day running mean of horizontal speed and direction.
There is no turbulent heat flux record for this deployment. The record mean current at 0.5 m height is 1.2 cm/s directed toward 065°T (Garcia-Berdeal 2006).
| Deployment dates: | 30 Jun 2001 to 13 Feb 2002 |
| UTM coordinates (region 9T): | x = 492576, y = 5310521 |
| Water depth: | 2194 m |
Main Endeavour Field 11
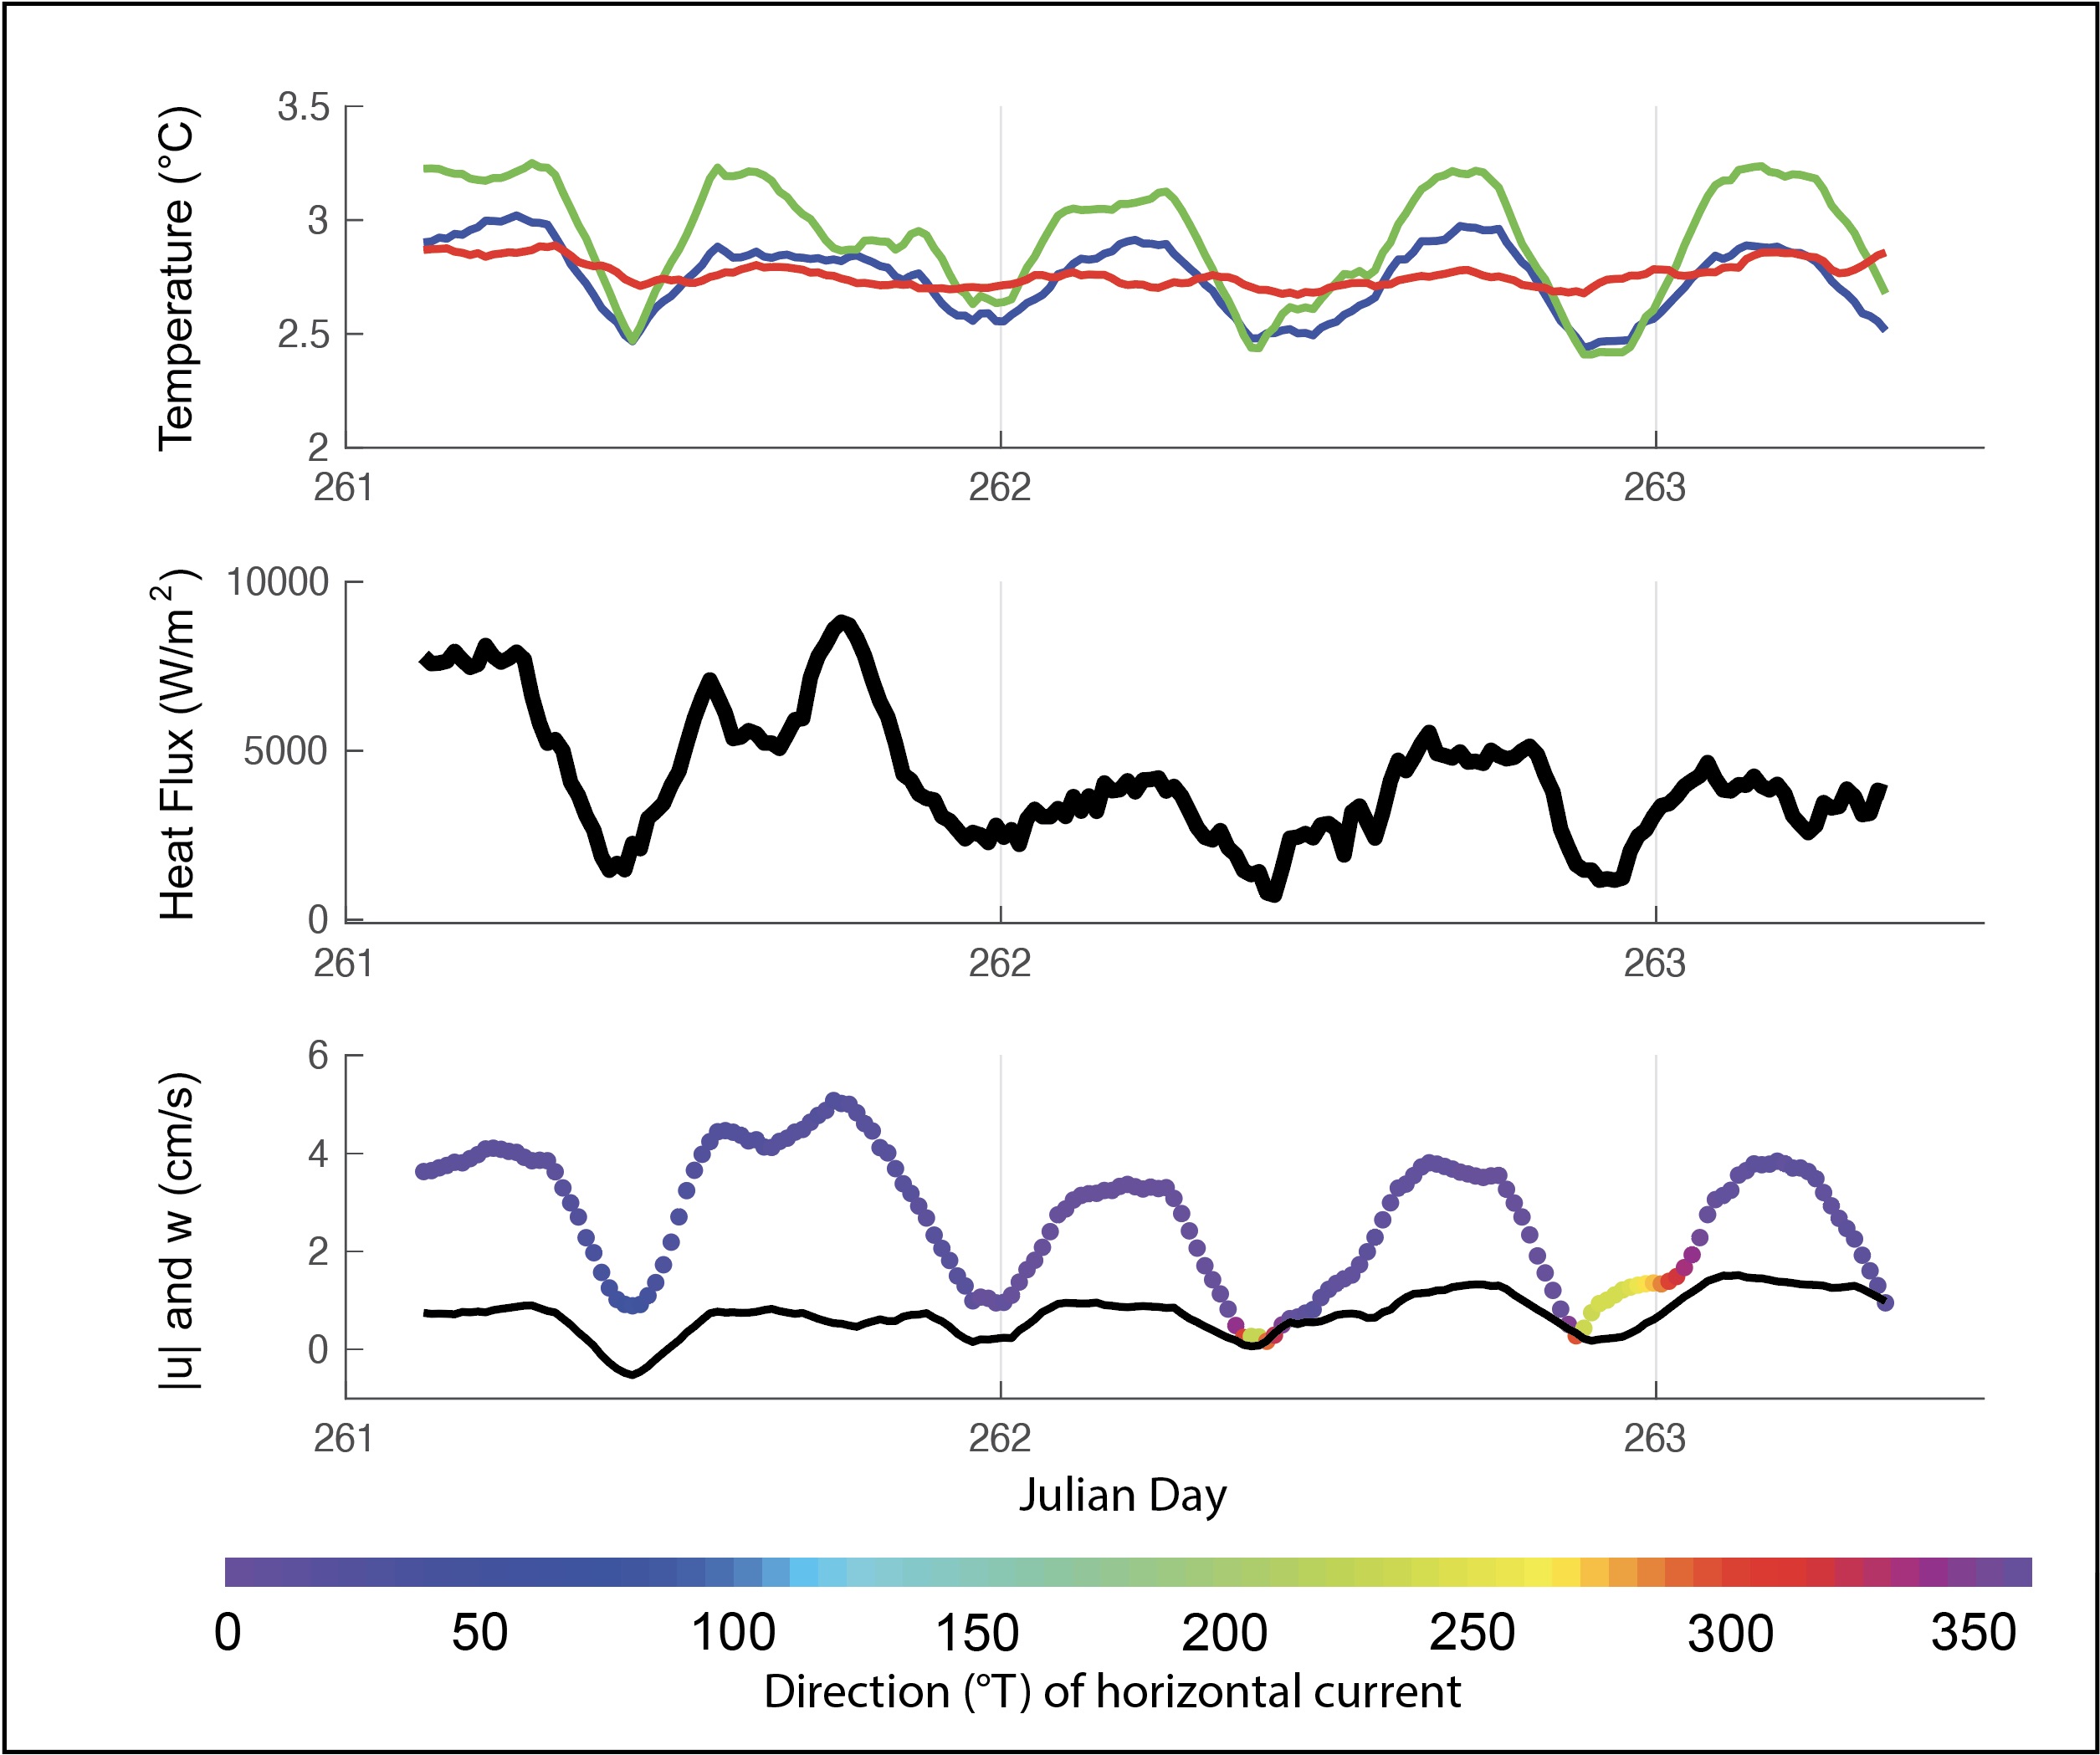
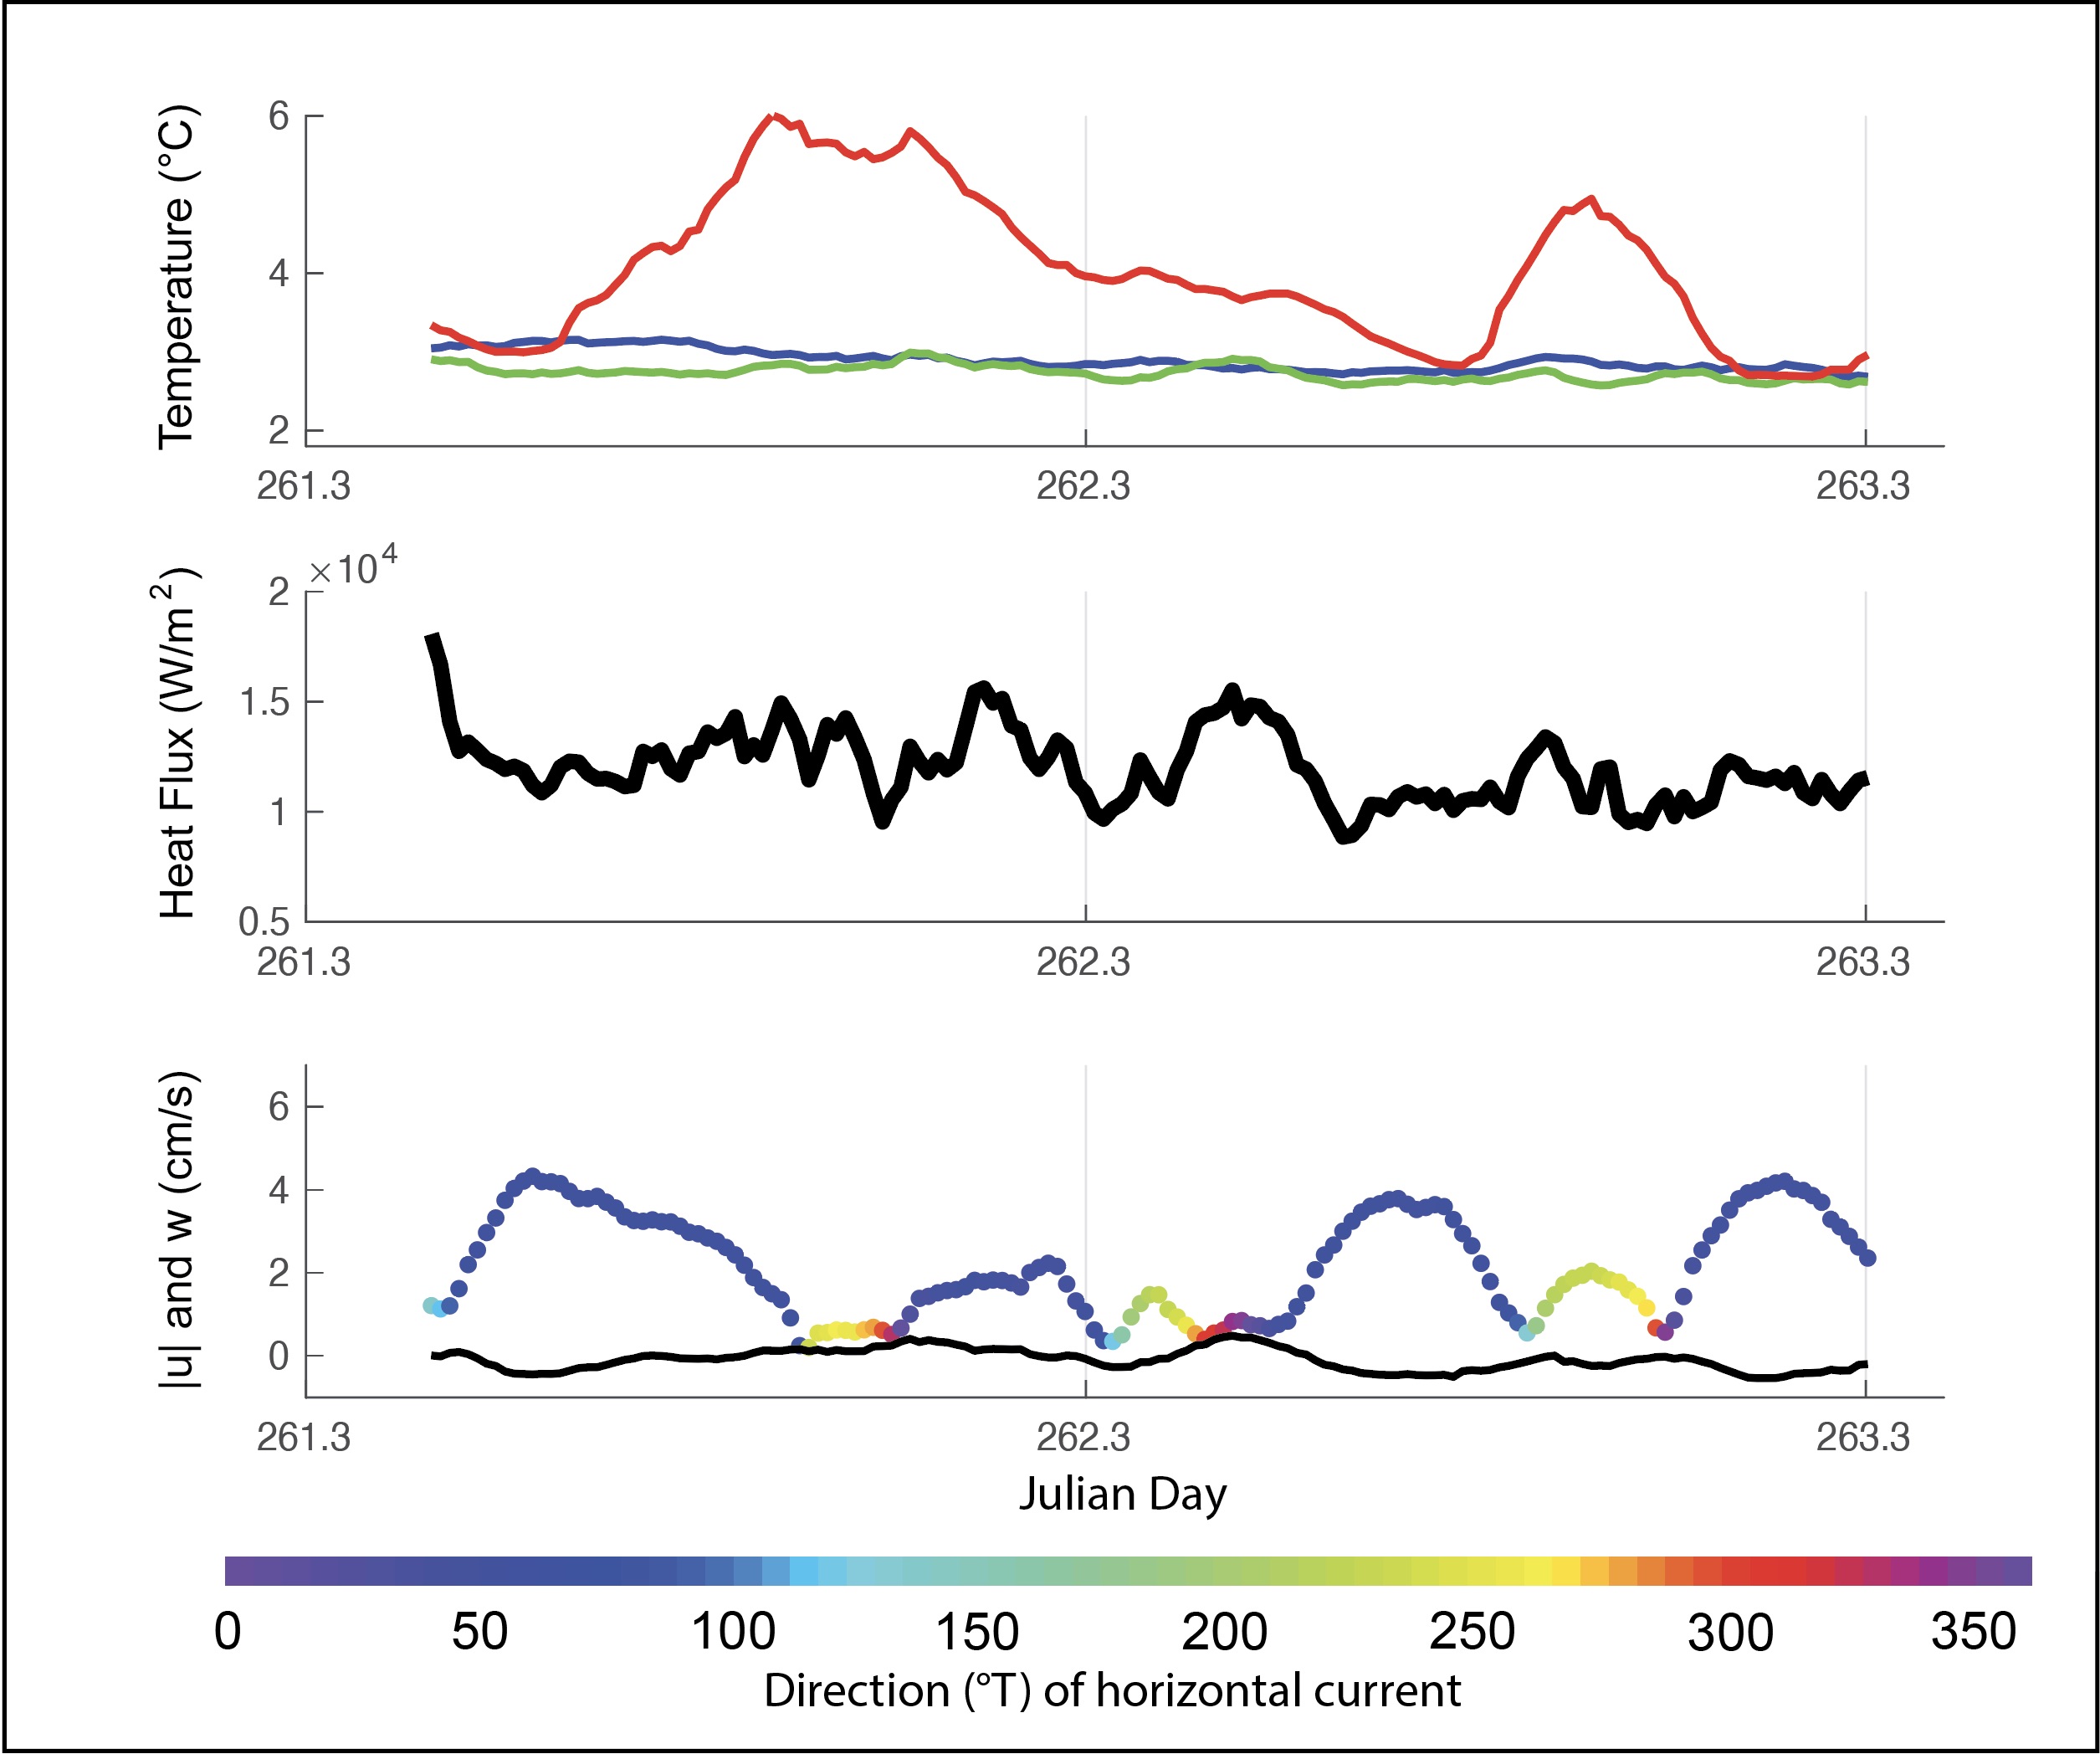
Top Panel: temperature at the seafloor (red), velocity sensor ~0.5 m height (green), and near the top of the instrument stand ~1 m height (blue). Middle panel: heat flux determined by direct correlation from ~2Hz vertical velocity and temperature data, averaged over 17 minute ensembles. Lower panel: horizontal current speed color-coded by direction and vertical velocity (black). All curves have been smoothed with a 10-ensemble running mean.
The record mean current at 0.5 m height is 2.8 cm/s directed toward 012°T, with friction velocity u* = 0.68 cm/s (Garcia-Berdeal 2006). The record mean heat flux is 4700 ± 660 W/m2 (Pruis 2004).
| Deployment dates: | 18 Sep 2002 to 20 Sep 2002 |
| UTM coordinates (region 9T): | x = 492576, y = 5310521 |
| Water depth: | 2194 m |
Main Endeavour Field 12
Top Panel: temperature at the seafloor (red), velocity sensor ~0.5 m height (green), and near the top of the instrument stand ~1 m height (blue). Middle panel: heat flux determined by direct correlation from ~2Hz vertical velocity and temperature data, averaged over 17 minute ensembles. Lower panel: horizontal current speed color-coded by direction and vertical velocity (black). All curves have been smoothed with a 10-ensemble running mean.
The record mean current at 0.5 m height is 2.6 cm/s directed toward 059°T, with friction velocity u* = 0.89 cm/s (Garcia-Berdeal 2006). The record mean heat flux is 12 ± 1.4 kW/m2 (Pruis 2004).
| Deployment dates: | 18 Sep 2002 to 20 Sep 2002 |
| UTM coordinates (region 9T): | x = 492574, y = 5310523 |
| Water depth: | 2193 m |
Main Endeavour Field 13
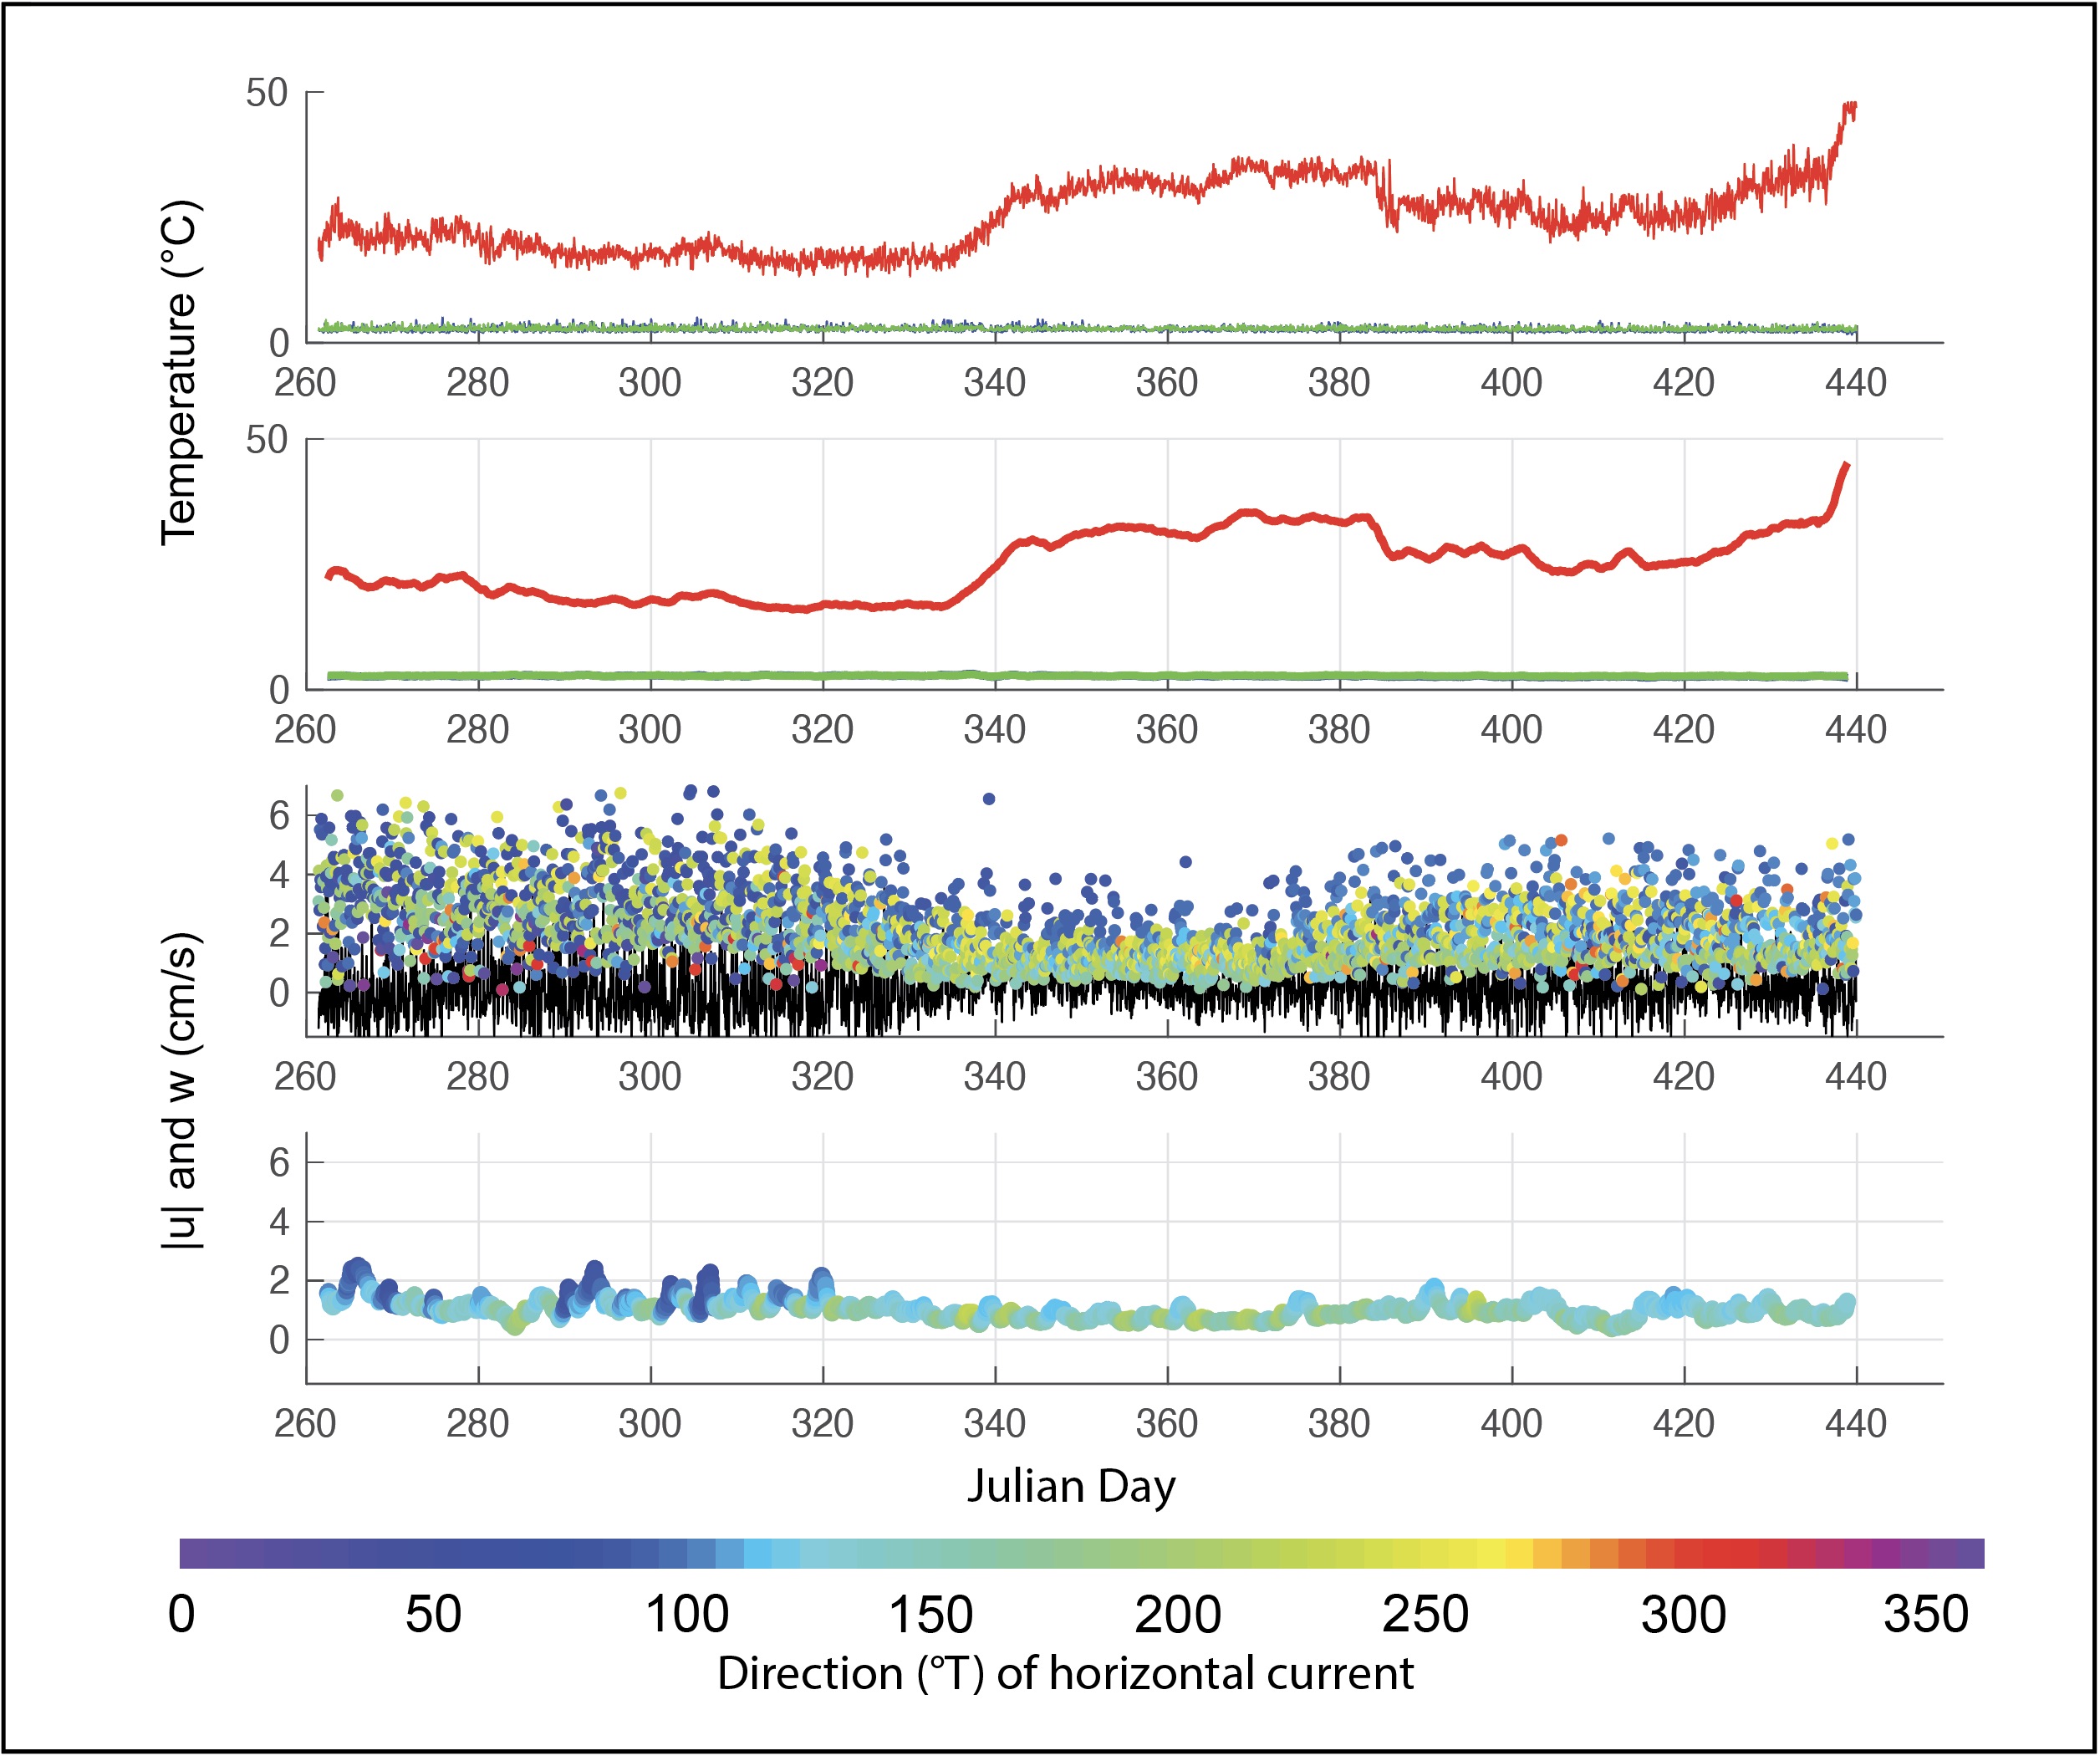
Top Panel: Hourly values of temperature at the seafloor (red), velocity sensor ~0.5 m height (green), and near the top of the instrument stand ~1 m height (blue).
2nd Panel: 2-day running mean of temperature records.
3rd Panel: Hourly values of horizontal speed (colored) and the vertical component of velocity (black). Bottom Panel: 2-day running mean of horizontal speed and direction.
There is no turbulent heat flux record for this deployment. The record mean current at 0.5 m height is 0.9 cm/s directed toward 136°T (Garcia-Berdeal 2006).
| Deployment dates: | 18 Sep 2002 to 16 Mar 2003 |
| UTM coordinates (region 9T): | x = 492576, y = 5310524 |
| Water depth: | 2197 m |
