USING MATLAB TO PROCESS AND ANALYZE OCEANOGRAPHIC
DATA
Ocean
499D
Grading: Credit/No Credit
SLN:
5698
Instructor:
Prof. Brian Lewis
MATLAB
is a widely used commercial program for performing scientific calculations. It has many functions for inputting
data, analyzing and plotting data, making maps and many other scientific
applications. MATLAB uses matrix algebra as the basis for manipulating data and
functions.
At
the University of Washington MATLAB has
been installed on the computers that are accessible to students, faculty and
staff and the most current versions of the program are on these machines. For
students this is the computer called GOODALL and for faculty it is the MEAD
computer. These computers use the UNIX
operating system and have available on them many other tools in addition to
MATLAB that are helpful in processing
and analyzing oceanographic data.
Although there are also versions available that run on PC's, the UW site
license covers only the versions running on the UW computers called MEAD
(faculty) and GOODALL (students). These versions are up to date and include
most of the options available for MATLAB.
The UW versions of MATLAB can be accessed
from a PC by running a XWINDOWS program on the PC (such as XWIN32). This makes
MATLAB very easily accessible by all students and faculty.
To
effectively use MATLAB on the UW computers one must have some knowledge of the
UNIX operating system. This is provided in this course.
MATLAB
is based on matrix linear algebra and an introduction to matrix algebra is also
covered in the course.
This
is a "how-to" course, rather than an in depth science course, and it
will not be counted toward your degree requirements of 20 credits of
upper-division science. The class would normally meet twice a week in the Fisheries
computing lab. This lab can accommodate about 10 students. In this course I
will cover;
An
introduction to UNIX
An
introduction to matrices
Using
MATLAB to calculate and plot math functions
Using
MATLAB to input data and plot the data (eg CTD data, ADCP data)
Using
MATLAB to make maps.
This
information is available on the WEB at http://faculty.washington.edu/blewis/
------------------------------------------------------------------------------------------------------------------------------
Some examples of what can be accomplished in
MATLAB are as follows.
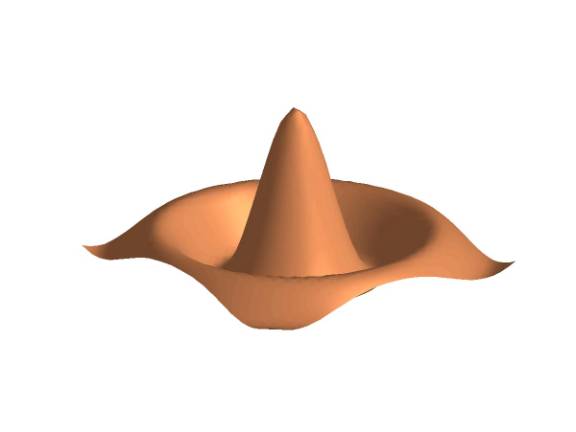
Example
1. Visualizing mathematical equations. The code below calculates and plots the
sin(x)/x function.
%
sombrero to illustrate plotting options
[X
Y]=meshgrid(-8.5:0.5:8.5, -8.8:0.5:8.5);
Z=sqrt(X.^2
+Y.^2) +eps;
R=sin(Z)./Z;
h=surfl(R);
colormap(copper)
shading
interp
pause
set(gca,'xgrid','off')
pause
set(gca,'ygrid','off')
pause
set(gca,'zgrid','off')
pause
axis
off
pause
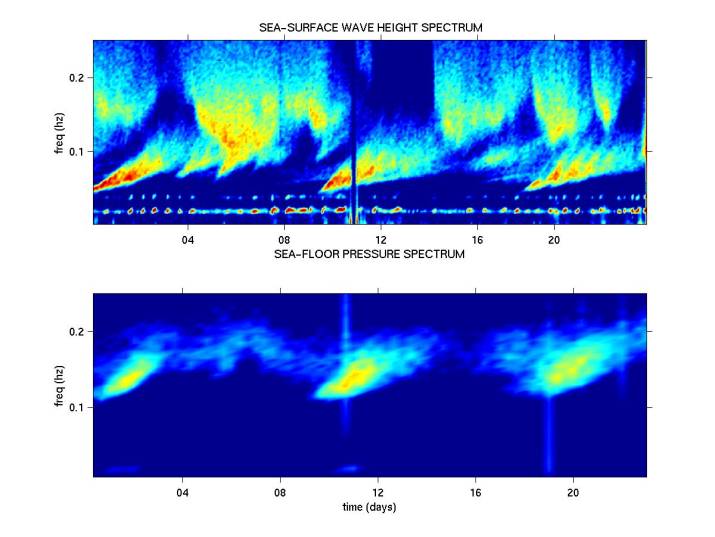
Example 2. Inputting
data, calculating spectra etc are all relatively simple in MATLAB. In this
example spectra of sea-surface waves are compared with the spectra of sea_floor
pressure to show that the non-linear interaction of sea-surface waves results
in sea-floor pressure at twice the frequency of the waves.
Example 3. Maps. MATLAB has an extensive set of functions for
accessing geographic data and plotting it. In this example, from the matlab
site, land topographic data and ocean
depth data are combined into a single map.
To
see some more information on each of these topics click on the links below.
Visit
the MATLAB home page to see a detailed description of what this program is capable of.
For
some info on UNIX click here UNIX
For some
more matlab info click here MATLAB