The H-filter
|
|
The H-filter |
|
The H-filter is an inherently microfluidic device. Developed at UW in the mid-90's, the H-filter allows continuous extraction of molecular analytes from fluids containing interfering particles (e.g., blood cells, bacteria, microorganisms, dust, and viruses) without the need for a membrane filter or similar component that requires cleaning or replacement. This device is designed to process the small fluid volumes (nanoliters to microliters) analyzed by microfluidic instruments, although it can be scaled up to process fluids at arbitrarily high flow rates. The basic principles inherent in the operation of the H-filter are central to many of the devices and processes under development in the UW group.
Because the Reynolds number in most microfluidic channels is generally kept well below 1 (except in certain cases--see Mixing section, for example), no convective mixing of fluids occurs. The only means by which solvents, solutes and suspended particles move in a direction transverse to the direction of flow is by diffusion. The root mean square distance traveled by a molecule in a time interval, t, is described by the Einstein relation for molecular diffusion in solution,
![]() [7]
[7]
where D is the molecular diffusion coefficient. The diffusion coefficient scales roughly with the inverse of the size of the molecule (the hydrodynamic radius) and also depends to some extent on the shape of the molecule. Therefore, small molecules have large diffusion coefficients and will move a longer average distance per time than large molecules that have a small diffusion coefficient. Differences in diffusion coefficients can be used to separate molecules or large particles over time. In the H-filter, the time spent flowing in a channel is proportional to the length of the channel, so proper design of a microfluidic channel allows controlled extraction of analytes with high diffusion coefficients from components of the sample with lower diffusion coefficients.
In reality the complexities of flow velocities in such channel cause some of the simple assumption to prove inaccurate, but to a first approximation the H-filter acts as an extractor as described above.
|
|
|
|
|
Figure 2. The principle of the H-filter is shown at upper left. In the center of the device, streams move in parallel, and diffusion causes equilibration of small molecules across the channel, whereas larger particles do not equilibrate during the transit time of the device. Modified streams separate at the right edge. At left is an SEM of the Si portion of a "mock" H-filter (the outlets are combined). Above, a fluorescence image of this H-filter sealed by a Pyrex cover in which soluble fluorescent dye is extracted from a mixture of beads and dye. Beads and dye enter from inlet 1, and buffer from inlet 2. After the diffusion channel all beads remain in the upper channel; fluorescent dye is distributed between the upper and lower channels. |
The H-filter can also be operated in such a way to allow fields, such as gravitation or electrostatic fields, to separate a heterogeneous sample into fractions, as in Field Flow Fractionation as invented by Giddings. In the small dimensions found in such microfabricated devices sedimentation tasks that would require a high speed centrifuge for a macroscopic sample can be accomplished using only the ambient 1 g.
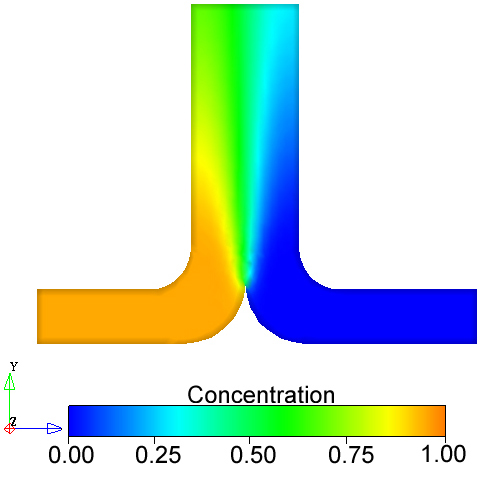
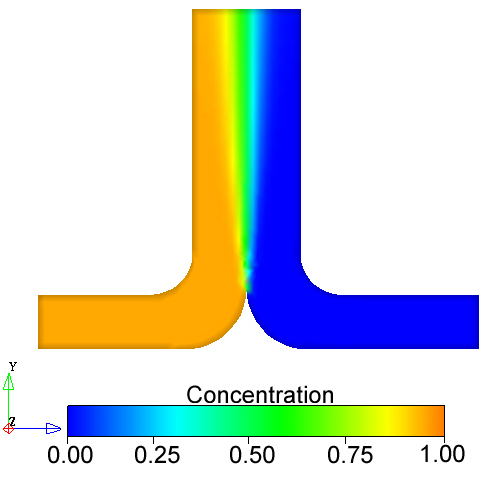
To demonstrate diffusional separation in an H-filter (or the entrance section of an H-filter, which is equivalent to the T-sensor described in its own section), several 2-D and 3-D flow and diffusion scenarios where modeled with FlumeCAD. Unlike the 3-D solution, a 2-D solution treats the channel as having infinite depth, w, and therefore, has no top and bottom wall boundary conditions. In this case, the inlet channels are 40 µm wide, the outlet channel is 80 µm wide and the flow velocity at each inlet is 125 µm/s. After the velocity profile was calculated, two mass transport simulations where performed in which the diffusion of a slowly diffusing molecule could be compared with that for a quickly diffusing molecule. A normalized concentration of analyte entered at the left inlet while buffer entered at the right inlet. Figure 2.5 shows the diffusion of biotin (D = 340 µm2/s) and albumin (D = 65 µm2/s) in a T-sensor. As expected, the region of interdiffusion along the centerline is greatest for biotin, the more quickly diffusing species. A plot of the concentration across the width of the channel at the outlet yields typical diffusion curves (Figure 2.6). Again, due to the larger diffusion coefficient of biotin and the speed at which the concentration gradient equilibrates, the diffusion curve at the outlet of the device is more quickly approaching a uniform concentration across the entire width of the channel than that for albumin.
|
|
|
|
|
|
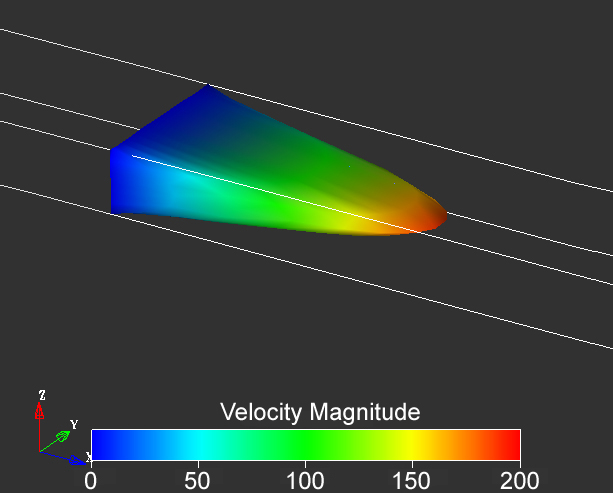
Understanding the velocity profile and the effects it may have on the distribution of diffusing analytes in a microchannel is critical for developing functional and reproducible assays. For example, the velocity profile within a microchannel with an aspect ratio of 2:5 is parabolic in both the d-dimension and the w-dimension (Figure 2.3). Calculating the residence time of a molecule within the channel becomes quite complicated because the residence time depends very heavily on the spatial location of the molecule. Moreover, the spatial location of molecules changes over time as they undergo Brownian motion. In particular, diffusion that occurs transverse to the direction of flow (across the d-dimension) results in a significant decrease in the residence time as the flow velocity decreases as the molecule moves away from the center-centerline (at _ d, _ w). Because of the resulting distribution of residence times across the d-dimension, analysis of time dependent events that occur within the channel such as diffusion and chemical reactions becomes very difficult to quantify.
However, the velocity profile within a channel with a much higher aspect ratio (such as 50:1) is parabolic only in the w-dimension (Figure 2.4). The velocity profile in the d-dimension is nearly blunt, that is, completely uniform across most of the d-dimension, with the only nonuniformity occurring near the walls. This type of velocity profile allows lateral diffusion to occur in the d-dimension without an accompanying change in residence time for diffusing molecules. High aspect ratio devices are, therefore, much more desirable for quantitative studies in microfluidic channels.
|
|
|
|
Figure 2.3. Three-dimensional velocity profile of fluid in a microchannel with an aspect ratio of 2:5 |
Figure 2.4. Three-dimensional velocity profile of fluid in a microchannel with an aspect ratio of 50:1. |
Because the relative viscosity of two fluids can dramatically influence the width of a fluid stream across the width of a H-filter, CoventorWare was used to create three-dimensional models of two viscosity flows. The main channel dimensions where 1000 mm wide, 200 mm deep and 5000 mm long and 49,000 linear finite elements where distributed throughout the channel. Water (h=1.002 x 10⁻⁹ kg/mmás) entered at the left inlet of the H-filter, while a fluid with a viscosity 2, 5 or 10 times higher entered at the right inlet. The flow rate at each inlet was 5 x 106 mm3/s, resulting in an average Reynolds number of 0.01. The Finite Volume Solver was used to calculate the velocity profiles within the device (Figure 2.11).
Of course, when the two fluids have the same viscosity and are pumped at the same flow rate, they each occupy exactly half of the channel. However, when one fluid has a higher viscosity, it moves more slowly and therefore occupies a greater fraction of the channel (Figures 2.11 and 2.12). When the fluid entering the right inlet was two times more viscous than the water entering at the left inlet, the water occupied 39% of the channel. The water occupied only 26% and 20% of the channel when the viscosity was 5 times and 10 times that of water, respectively. These results demonstrate that relatively small differences in viscosity can have significant effects on the relative distribution of two fluid streams.
Figure 2.11. Velocity streaklines originating from right inlet of a T-Sensor in which water enters at the left inlet and a fluid with a viscosity 10 times (A), 5 times (B) or 2 times (C) higher than that of water enters at the right inlet. Note that the velocity scale bars at the bottom of each image are not the same. Note that such a noticeable effect of viscosity only occurs if d is substantially larger than w.
Figure 2.12. Velocity profiles across the outlet of a T-Sensor in which water enters at the left inlet and a fluid of higher viscosity enters at the right inlet.
Many variations of the H-filter have been studied in this group. See, for example, the work on electrokinetic separations in this www site.
Low Reynolds number micro-fluidic devices, Brody, J.P. and Yager, P., Proceedings Hilton Head MEMS conference, Solid-State Sensor and Actuator Workshop, 105-108, (1996)
A planar microfabricated fluid filter , Brody, J.P., Osborn, T.D., Forster, F.K. and Yager, P., (Proceedings of Transducers '95), Sensors and Actuators A (Physical), A54 (1-3), 704-708, (1996).
Optimal design of a microfabricated diffusion-based extraction device, Holl, M.R., Galambos, P., Forster, F.K., Brody, J.P., Afromowitz, M.A., and Yager, P., Proceedings of 1996 ASME Meeting ASME DSC59, 189-195 (1996)
Feasibility study for the measurement of oxyhemoglobin using whole blood without pretreatment, Wu, C., Kenny, M.A., Huang, M., Afromowitz, M.A., and Yager, P., Clinical Chemistry 42:S283, (1996).
Biotechnology at low Reynolds numbers, Brody, J.P., Yager, P., Goldstein, R.E., and Austin, R.H., Biophysical Journal. 71 (6), 3430-3441, (1996).
|
|
Return to Microfluidics Home Page Return to Yager Group Home Page
|