Diffusion Immunoassay (DIA)
|
|
Diffusion Immunoassay (DIA) |
|
One of the most powerful and versatile biomedical diagnostic tools, the immunoassay, is used to monitor the levels of drugs and hormones in body fluids, to diagnose infectious and autoimmune diseases, and to both diagnose and monitor treatment of cancer. The performance of immunoassays is today largely restricted to centralized laboratories because of the need for long assay times, complex and expensive equipment, and highly trained technicians. If a wider range of the 700 million immunoassays performed annually in the US alone could be run more inexpensively, more frequently, and at the point of care, the health of millions of patients could be improved. Recent developments in microfluidics suggest that instruments could soon be developed that would allow immunoassays to be performed as easily as is blood glucose testing today.
A microfluidic diffusion immunoassay (DIA) has just been demonstrated that may provide a new set of biochemical processes and a common analytical platform that are well suited to such miniaturized and simplified instrumentation. In this assay, the transport of molecules perpendicular to flow in a microchannel is affected by binding between antigens and antibodies. By imaging the steady-state position of labeled components in a flowing stream, the concentration of very dilute analytes can be measured in a few microliters of sample in seconds. This assay has been demonstrated in the format of a small molecule analyte competition immunoassay using fluorescence imaging detection. The DIA could, then, be used for monitoring drugs, hormones, and other small analytes. Modeling suggests that the current assay can easily detect molecules below the 1-10 nM range in which it has been demonstrated, and could monitor concentrations of analytes as large as proteins, at the cost of increased assay times.
The immunoassay is the workhorse of analytical biochemistry--it allows the unique binding abilities of antibodies to be widely used in selective and sensitive measurement of small and large molecular analytes in complex samples. In medicine, immunoassays are used in two general classes of diagnostic applications: 1) the diagnosis of a disease state or identification of the organism responsible for a disease state, and 2) the management of treatment for a disease, either through monitoring of the disease state or of the drugs used for therapy. These are vital activities for the maintenance of human health, as shown in Table I. Every year there are over 700 million immunodiagnostic assays performed in the US alone . Annual sales for immunoassay reagents and supplies are currently $2 billion in the US and $7 billion worldwide. To reduce this cost of healthcare, or to use those dollars in a way that is more beneficial to the health of those who require the tests, innovations in the technology of immunoassays are necessary. While there have been great advances in nucleic acid-based diagnostics, and mass spectrometry is becoming smaller, smarter, and less expensive, to date there is no technology that can substitute for the immunoassay.
|
Application |
|
|
|
|
Drug testing |
26% |
|
|
|
Infectious diseases |
21% |
|
|
|
Endocrinology/hormones |
33% |
|
|
|
Immunology |
7% |
|
|
|
Cancer |
5% |
|
|
|
Other |
8% |
|
|
The dozens of different types of immunoassays developed over the last century all exploit the highly selective binding between an antibody and its matching antigen. Some assays work in homogeneous phases (in solution or gels), whereas the majority are heterogeneous assays, involving adhesion of antibodies and/or antigens to a solid surface. The surfaces used in the heterogeneous assays are usually the walls of microtiter plates with 96 or more wells. Some assays are competitive, in which labeled analytes compete for the binding sites of antibodies. The decrease in bound (or increase in free) labeled antigen is measured. Other (and often more sensitive) assays require "sandwiching" of the analyte between an immobilized primary and mobile but labeled secondary antibody. Most of the differentiation between such assays is based on the nature of the labeling technique. These assays can be exquisitely sensitive (down to zeptomolar levels, in some cases), although it is generally required that the assay be performed at a number of different concentrations of one or more reagents (or at various sample dilutions) to obtain a definitive measurement of the concentration of the analyte. This necessitates the use of multi-well plates running multiple wells on the same sample. The most sensitive assays can have incubation times of many hours. Economic pressure to increase productivity at the centralized laboratories has, in turn, led to great advances in systems for high throughput immunoassays, aided by laboratory robotics. These are now the strengths of the current centralized immunoassay paradigm&endash;very rapid throughput, excellent precision and reproducibility, and low per-test costs.
Performing the assays usually requires trained personnel to carry out the sample preconditioning steps required. While some high volume consumer-oriented immunoassays have been reduced to dipstick-type formats, such as the HCG test for pregnancy, most immunoassays remain within the walls of large centralized laboratories, far from the patients whose samples are measured.
A long-range goal of this program is to move the immunoassay to the point of sample collection, and thereby to greatly reduce the delay between desire for information and interpretation of the data from the assay. Both the immunoassay and the sample preparation must be rapid, simple, and inexpensive if such point-of-care immunoassays are to be practical. We envision a box the size of a Palm Pilot that would accept microfluidic cartridges capable of running one or more immunoassays on one drop of blood (sputum, urine, cerebrospinal fluid, tap water, or homogenized food, for that matter) within a minute. This device should be as simple to use as the current technology used by diabetics to measure their blood glucose, and the disposables should be no more expensive than the current reimbursable cost of assays in the centralized laboratories. Results should be as accurate and precise as those currently obtained, and, ideally, the same box should be able to perform all the different types of immunoassays now used to measure different classes of molecular analytes. It should use very little power per assay, recognize the patient for definitive sample identification, and be able to communicate assay results via wireless connections (RF or IR) to centralized laboratory/hospital information systems. This ideal instrument could be used in all the applications shown in Table I: in hospitals, doctors offices, nursing homes, emergency vehicles, and even in homes by the patients themselves.
Our current system of hospital care sends patients home as soon as they can walk or be wheeled out the door. The proposed "distributed biomedical diagnostic instruments" could restore to the patient some of the quality of care that used to be part of extended hospital stays. In an era in which the elderly and the chronically ill are taking complex regimens of several drugs, monitoring of their levels and the function of critical systems like liver and kidneys can prolong and improve life by letting the patient and clinician know when and how to adjust drug dosages to optimize treatment. This can reduce the costs of health care even if the only advantage were reduction of dosages or courses of expensive drugs.
Miniaturization of a measurement is not always best accomplished by building a small version of a successful lab-scale instrument. Microfluidics, the manipulation of microliter volumes in channels with sub-millimeter dimensions, is a very active area of research. It promises to allow chemical reactions to be carried out smaller, faster, and in some cases, (because of savings in reagents and waste) cheaper. It is the ONLY way to manipulate fluids for small complex diagnostic instrumentation that will minimize user sample manipulation. The best known example of microfluidic chemical analytical systems is the use of electroosmotically pumped capillary electrophoresis in microfabricated glass devices . A few immunoassays have already been successfully implemented in microfabricated capillaries by Harrison's group . However, to date the sample preconditioning has not been addressed, the instrumentation has not been miniaturized, and, since capillary electrophoresis is a chromatographic technique, it requires a few minutes for the bolus of sample to migrate down the channel before detection. So not only are these assays slow, but it is not yet clear that all immunoassays could be converted to the microfabricated capillary electrophoresis format.
If the handheld point-of-care immunoassay instrument is to be useful, the assays run on it must be intrinsically rapid. The problem is that most current immunoassays are inherently very slow (minutes to hours) because they rely on end-point measurement of the binding reactions; they usually require completion of diffusion of high molecular weight species onto (or off of) the surfaces of the reaction chambers. This is a major impediment to creating rapid immunoassays&endash;-the chemical/binding reactions as they are currently performed are simply not well suited to rapid point-of-care diagnostic instruments.
Since we began our current program in development of microfluidic chemical analytical devices in 1994, we have focused on exploitation of the low Reynolds number conditions present in microchannels. In these microdevices the flow is laminar, so transport of molecules and particles across flow lines can only be by diffusion. For many researchers this limitation has been considered a problem. We have created a series of microdevices that take advantage of this limitation and use it as the basis of new ways of measuring chemicals that have no equivalent in the macroscopic world. Typical devices from our laboratory have been the H-filter for extraction of solutes , the V-groove device for low-volume flow cytometry , and the T-sensor for detection of diffusable analytes . The T-sensor is described in more detail in the next section.
By taking advantage of the reduction of the diffusion coefficients of small molecules when they are bound to much larger molecules, we have demonstrated a new immunoassay format that offers many advantages over conventional formats. As in other T-sensor-based assays, the interdiffusion of laminar flow streams containing chemically reacting components allows optical imaging of steady state stages in the evolution of complex chemical processes. The diffusion immunoassay (DIA) we have demonstrated is not only well suited to implementation using microfluidic technology, but because of the fact that it relies on interdiffusion and does not rely on taking an endpoint measurement, it is also astonishingly rapid.
Recently, we have developed an immunoassay we have named the diffusion immunoassay (DIA). While this DIA is reminiscent of hydrogel-based precipitation-based immunoassays developed decades ago, it is, in fact, novel. It is also uniquely well suited to implementation in the T-sensor. The DIA is based on the difference in diffusion coefficients of antigens and antigen-antibody complexes. Laminar flow conditions in T-sensors allow detection of this difference as a function of diffusion distance across the channel using labeled tracer molecules and multichannel optical detection. Like other T-sensor assays, it relies entirely on the fluid dynamics of solutions and chemical interactions of components in solution&endash;no interactions with immobile phases such as the channel walls are required or desired. The initial form of the DIA we have explored is a competition immunoassay&endash;a format generally used for small molecule analytes. The unique feature of the DIA is that the assay is extremely rapid, taking little longer than the time it takes to fill the channel with sample and reagent solutions. The image that is the raw data can be integrated by the detector for as long as the volumes are pumped through the T-sensor. To date the total time for the whole assay (including data collection) has been on the order of 20 seconds.
The concentration of the antibody must be established so that the presence of the unlabeled antigen SA causes the labeled antigen LA, which is the only species monitored, to move further into the Ab stream than in the absence of sample antigen SA (as shown in Fig. 3). If the Ab concentration is too high, there are excess unoccupied sites for both the SA and LA, so no change in the binding of LA occurs with changes in [SA]. If the Ab concentration is too low, both SA and LA diffuse unimpeded.
|
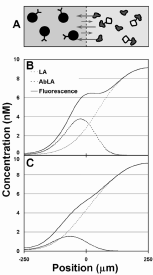 |
Figure 3. Schematic of the diffusion immunoassay (DIA) and how it allows rapid measurement of the concentration of analyte. A) Initial conditions in an interdiffusion competition assay. Two volumes of fluid are placed into interdiffusive contact. One fluid contains a slowly diffusing binding particle such as specific antibody (Ab). The other fluid contains at least a labeled version of the antigen to be monitored (LA) and the unlabeled sample antigen itself (SA). It may also contain diffusing and non-diffusing interferent compounds. B) Schematic representation of the concentration of LA across the diffusion dimension at an early stage of diffusion (free (LA), antibody-bound (AbLA), and total (LA+AbLA)). LA and SA diffuse more rapidly than Ab. Here, the initial concentration of Ab is much greater than LA+SA, allowing a significant fraction of LA and SA to bind. Bound antigen molecules diffuse much slower, resulting in an accumulation of signal near the fluid interface. C) Schematic representation of the case when Ab << LA+SA. A small fraction of antigen molecules are able to bind due to the saturation of binding sites resulting in a diffusion profile more similar to that of free diffusion. Less LA accumulates near the fluid interface. |
The first analyte tested with the DIA was phenytoin (diphenylhydantoin), an anti-epileptic drug. It is necessary to monitor individual responses to treatment, and to maintain the drug in a narrow therapeutic range of 20 to 80 µM . Many testing formats, both homogeneous and heterogeneous, have been developed for therapeutic monitoring of phenytoin concentrations, including the fluorescence polarization immunoassay (FPIA) , spin immunoassay , radioimmunoassay , and enzyme immunoassay . To develop a microfluidic immunoassay, we chose to adapt the contents of a commercially accepted (but proprietary) FPIA kit used for automated measurement of phenytoin concentration (Sigma). A promising feature of the DIA is that uncharacterized reagents can be used in a quantitative assay, as long as a calibration curve can be generated. Since the contents of the kit we used were not listed in detail, we arbitrarily chose one set of dilutions of the reagents for initial studies shown in Figs. 4-5.
The fluorescently-labeled phenytoin (fl-phenytoin), the LA, is still a small molecule, so it diffuses relatively rapidly across the channel. When the phenytoin-specific antibody Ab is introduced to the left side of the channel, pure LA diffuses into the Ab layer and piles up to the left of the channel midline (as in Fig. 3), forming a "bump" of fluorescence intensity. As the concentration of unlabeled phenytoin (SA) is increased in the right stream, it competes with LA for the Ab binding sites, allowing an increased fraction of unbound LA to diffuse further into the left side of the T-sensor (Fig. 3C).
|
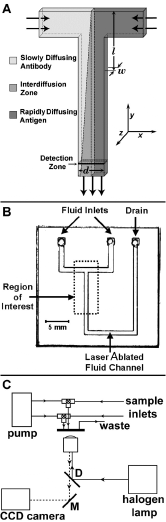 |
Figure 4. Experimental DIA in a T-sensor. A) Schematic of DIA implemented in the simplest possible T-sensor. At low Reynolds number conditions, the flows of the sample antigen (premixed with labeled antigen) and the antibody solution run parallel to each other and do not mix except by diffusion. The concentration of a label such as a fluorophore can be monitored at any point downstream from the entry ports using a one- or two-dimensional detector array. If the device is relatively thin (in the w dimension), all components rapidly equilibrate along that axis and the problem can be treated using a one-dimensional analysis. If more than two streams are introduced into the device, it can be configured to include a reference or control material to provide a simultaneous one-point calibration of the device . Note that at the inlet junction of the two streams, there is a flow development region in which the flow velocity accelerates to the fully developed flow downstream. We have ignored this effect in 1D analytical modeling. B) Picture of the microfluidic laminate device used. It consisted of two glass microscope slide coverslips as windows separated by a spacer. In one glass coverslip, three round holes were drilled for access to the two fluid inlet channels and drain. Between them was a piece of 100 µm thick Mylar coated on both sides with adhesive (Fraylock, Inc., San Carlos, CA), through which we cut channels using a computer-controlled CO2 laser cutting system (Universal Laser Systems). The channel itself was 750 µm wide in the d-dimension. Fluids were driven through the device by syringe pumps. Pumping speeds were 10 to 520 nL/sec. The cross-sectional area of the main channel was ~ 0.075 mm2; thus the mean velocity ranged from 0.14 to 6.93 mm/sec. The two glass walls of the device can be replaced by less expensive and more robust Mylar if possible fluorescence of the material does not interfere with detection of the analytes. C) Block diagram of the apparatus employed to acquire the data presented below. Reagents were manually loaded into the fluid lines (polyetheretherketone tubing, Upchurch Scientific) and then pushed through the device using computer-controlled Kloehn syringe pumps. Fluorescein-labeled antigen flowing through the main channel of the T-sensor was excited using a 50 W halogen lamp (Zeiss) and the emission signal was magnified 10X using a Zeiss IM-35 inverted microscope, and captured using an integrating CCD camera (SBIG ST-7I). Initially a 20% dilution of the fluorescent phenytoin (fluorescein-labeled 5’5’diphenylhydantoin) reagent in 50 mM Tris-HCl pH 9.0 was used for LA (~50 nM based on comparisons with pure Fluorescein). |
One set of coupled experimental choices is the flow rates and the position down the channel from the entrance at which the measurements are made. If one ignores entrance and edge effects, moving further down the channel is equivalent to a later time in the solution to a one-dimensional diffusion experiment. Also, the concentration of Ab must be adjusted relative to that of the LA to optimize the assay sensitivity for a particular concentration of SA.
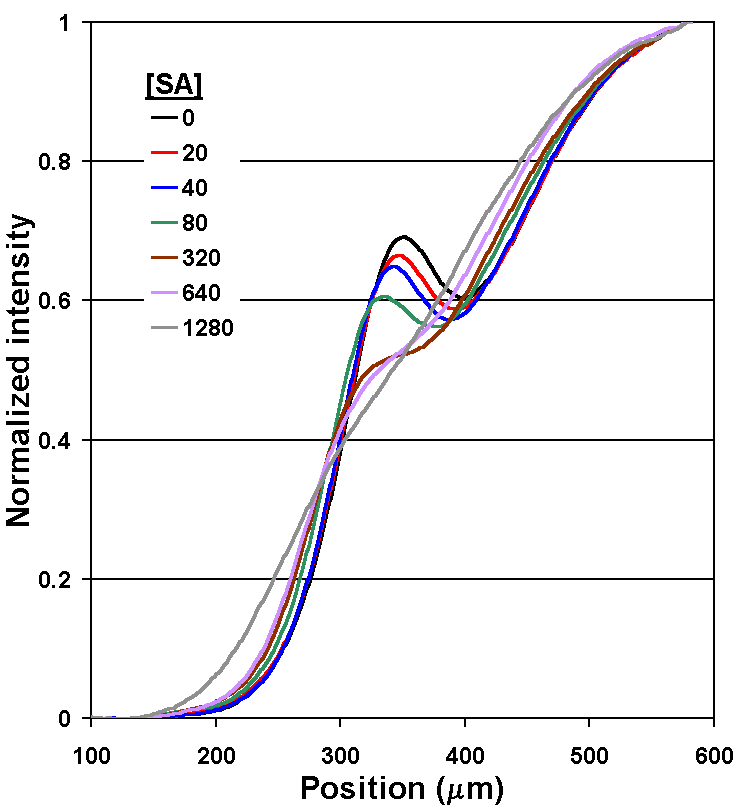
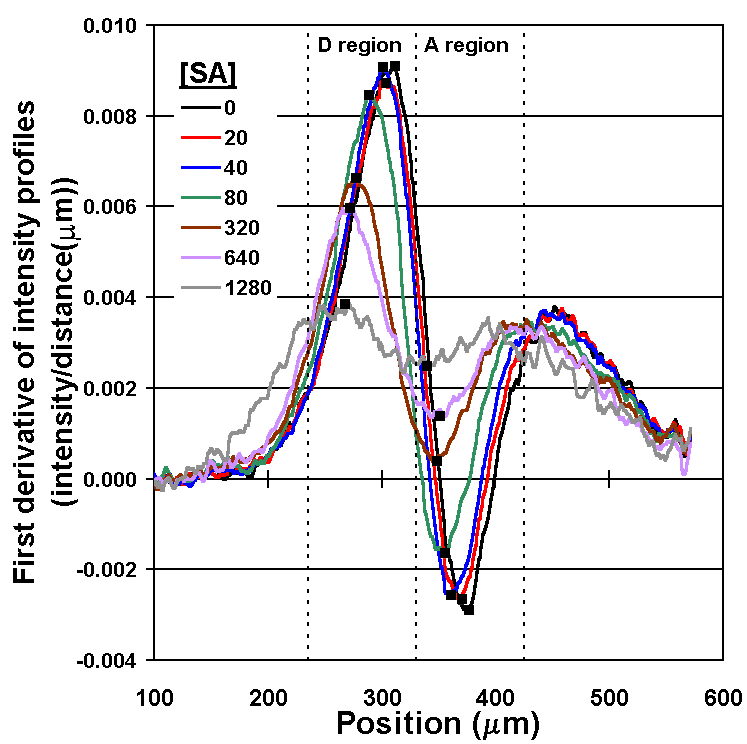
By measuring the "bump" in the concentration profile of LA, the concentration of the SA can be determined (Fig. 5A). Recall that the therapeutic range for phenytoin is 20 to 80 µm, so the assay in this form is already nearly 1000 times more sensitive than required. After comparing several methods for quantifying the concentration profile, we have settled on measuring the intensities of the first derivative curve of that profile; it allows a wide dynamic range and is relatively insensitive to fluctuations in the position of the interface between the two flow streams caused by bubbles or pump speed variations (Fig. 5B). A flow rate of 52 nL/s through the main channel was used, and measurements of the diffusion profile were taken at l = 10 mm. This corresponds to an average interdiffusion time of 14.4 seconds based on the time required for the bulk fluid to traverse the distance l at this flow rate (neglecting the short residence time in the developing flow region at the inlet junction).
 |
 |
|
Figure 5A. Experimental results of the phenytoin DIA under one set of reagent concentrations. Plots of fluorescence intensity profiles measured in the d-dimension of the T-sensor for [SA] from 0 to 1,280 nM. As predicted, when lower [SA] is present, a larger fraction of LA binds to available Ab binding sites. The slowed diffusion of LA upon binding results in an accumulation of LA near the center of the channel. |
Figure 5B. Plots of the first derivative of the intensity profiles (from Fig. 5A) with respect to distance in the d-dimension. Values used for the calibration curve (in Fig. 5C) are the differences between maximum values in the depletion region (D-region) and the minimum values in the accumulation region (A-region) marked (n ). Note as [SA] increases, a smaller fraction of LA binds to Ab binding sites, and the intensity profile of LA approaches that observed for free diffusion when no Ab is present. |
|
|
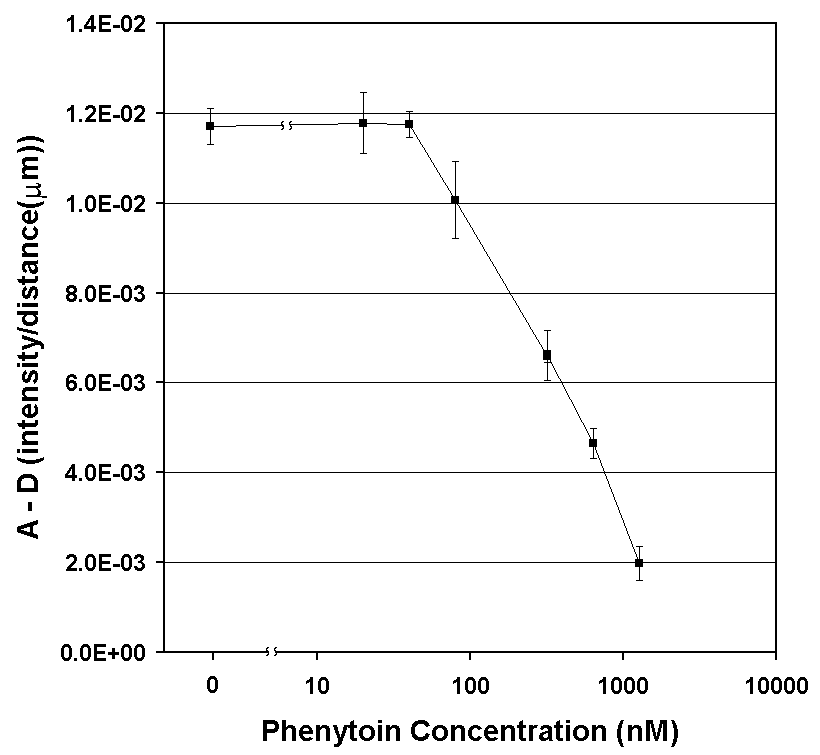
Figure 5C. DIA calibration curve: a plot of the DIA output parameter (from Fig. 5B) vs. the concentration of phenytoin, the SA. The DIA output parameter was derived by subtracting minimum values in the A-region from maximum values in the D-region. Error bars represent one standard deviation from the mean for 10 repeats, except the control ([SA] = 0) case, for which the experiment was repeated 20 times. The line is merely to guide the eye and has no significance in connecting to the 0 phenytoin point. Note that the 63 nM point is the first to be 2x above the noise level, and represents the limit of detection (LOD) for these experimental conditions. The points at lower concentrations (20 and 40 nM) are indistinguishable from the control. These data also (incorrectly) imply that the DIA is useful only over one order of magnitude of concentration of SA. As seen below, changing the concentrations of the reagents can improve the LOD and the dynamic range. |
The outcome is that for these experimental conditions concentrations of phenytoin between ~60 nM and 1.3 µm were easily measured within 20 seconds from the time the solutions entered the T-sensor channel. Most drugs currently monitored by immunoassays are within this concentration range in blood, and should be amenable to monitoring using this form of DIA. However, we suspected that we could do better than what is shown in Fig. 5C. To that end, the one-dimensional modeling program developed in our laboratory that was used to generate the data in Fig. 3 was used to create a general predictive model for the DIA (Fig. 6). It indicates that simple modifications of flow rates and/or device dimensions should allow the DIA to be extended to measurements over a very wide range of analyte concentrations.
|
|
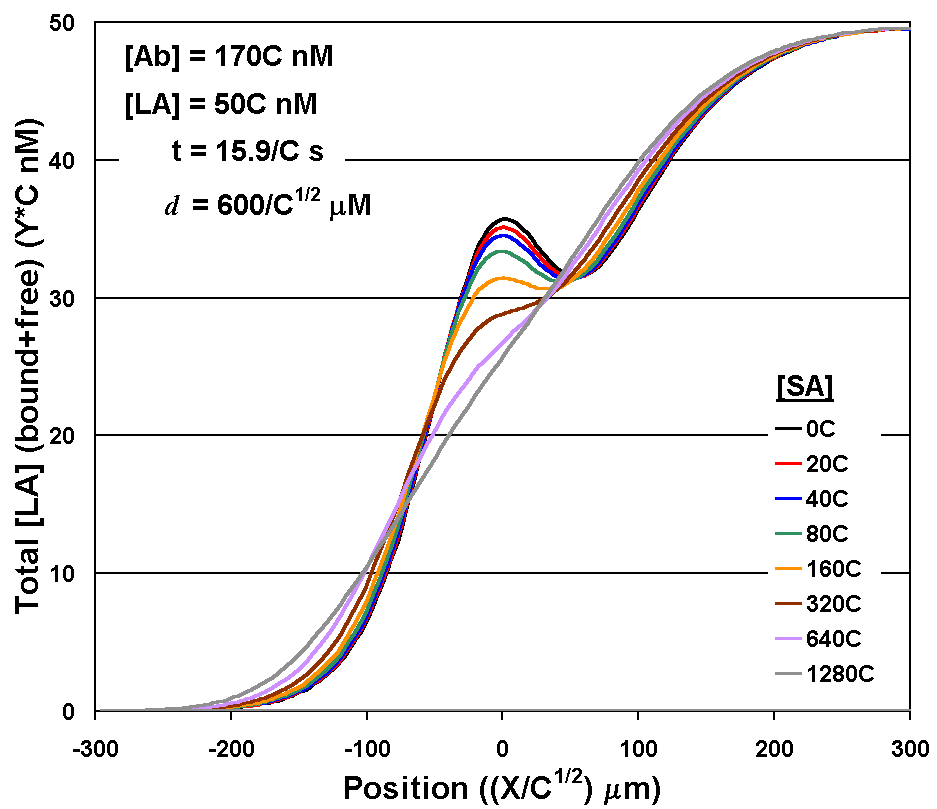
Figure 6. An analytical model for DIA development. Shown are diffusion profiles generated with a one-dimensional analytical model for the set of assay parameters used in the previous figures. The variable C is a non-dimensionalized parameter that can be used to set values for 5 related parameters to generate the set of diffusion profiles plotted. The 5 parameters are time, [SA], [LA], [Ab], and d. The model results (with C=1) are very similar to experimental results. If different device dimensions, diffusion coefficients, concentrations, binding kinetics, or assay times were desired, the analytical model can provide great insight to plan for such changes. For example, to generate a similar set of diffusion profiles with an SA range ten times as high (C=10), the dependence on other parameters requires concentrations of AB and LA ten times higher, interdiffusion time ten times shorter, and the distance of diffusion compressed by a factor of 101/2. |
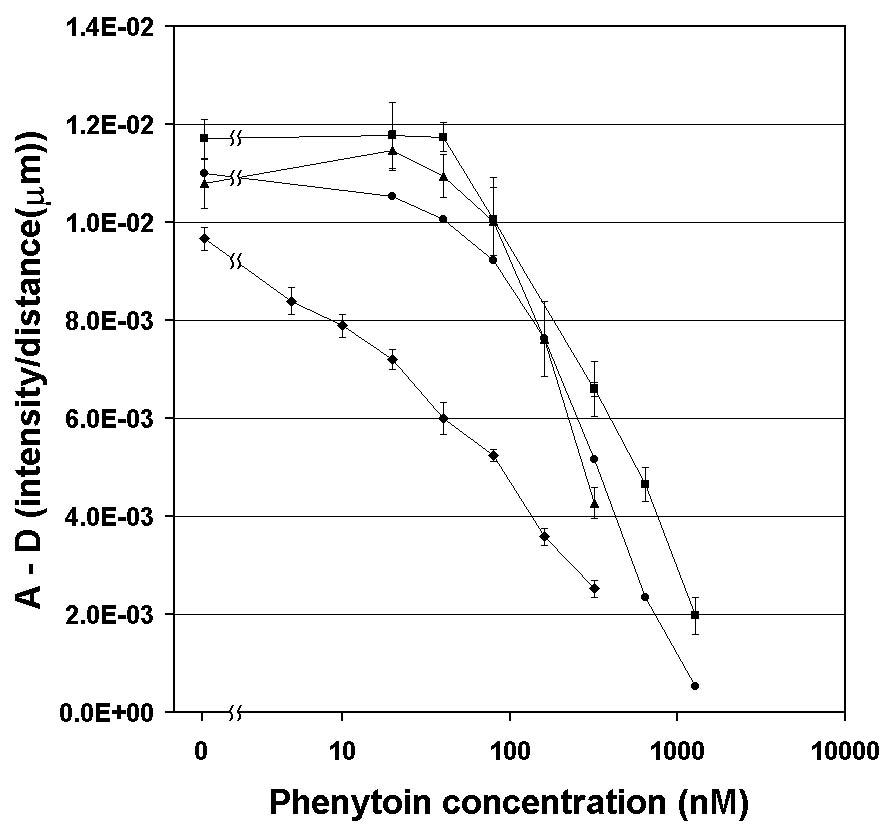
The 1D analytical model produces curves that are in excellent agreement with the experimental data in Fig. 5A&endash;those differences that remain can be largely attributed to shifts in the horizontal position of the curves due to slight variation in pump output over time. We then used the model to see if the flat region in the calibration curve below ~60 nM (see Fig. 5C) could be overcome (thus lowering the detectability limit) by changing the concentrations of the reagents. By further diluting the stock solutions (and thus lowering the concentrations of Ab and LA), it was possible to produce the data shown in Fig. 7. The ~ 50-fold reduction of the limit of detection to ~ 1 nM phenytoin and the 100-times-wider dynamic range of the assay were achieved with no change in the duration of the assay or alteration of the optical collection system.
|
|
Figure 7. Comparison of DIA calibration curves from model data (l ) (with no error bars), buffered phenytoin (n ) (as shown in Fig. 5C), and diluted serum calibration standards (s ) (at 20% LA and Ab stock). There is no significance to the lines connecting to the 0 phenytoin points. Note that all the curves under the original conditions are relatively closely spaced; differences between the model data and experimental data probably reflect the inability of the simple 1D model to accurately reflect the 3D flows in the T-sensor. Note that redesigning the assay to run with more dilute solutions (7.5%) of LA and Ab (u ) resulted in slightly lower signal strengths at all [SA], but a much wider dynamic range for SA detection (~3 orders of magnitude) as well as a nearly 50-fold decrease in the assay lower limit of detection to ~1 nM). This demonstrates the ability of the DIA to be tuned for different ranges of sample concentrations in biomedical samples. |
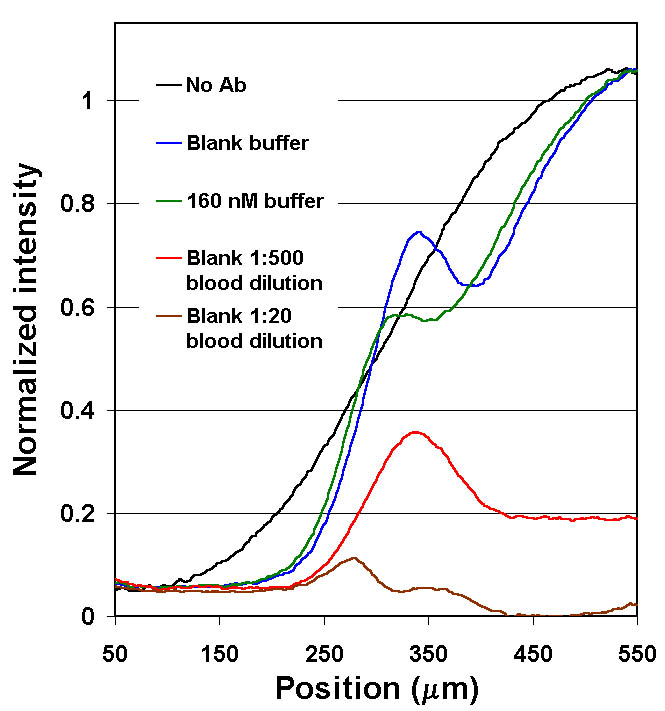
For an immunoassay to be of value for point-of-care diagnostics it must be able to cope with real clinical samples. We have made preliminary studies of the performance of the phenytoin DIA assay in the presence of serum, plasma proteins, and whole human blood. We were initially surprised by a great reduction of the fluorescence intensity from fl-phenytoin in the T-sensor experiments with whole blood and full-strength blood components (Figures 8 and 9). Presumably some component of human plasma and serum was capable of severely quenching fl-phenytoin. Subsequent experiments confirmed that this was also true in cuvette. Note, however, as shown in Fig. 8, that dilution of serum (or blood) by about 1000 fold (which would bring down the phenytoin concentration to the right range for assay to work) reduces the quenching substantially. (Note that the dilutions of the reagent stock solutions differ in Figures 8 and 9, so differences in the "control" curves are not significant.)
|
|
|
|
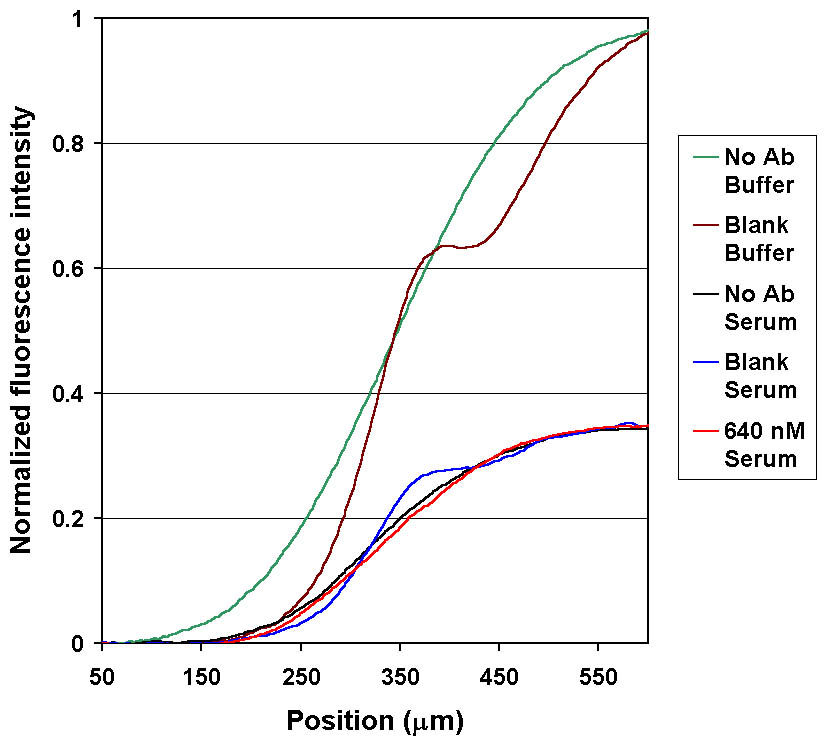
Figure 8. Quenching of fl-phenytoin (LA) in human serum causes changes in the DIA signal amplitudes. Fluorescence intensity profiles of buffered samples compared to samples of serum diluted 1:1000. LA was quenched ~65% in serum samples (the curves were normalized using buffered LA as a reference). Despite this quenching, the characteristics of the diffusion profile are still dependent on SA concentration. |
Figure 9. Quenching of fl-phenytoin in diluted whole blood (as compared to buffer). Note that almost complete quenching of the LA signal at the 1:20 dilution. At a 1:500 dilution, although there is severe quenching, a significant Ab-bound unquenched signal is observable, suggesting that an assay would be possible at these dilutions. See below for possible solutions to the quenching problem. |
Serial dilutions of whole blood with buffer (pH 8.0) were made to determine at what point diluting the unknown would overcome the observed quenching. A 200 µL volume of each diluted sample was mixed with 200 µL of a solution containing 50 nM fl-phenytoin. A sample of the blood was spun down to give a serum sample. The serum was serially diluted in the same manner as the whole blood and the quenching was measured. The quenching seen in serum was nearly identical to the quenching seen in whole blood.
Arbitrary dilution of the sample to avoid quenching is not a satisfactory solution for all analytes, particularly those at lower concentrations. As a first step to reverse the quenching, an attempt was made to determine which component in whole blood was responsible for quenching of fl-phenytoin. Literature review suggested that human serum albumin (HSA) may quench the fl-phenytoin . Support for the theory that a high molecular weight component such as HSA was responsible was found in the diffusion profiles of DIA measurements using dilute whole blood and serum samples shown in Figs. 8 and 9. For both serum and whole blood, the LA was quenched >60% while it remained within the serum or blood flow streams. However, when fl-phenytoin diffused away from the blood or serum (in the interdiffusion region), the signal level rose. The shapes of the diffusion profiles (at dilution levels > 1:20) are similar to those of buffered samples, despite the quenching effects. For the two concentrations of phenytoin tested (0 and 640 nM) sample antigen had the expected effect on the diffusion profiles.
Serial dilutions of bovine serum albumin (BSA) were similarly tested; quenching, while present, was much less severe than that found in human serum or blood. Human serum albumin was tested in serial dilution at two different initial concentrations; the quenching closely paralleled that seen in serum and in whole blood. The two initial concentrations represent the extremes of the normal range of human serum albumin concentration. The similarity of these two curves indicates that patient variation in albumin concentration should not effect the T-sensor data. Quenching curves for whole blood, serum, HSA, and BSA are shown in Fig. 10.
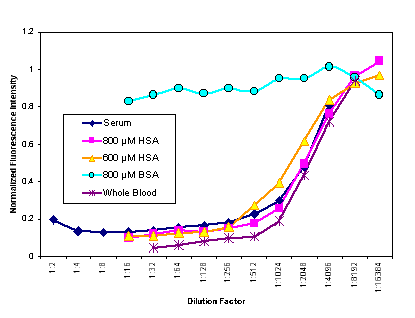 |
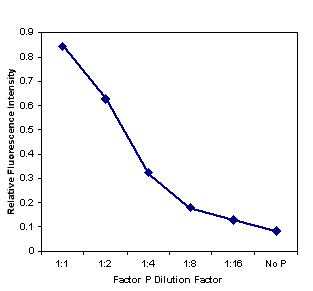
Figure 10. Fractional quenching of fl-phenytoin vs. the dilution factor (in buffer) of human blood, human serum and pure serum albumin solutions (human and bovine) as measured in a fluorimeter. The two HSA concentrations bracket the normal human serum values. (Excitation 494 nm, emission 500-540 nm.) Dilutions were in 50 mM sodium phosphate and 75 µM NaCl. Each diluted sample was mixed with the same fl-phenytoin solution. These data together with literature information strongly support the conclusion that the component in blood that quenches fl-phenytoin is HSA. |
Attempts were made to limit this quenching. Neither myristic acid (which binds to one class of HSA sites) at 50 µM nor the pH indicator methyl red (which binds to HSA at the same location as phenytoin but has an association constant two orders of magnitude greater) at 500 µM was able to appreciably reverse the quenching of fl-phenytoin by HSA. However, a reagent referred to as "the P reagent" is included with commercially available phenytoin analysis kits. The contents of reagent P are listed only as "buffered surfactant." It is suspected that this reagent is included by the manufacturers to eliminate quenching, either by denaturing albumin, or by competing for the phenytoin binding site. This reagent was added in serial dilution beginning with a volumetric ratio of 1 part P reagent to 1 part 50 µM HSA. The degree of quenching is shown in Fig. 11. We conclude that quenching can be almost completely reversed by adding detergents. We will adopt this strategy to overcome this quenching problem and other similar problems that may arise with other LA molecules.
|
|
Figure 11. Fractional quenching of fl-phenytoin by HSA vs. dilution of "factor P", a surfactant. Factor P was diluted with 50 µM HSA in sodium phosphate buffer, and mixed with fl-phenytoin. Nearly full recovery of the fluorescence of fl-phenytoin was recovered when factor P was used 1:1 with the HSA. The fact that factor P eliminates the quenching normally observed with 50 µM HSA, combined with the fact that factor P is used in commercial FPIA experiments (and therefore must not substantially disturb the binding of fl-phenytoin or phenytoin itself to the antibody provided in the kits) suggest that detergents are very promising as agents to prevent HSA-based quenching. |
The initial DIA work, which is now proceeding under support of NIH, has been published recently in Nature Biotechnology.
A rapid diffusion immunoassay in a T-Sensor, Hatch, A., Kamholz, A.E., Hawkins, K.R., Munson, M.S., Schilling, E.A., Weigl, B.H. and Yager P., Nature Biotechnology, 19(5), 461- 465 (2001)
|
|
Return to Microfluidics Home Page Return to Yager Group Home Page
|