What We Do
Introduction
Microcellular foams refer to thermoplastic foams with cells of the order of 10 µm in size. Typically these foams are rigid, closed-cell structures; although recently there is much interest in creating open-cell, porous structures that have cells in this size range. The microcellular process that sparked the growth in this field over the past two decades was invented at Massachusetts Institute of Technology, USA, in early eighties [1], in response to a challenge by food and film packaging companies to reduce the amount of polymer used in their industries. As most of these applications used solid, thin-walled plastics, reducing their densities by traditional foaming processes that produced bubbles larger than 0.25 mm was not feasible due to excessive loss of strength. Thus was born the idea to create microcellular foam, where we could have, for example, 100 bubbles across one mm thickness, and expect to have a reasonable strength for the intended applications.
It would be reasonable to say that the potential of microcellular foams has yet to be realized. These materials have not yet appeared in mass produced plastic items, and the promised savings in materials and associated costs have yet to materialize. This is largely due to manufacturing difficulties encountered in scaling up for large scale production. However, enthusiasm for these materials remains high, and today researchers and commercial enterprises on every continent are in a global race to harness the potential benefits.
Much has been learned about the processing and properties of microcellular foams since the first patent was granted in 1984 [2]. An early review of the subject appeared in 1993 [3]. In this chapter the state-of-the art of processing will be reviewed in the next section, followed by a discussion of structure and properties. This chapter will conclude with a look at some of the current research directions involving microcellular technology.
Properties of Microcellular Foams
Although innovations in processing have developed at a rapid pace, the property data on microcellular foams has been slow in coming. The early publications on microcellular foams conjectured that the microcellular structure, believed to be on a scale that was smaller than the critical flaw size for polymers, would enable these foams to retain their mechanical properties even as the density was reduced. No quantitative information on the critical flaw size was ever presented, nor was any property data presented in support of the hypothesis. This is likely to be due to the emphasis placed on process development, as opposed to property characterization, in the early years of evolution of this field. Over time, however, this conjecture has become a myth that microcellular materials are as strong as the solid polymers but have a lower density, thus providing an opportunity to lower costs with no penalty in performance.
The tensile property data [4] shows that the tensile strength of microcellular foams decreases in proportion to the foam density, and can be approximated quite well by the rule of mixtures. Thus a 50% relative density foam can be expected to have 50% of the strength of the solid polymer. Figure 11.5 shows relative tensile strength as a function of relative foam density for a number of microcellular polymers. In this figure the relative tensile strength, is obtained by dividing the tensile strength of the foam by the tensile strength of the solid polymer. Similarly, the relative density is foam density divided by the solid polymer density. In Figure 11.6 we have plotted the strength data on a specific basis. Thus the specific relative tensile strength for the foam of a given relative density is obtained by dividing the relative tensile strength by the relative density. Figure 11.6 shows that on a specific basis, the tensile strength of microcellular foams is essentially constant over the entire range of foam densities. Unfortunately, similar data on conventional foams is not readily available for a direct comparison with microcellular foams.
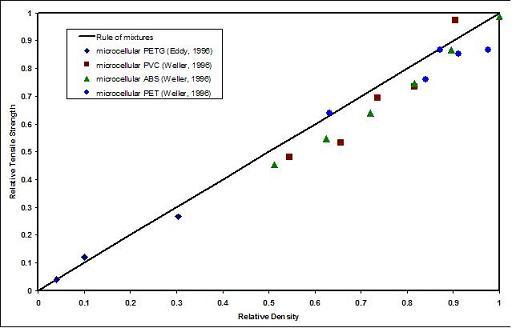
Figure 11.5 Tensile strength data on microcellular foams produced by the batch process. The tensile strength is closely approximated by the rule of mixtures over the entire range of foam densities.
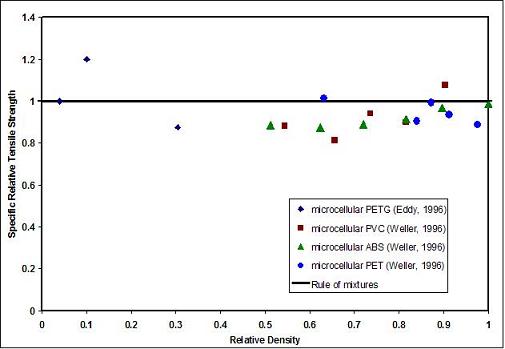
Figure 11.6 Plot of specific relative tensile strength as a function of relative density of microcellular foams. Note that specific strength is essentially constant over a wide range of foam densities.
A unique aspect of data in Figure 11.5 is that in the relative density range of 0.1 to 0.5, the microcellular foams represent novel materials for the engineer with properties not previously available. Most conventional foams fall either in the low-density region (relative density less than 0.1) or belong in the structural foams category (relative density greater than 0.5). The modulus of microcellular foams can be reasonably estimated by the Gibson-Ashby cubic cell model [5], which predicts that the relative tensile modulus equals the square of the relative density. The gas composition in the cell may affect the long term thermal conductivity of the foams [6]. Microstructures, tensile strength, and thermal expansion properties for a number of low density foams have been reviewed by Williams and Wrobleski [7].
Fatigue and creep behaviours of microcellular polycarbonate foams have been investigated [8-10]. An interesting result from fatigue studies is that introduction of very small bubbles in PC, with less that 1% reduction of density, led to a thirty-fold increase in fatigue life compared to the solid PC. This might suggest a process similar to heat treatment of metals, where a PC part may be saturated with carbon dioxide at 5 MPa and then heated to say 60 ºC to introduce the microcellular structure without an appreciable density change, to increase the fatigue life of a part. Due to the low processing temperatures, very little dimensional change was observed in the experiments.
The tensile data for all gas-polymer systems investigated falls on one reduced plot where relative tensile strength can be plotted against the relative density, as is shown in Figure 11.5. However, energy absorption measures, such as an impact test, are more sensitive to variations from polymer to polymer, and the results cannot be generalized. Figure 11.7 shows Gardner Impact Strength for PVC foams [11] with relative densities of 0.5 and higher. It is seen that the impact strength decreases linearly with foam density. This result is contrary to the popular belief, long held without proof, that the microcellular structure will always improve the energy absorption behavior due to the increased resistance to crack propagation offered by the micro voids [12].
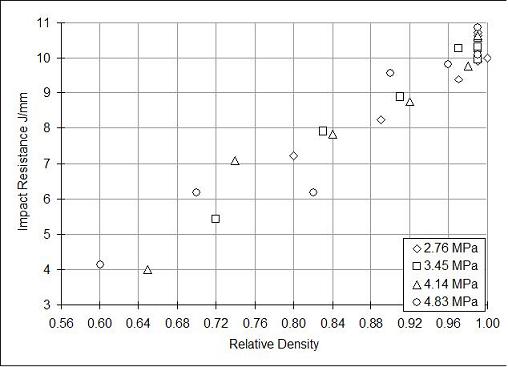
Figure 11.7 Gardner impact strength of microcellular PVC foams as a function of foam relative density. The impact strength is seen to be independent of the saturation pressure used to prepare the foam specimens [11].
Another point to note from Figure 11.7 is that the gas saturation pressure used to prepare the foam specimens appears to have no significant effect on the impact resistance. Such is not the case for the impact resistance of CPET foams [13], shown in Figure 11.8. We find that foams prepared at 5 MPa carbon dioxide pressure have significantly higher impact strength than the foams prepared at 3 or 4 MPa pressure. In this system, there is crystallization of CPET at 5 MPa, that changes the composition of foam matrix, and results in entirely different properties compared with virgin CPET. Thus, impact results can vary even qualitatively from polymer to polymer.
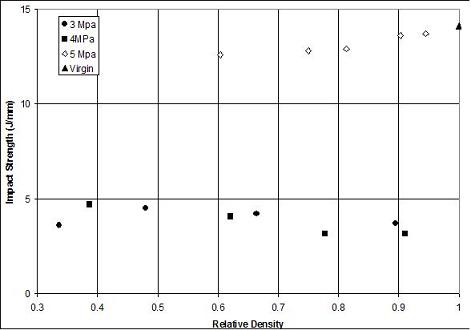
Figure 11.8 Gardner impact strength of CPET microcellular foams as a function of foam relative density. Note that specimens prepared at 5 MPa saturation pressure has significantly higher impact strength compared to those prepared at 3 or 4 MPa. There was carbon dioxide induced crystallization of CPET at 5 MPa [13].
Figure 11.9 shows a comparison of the impact strength of PVC and CPET microcellular foams. It can be seen that at a given relative density the CPET foams possess a higher impact resistance. The Gardner impact data presented should only be used for relative comparison of materials. The engineer and designer is warned against using these data in design, for the impact conditions in actual use are likely to be significantly different from the idealized conditions for the Gardner test.
Figure 11.9 A comparison of Gardner Impact data on PVC and CPET. The CPET microcellular foams retain a larger fraction of the impact strength of the virgin polymer compared to PVC microcellular foams [12].
References
- J. Martini, F.A. Waldman and N.P. Suh, Proceedings of SPE Antec 82, San Francisco, CA, USA, 1982, 674.
- J.E. Martini-Vvedensky, N.P. Suh, and F.A. Waldman, inventors; Massachusetts Institute of Technology, assignee; US 4,473,665, 1984.
- V. Kumar, Progress in Rubber and Plastics Technology, 1993, 9, 1, 54.
- V. Kumar, M. VanderWel, J.E. Weller, and K.A. Seeler, Journal of Engineering Materials and Technology, 1994, 116, 439.
- L.J. Gibson and M.F. Ashby, Cellular Solids, Structure and Properties, 2nd Edition, Cambridge University Press, Cambridge, UK, 1999.
- W. Albrecht, Cellular Polymers, 2000, 19, 5, 319.
- M.J. Williams, and A.D. Wrobleski, Journal of Materials Science, 1989, 24, 11, 3799.
- V. Kumar, and K.A. Seeler, Proceedings of SPE Antec 93, New Orleans, LA, USA, 1993, Volume 2, 1823.
- G. Wing, A. Pasricha, M. Tuttle and V. Kumar, Polymer Engineering and Science, 1995, 35, 8, 673.
- W.D. Armstrong and V. Kumar, Journal of Polymer Science: Polymer Physics Edition, 2000, 38, 5, 691.
- R.P. Juntunen, V. Kumar, J.E. Weller and W.R. Bezubic, Journal of Vinyl and Additive Technology, 2000, 6, 2, 93.
- V. Kumar, Proceedings of the SPE Antec 2002, San Francisco, CA, USA, 2002, 1892.
- V. Kumar, R.P. Juntunen and C. Barlow, Cellular Polymers, 2000, 19, 1, 25.