|
Statistical Algorithms
Drag the blue line in either graph to make error (the red in the meter) smaller.
Interactive graphs give students an intuitive understanding of complex algorithms such
as minimizing sums of squares in regression.
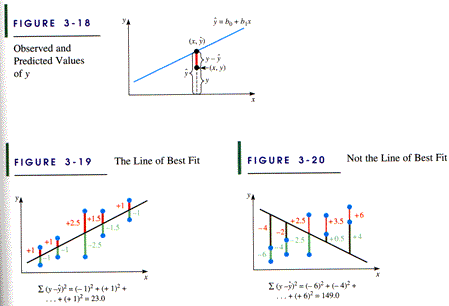
These continuously variable graphs replace the few static graphs
of such algorithms possible in printed textbooks such as:

Source: Just the Essentials of Elementary Statistics by Johnson and Kuby. © 1999, Duxbury Press. (p. 135)
|