absolute
error: The difference, without sign, between the actual value and a
statistically determined model value.
![]()
alpha: The probability that the statistical test will incorrectly reject the null hypothesis.
analysis of variance (ANOVA): A statistical method for comparing the means of multiple groups.
average: Another name for the
mean. The sum of all the data values divided by the number of
data values.
![]()
beta: The probability of making a Type II error when making a statistical hypothesis test. One minus this probability is power, the probability of correctly rejecting the null hypothesis.
binomial distribution: The probability distribution describing the number of events (e.g., heads for coin flips) in a given number of trials for a specified probability of the event happening on each trial.
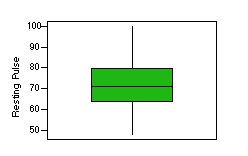
box plot:
The box represents the middle 50 percent of the data values; that is, the data values
from the first to third quartiles. The line or dot in the middle of the box denotes
the median. Whiskers--lines extending from
the box--extend either to the limits of the data or to a maximum length equal to 1.5 times
the length of the box. In the latter case, points beyond the lines indicate outliers.
categorical variable: The values of a categorical variable are discrete categories. Usually the categories cannot be ordered from "highest" to "lowest" in any meaningful way. Rather, the categories just define different groups. Gender and Religion are examples of categorical variables. Compare continuous variable. See also variable.
Central Limit Theorem: No matter what the initial probability distribution of individual observations, the sampling distribution of the means of samples of observations from that distribution will increasingly approximate a normal distribution as the sample size increases.
chi-square test: A statistical test for determining whether two categorical variables are related.
confidence interval: All the values for a parameter that would not be rejected if they were used as the null hypothesis in a statistical test of that parameter. A 95-percent confidence interval includes all those values that would not be rejected with p = .05.
contingency coefficient: Quantifies the degree of relationship between two categorical variables
continuous variable: The potential values of a continuous variable are numbers which can be meaningfully ordered from "highest" to "lowest." Age and Gross Domestic Product are examples of continuous variables. Compare categorical variable.
control group: A control group in an experiment receives no treatment. We compare the control group to a treatment group to see if the treatment had an effect, either positive or negative.
correlation coefficient: A measure of the degree to which two variables co-relate. If there is no relation (i.e., if the variables are independent) then the correlation coefficient is zero. See Pearson correlation coefficient for a particular example.
covariance: Assesses the degree
to which two variables co-vary or vary together. If the two variables are independent
then the covariance will equal zero. It is computed as the mean of the products of the
mean deviations for each variable.
critical value: The critical value of a test statistic defines the cutoff between statistically significant and not statistically significant. With probability alpha, the critical value is exceeded by chance when the null hypothesis is true.
cumulative frequency: The total number of observations with values from the minimum up to a certain value.
cumulative probability: The sum of the probabilities from the minimum possible value up to a certain value.
degrees of freedom: The number of independent pieces of information available in the data after various summary statistics have been calculated. For example, if we know the mean for a set of data values, then after seeing n - 1 of the data values, we would be able to determine the last one from the mean. For t-test comparisons of two means, there are n - 2 degrees of freedom because two summary statistics have been calculated.
dependent variable: A variable observed in an experiment that is not under the direct control of the experimenter. Compare independent variable.
discrete variable: A variable that can have only certain discrete values. The same as a categorical variable.
dot plot: A simple graph in
which each observation is represented by a dot at its score. For example, the scores
produce this dot plot:

error: The error for an observation
is the amount by which a model
of the data misrepresents the data value. That is,
Error is also used to refer to the total error or all the individual errors added up in
some way.
![]()
where ![]() is the predicted value from a model such as the median,
mean,
or the prediction from a regression model.
is the predicted value from a model such as the median,
mean,
or the prediction from a regression model.
F distribution: A probability distribution for ratios of variances. Most commonly used in analysis of variance to compare the ratio of the variance of the means from a number of groups to the expected variance of those means if all the groups were the same.
frequency: The number of times a certain data value occurs in the set of observations.
Gaussian distribution: Another name for the normal distribution.
heteroscedasticity: Data are heteroscedastic when the variances within groups of observations are unequal. Data in a regression are heteroscedastic when the variance of the dependent variable depends on the level of the independent variable. Data in a t-test or analysis of variance are heteroscedastic when the variances of the observations within each group are unequal across groups.
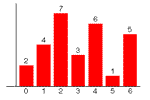
histogram: A plot of
the frequencies of data values in a set of observations.
hypothesis test: A test of whether the null hypothesis should be rejected based on the data.
independent variable: In an experiment, the levels of independent variables are controlled by the experimenter. Independent variables serve as inputs. Compare dependent variable.
intercept: In the following equation for a line such as a regression model, the parameter a is the intercept:
![]()
The intercept describes the value of Y when X = 0. In a graph, it is where the line crosses or "intercepts" the Y-axis. Compare slope.
interquartile range (IQR): The difference between the 3rd quartile (Q3) and the 1st quartile (Q1). The indicates the range of scores spanned by the middle half of the data values. The IQR is represented by the box in a boxplot.
Kruskal-Wallis test: A nonparametric statistical procedure for comparing medians across groups.
lower quartile: The lowest 25 percent of the scores are equal to less than the lower quartile score. Often represented as Q1 and is equal to the 25th percentile.
maximum: The largest data value in a set of observations.
mean: The average of the data values, that is,
the sum of all the data values divided by the number of data values.
![]()
The mean
makes the sum of squared errors as small as possible.
median: The middle data value in a set of observations. To find the median, re-order the data from smallest to largest and find the middle observation; that is the median. If there are an even number of observations, then there will be two middle values; in that case, the average of those two middle values is the median. The median is also the 50th percentile.
median absolute deviation (MAD): The median of all the absolute errors or deviations. The MAD describes the spread of the data values away from the model value.
minimum: The lowest data value in a set of observations.
mode: The most frequently occurring value in a set of data.
model: Specifies a predicted or representative value for each observation in a data set. Simple models are the mean or the median for a set of observations. More complex models are, for example, regression lines.
nominal variable: Same as categorical variable. Levels of these variables are noms or names. For example, the names for the levels of the gender variable are "male" and "female."
nonparametric statistics: Statistical methods which make no assumption that the data are from a normal distribution.
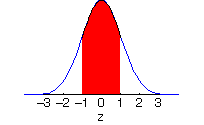
normal distribution: The
probability distribution that describes or approximates the distribution of many variables.
Most observations in a normal distribution occur near the mean.

The area under the curve between two values represents the probability that a random observation from the normal distribution would fall between those two values.
null hypothesis: The hypothesis that nothing is happening in the data that would not be expected by chance. Some null hypothesis are (a) the means of two groups are equal, (b) the slope in a simple regression is zero, (c) the correlation between two variables is zero, and (d) the classifcation of the data according to one nominal variable is independent of the classifcation of that data according to a second nominal variable.
observation: A person, place, or thing for which a data value is available or is measured.
one-tailed test: A one-tailed test considers whether the null hypothesis might be wrong in precisely one direction direction; that is, it allows the possibility that the true parameter might be different from the value of the null hypothesis in only one direction--either only above or only below the value of the null hypothesis. Compare two-tailed.
ordinal variable: A variable whose values indicate only rank and not the distance between values. For example, in a race, an ordinal variable would indicate who was first, second, third, etc., but would not give the time or distance between the racers.
outlier: An extreme or atypical value that is very different from other data values in the set of observations.
p-value: The p-value for a particular value of a statistic is the probability of obtaining a value for the statistic that extreme or more extreme if the null hypothesis were true. If the p-value is less than a specified value (usually .05, but sometimes .01), we reject the null hypothesis.
parameter: An unknown value in a model that is estimated from the data. Examples: mean, median, intercept, slope.
Pearson
correlation coefficient:
The Pearson correlation coefficient--usually represented by the symbol r--measures
the linear relationship between two variables. Values of the correlation coefficient are always
between -1 and +1, inclusive. The value r = 0 indicates no relationship
between the two variables. Positive values of r imply that higher values
on one variable are associated with higher values on the other variable. Negative values
of r imply that higher values on one variable are associated with lower values
on the other variable. The value r= +1 indicates a perfect
positive linear relationship and r = -1 indicates a perfect negative
linear relationship between the two variables. Definitional formula in terms of
z-scores:

and in terms of covariance and standard deviations:
percentile: The Pth percentile data value is the score that is equal to or greater than P% of all the data values. For example, the score equal to the 25th percentile is equal to or greater than one quarter of all the data values (and is also the first quartile). The 50th percentile necessarily is the median.
population: The set of all possible observations. Compare sample.
power: The probability that a statistical test will reject the null hypothesis given that some specific alternative model is true. Equivalently, the probability that a Type II error will be avoided.
probability: The likelihood that some event will randomly occur.
probability distribution: A description of the probabilities for a number of events will occur or that specific data values will occur.
quartiles: Scores that divide all the scores into four quarters. One fourth of the data values are equal to less than the first or lower quartile (Q1), one half of the values are equal to or less than the 2nd quartile (Q2, also known as the median), and three fourths of all the data values are equal to or less than the third or upper quartile (Q3).
R-squared: A coefficient indicating the degree to which one variable predicts another or is related to another. R-squared varies between 0 (no relationship, no prediction) to 1 (perfect prediction).
random sampling: A random selection of possible observations.
range: The difference between the maximum and minimum data values. If the maximum were 90 and the minimum were 10, the range = 90 - 10 = 80.
ranks: Data values which indicate only the order of the observations. See ordinal variable
regression coefficients: The parameters in a regression equation. For a simple regression, these are the slope and the intercept.
residual: The difference between a data value and the prediction from a model. See error.
sample: A sample is a selection of observations from a larger population of all possible observations. Ideally, the sample is selected randomly from the population.
sampling distribution: The probability distribution of the statistic one would get by sampling over and over again.
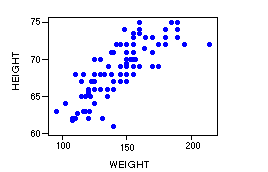
scatterplot, scattergram:
A two-variable plot in which each point represents the levels of an observation on each
variable. Often the variable on the horizontal axis is to be used to predict the variable
on the vertical axis. Scatterplots are useful for viewing correlations
and for simple regression.
significance level: The pre-specified probability of a Type I error below which the null hypothesis is considered to be so rare as to be implausible.
significant: When the probability of obtaining a statistical value is below the significance level, the statistic is said to be "statistically significant."
simple regression: Fitting a line to the data such that
![]()
where a is the intercept and b is the slope.
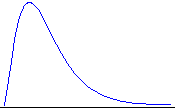
skewed: A skewed
distribution is not symmetric. That is, it has different
shapes on each side of the median. For example:
slope: In the following equation for a line such as for a simple regression model, the parameter b is the slope.
![]()
The slope describes how much Y increases (decreases, if its sign is negative) as X increases by 1 unit. Compare intercept.
squared error: The error for an observation is squared or multiplied by itself. This has the effect of increasing the penalty for large errors.
![]()
standard deviation:
The standard deviation is the square root of the variance and
describes the typical or "standard" deviation of the data values from the
mean.

standard error: The standard deviation of the sampling distribution for any given statistic.
standard error of mean: The standard deviation of the sampling distribution of the mean.
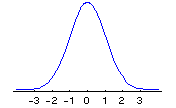
standard normal
distribution: A normal distribution
with mean 0 and standard deviation 1.
sum of squares : The squared error for each observation summed across all observations. Least-squares statistics such as the mean and regression minimize the sum of squared errors, which equals:
![]()
symmetric:A symmetric distribution has the same shape on each side of the median. The normal distribution is an example of a symmetric distribution. Compare skewed
Type I error: Incorrectly rejecting the null hypothesis when the null hypothesis is true; a "false alarm." Compare Type II Error.
Type II error: Failing to reject the null hypothesis when the null hypothesis is false; a "miss." Compare Type I Error.
two-tailed test: A two-tailed test considers whether the null hypothesis might be wrong in either direction; that is, it allows the possibility that the true parameter might be either above or below the value of the null hypothesis. Compare one-tailed.
upper quartile: The 75th percentile. The observation that is greater than equal to 75 percent of the observations and less than 25 percent of the observations. Sometimes designated by Q3.
variable: A characteristic, trait, attribute, or measurement that can take on different values. A variable must vary, having at least one value for some observations and another value for other observations.
variance: The typical or average squared error. For a population, the sum of squared errors is divided by n, the number of observations. More often, interest is in the sample estimate of the variance in which case the sum of squared errors is divided by n - 1. That is,

z-score formula: The z-score is the difference between the observation and the mean, divided by the standard deviation. That is,
![]()
The z-score tells how far an observation is from the mean in terms of standardized units.