![]()
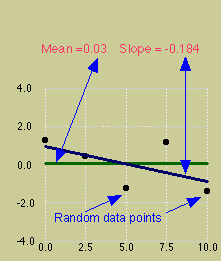
The set of data (or the last set of data if multiple sets have been generated) is displayed in the left graph. The mean and the slope for the best-fitting line are displayed.
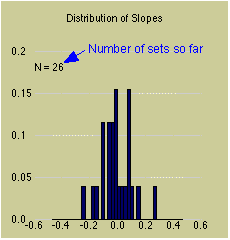
The histogram on the right of the main graph keeps track of the distribution of the slopes. Keep pressing the "100 Sets" button until the shape of this distribution is clear.