JmpIn

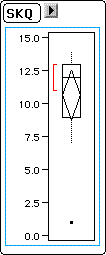
Note: JMP's box plot has some additional features. The median is indicated by the
horizontal line in the box. The red bracket beside the box indicates the shortest half
(the most dense 50 percent) of the observations. The center of the diamond is the
mean and the diamond extends to the end of the 95-percent confidence interval, which
is explained in a later chapter.
Return to Top
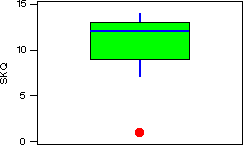
Minitab

Return to Top
Excel
Excel has no procedures for constructing box plots.
Return to Top