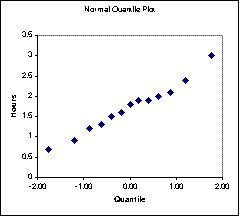
Note: The DataAnalysis toolpack does not contain any procedures for producing Normal Quantile
plots directly. However, they are easy to generate. Sort the column of data variables
from smallest to largest. Construct a column INDEX running from 1 for the smallest to
n for the largest data value. Construct a new column P = (INDEX - .5)/N where N is the
number of observations. Construct a new variable QUANTILE = NORMINV(P,0,1) where P refers
to the P column. Finally, use the ChartWizard to plot the Data column against the QUANTILE
column.
A sample spreadsheet for constructing a Normal Quantile plot
is available as hoursQQ.xls.
Return to Top