|
The normal distribution is
very useful for telling us how likely are ranges of possible scores. The proportional area
under the normal density curve between two scores corresponds to the probability of
getting a score in that range. The total area under the curve is of course 100 percent. The mean
and the median are the same for the normal distribution, so 50 percent of the scores are equal to
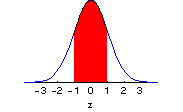
or below the mean as depicted in this graph.  As can be seen in this
graph, a large proportion of the observations are likely to occur between z-scores of -1
and +1 (that is, to be within one standard deviation of the mean). Estimate the
approximate proportion depicted; later we will calculate it exactly using the interactive
graphs below. As can be seen in this
graph, a large proportion of the observations are likely to occur between z-scores of -1
and +1 (that is, to be within one standard deviation of the mean). Estimate the
approximate proportion depicted; later we will calculate it exactly using the interactive
graphs below.
Use this graph to calculate z-scores and to see the corresponding
probabilities. Any number can be changed, but the change will not be effective until you
press the return key while in one of the boxes. You may also change the portion of the
normal distribution selected: |