Electronic Supplement to
Comparison of earthquake source models for the 2011 Tohoku event using
tsunami simulations and near field observations
by Breanyn T MacInnes, Aditya Riadi Gusman, Randall J LeVeque, Yuichiro Tanioka
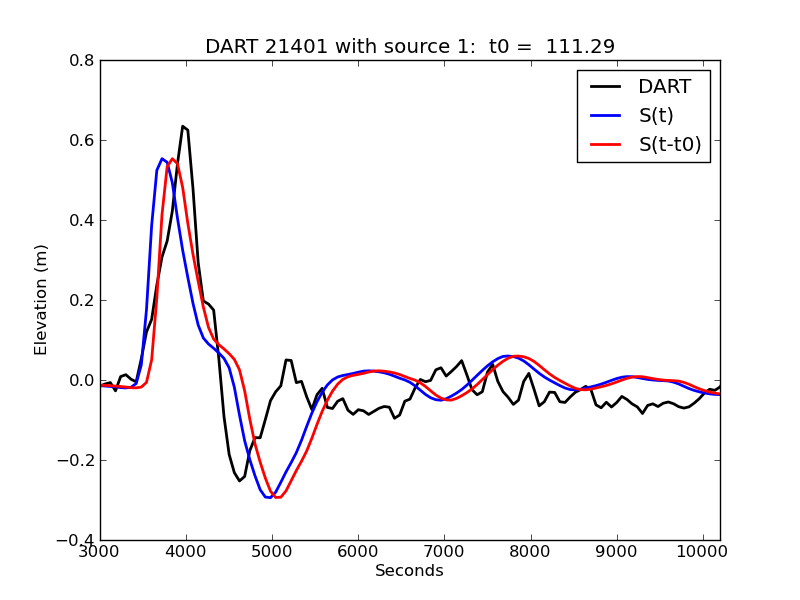
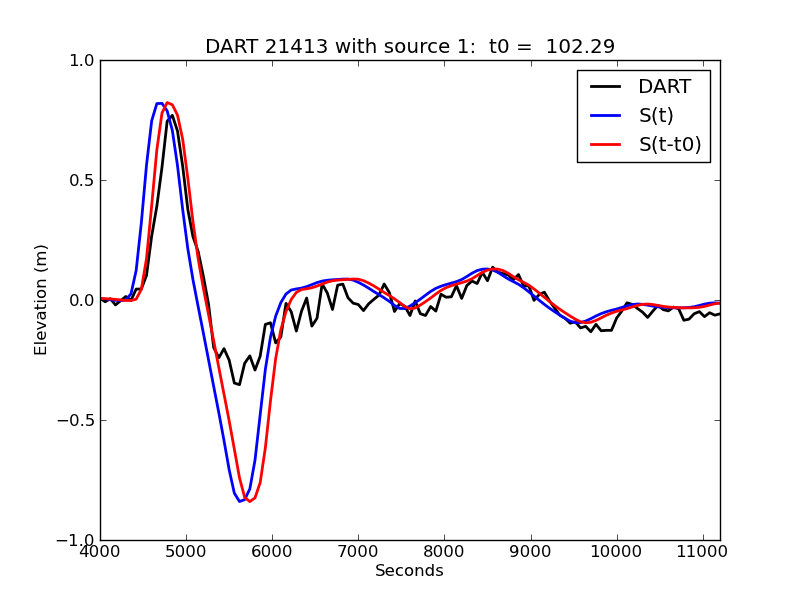
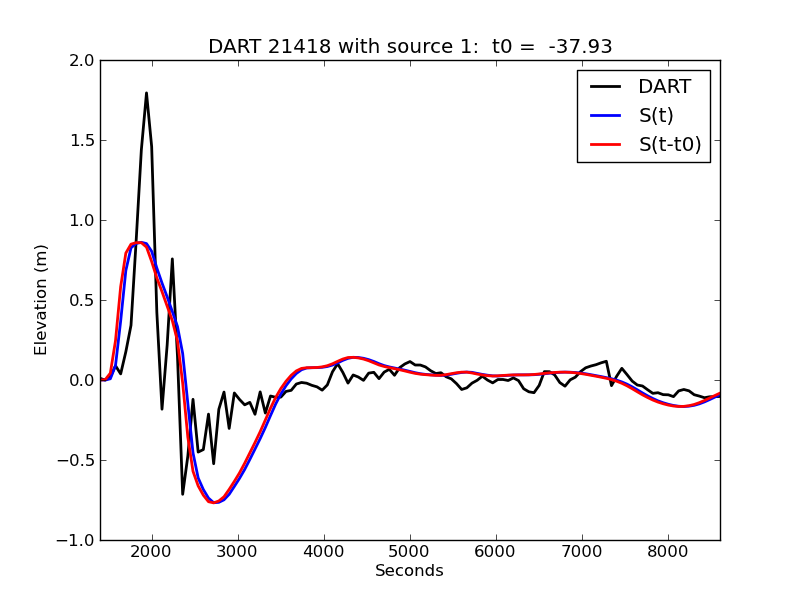
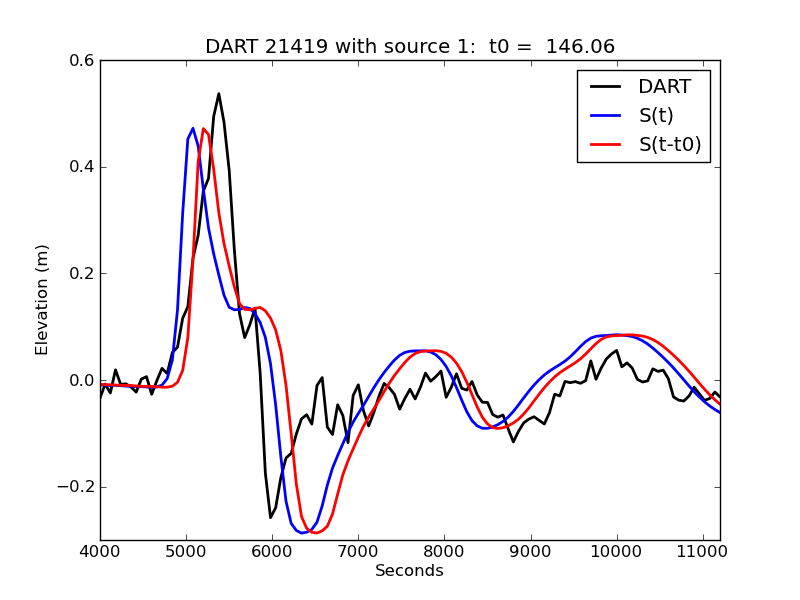
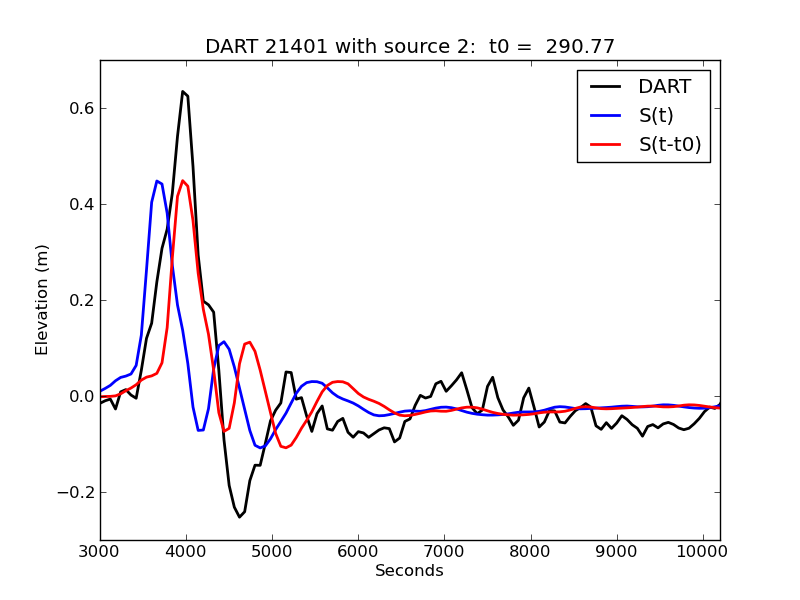
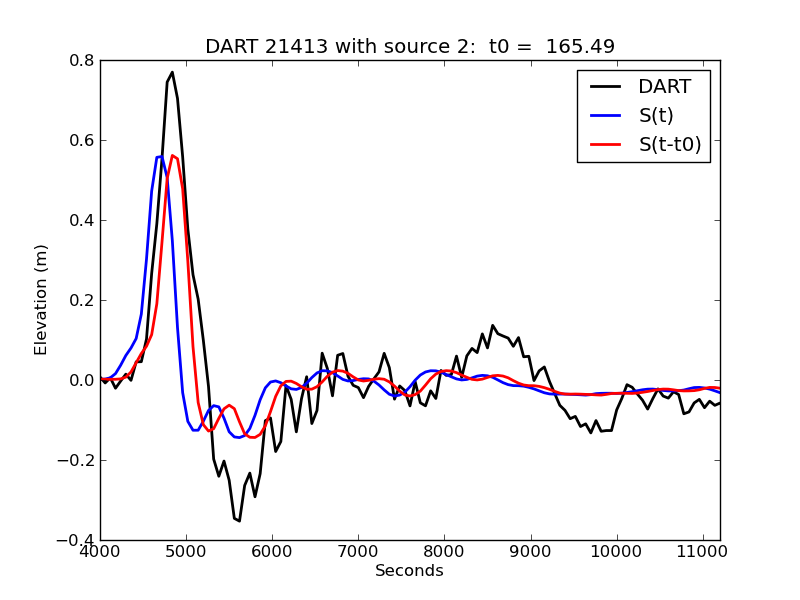
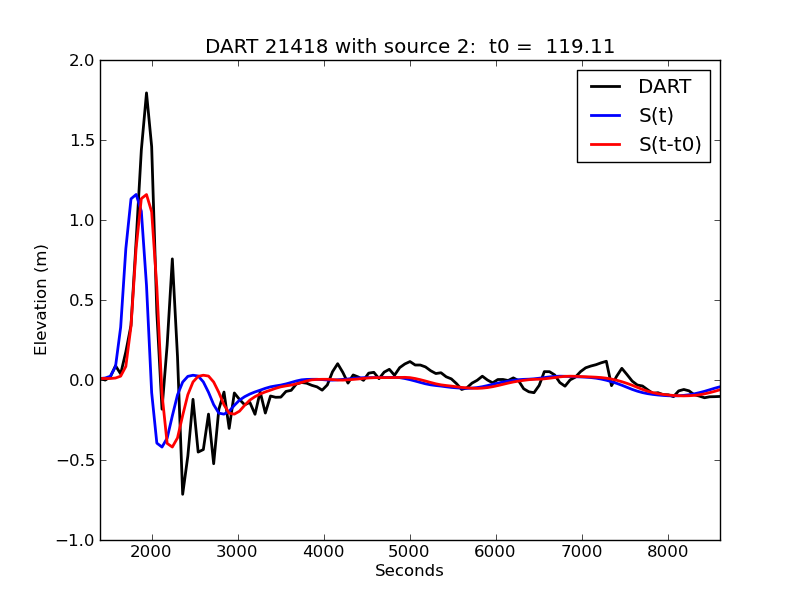
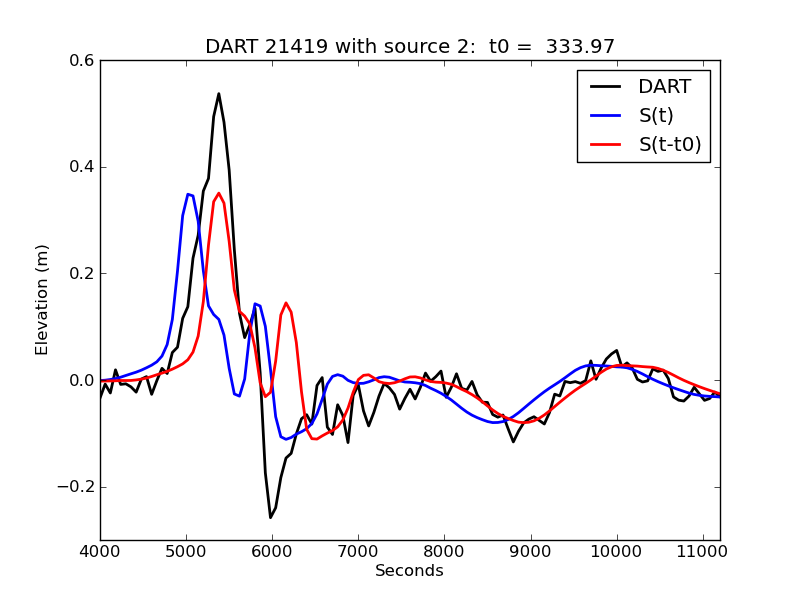
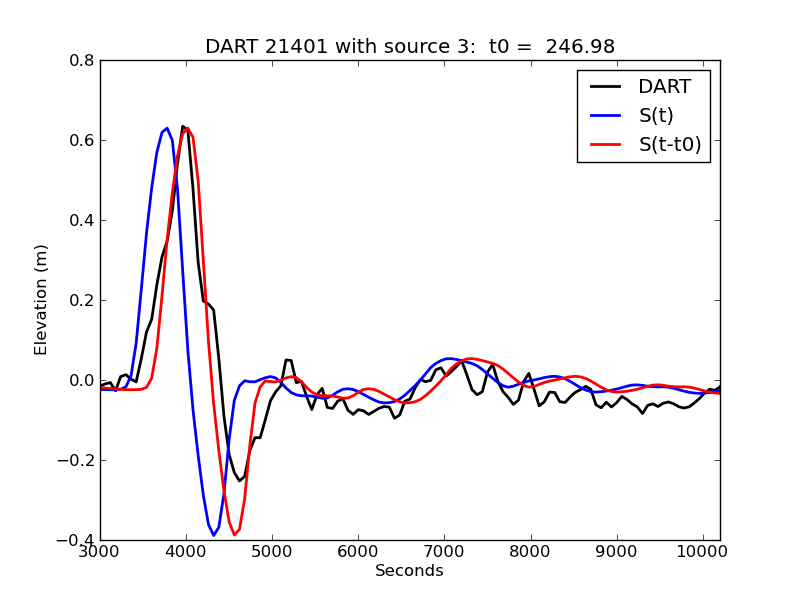
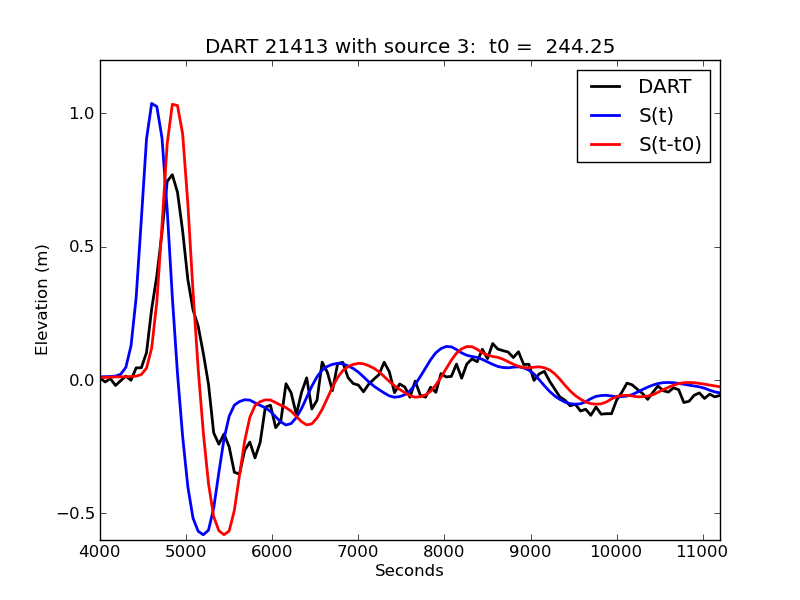
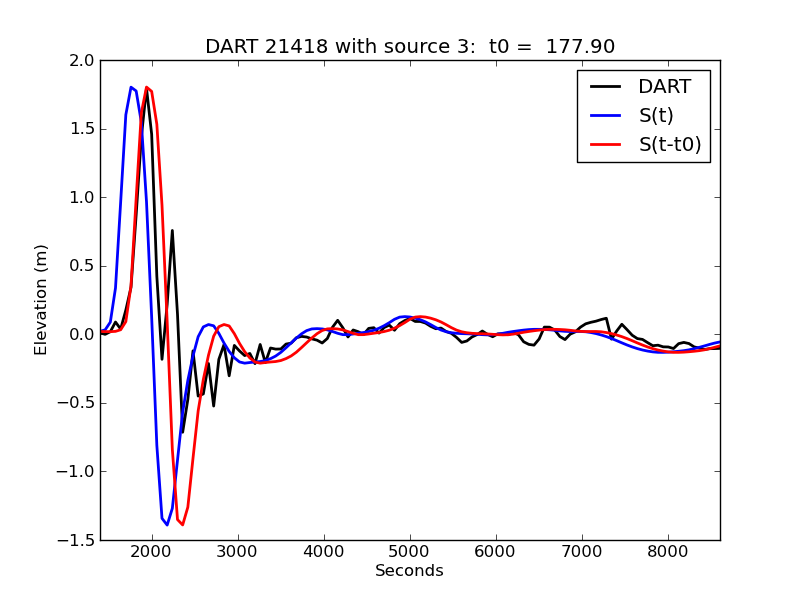
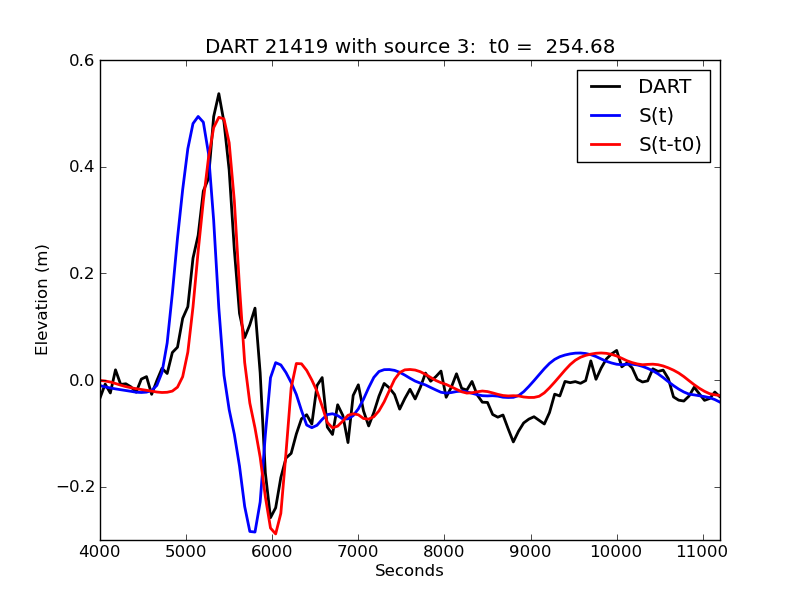
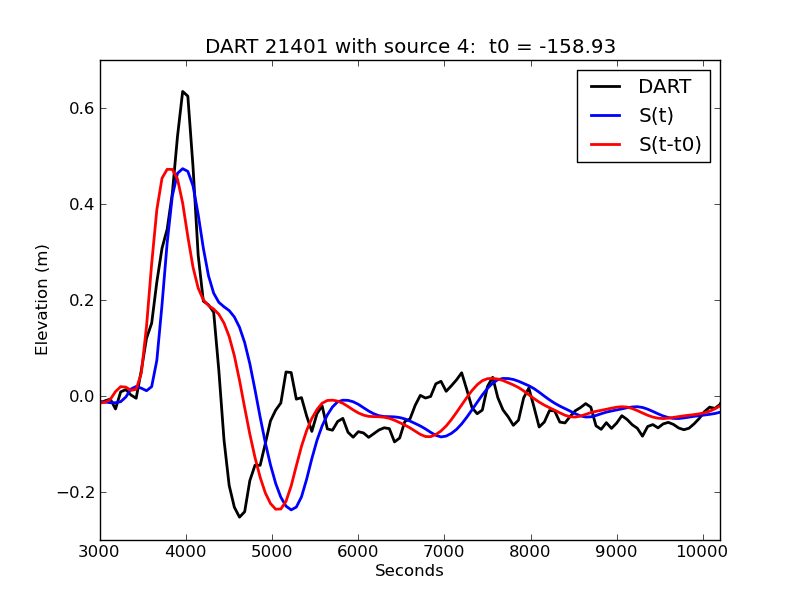
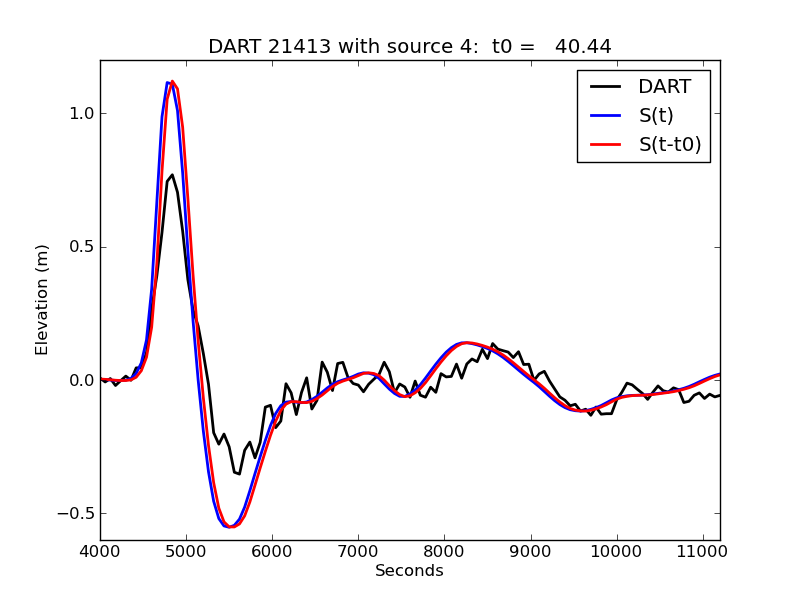
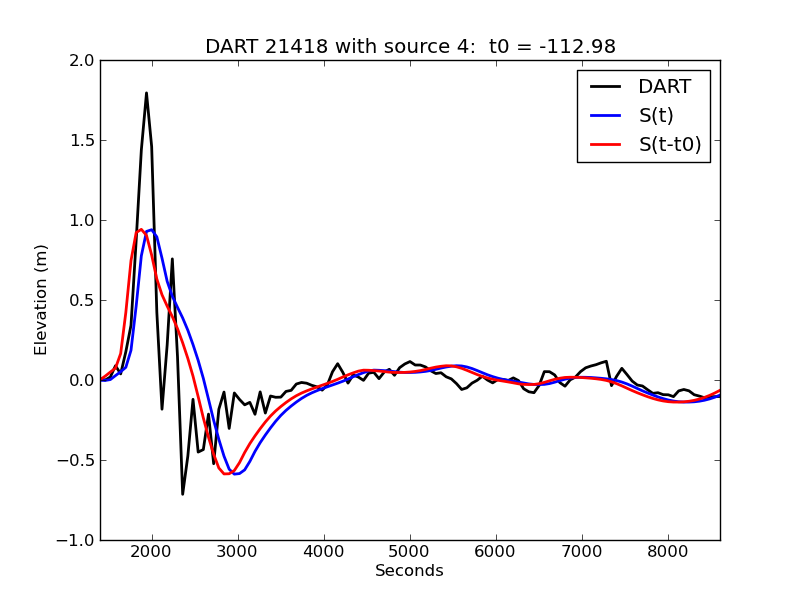
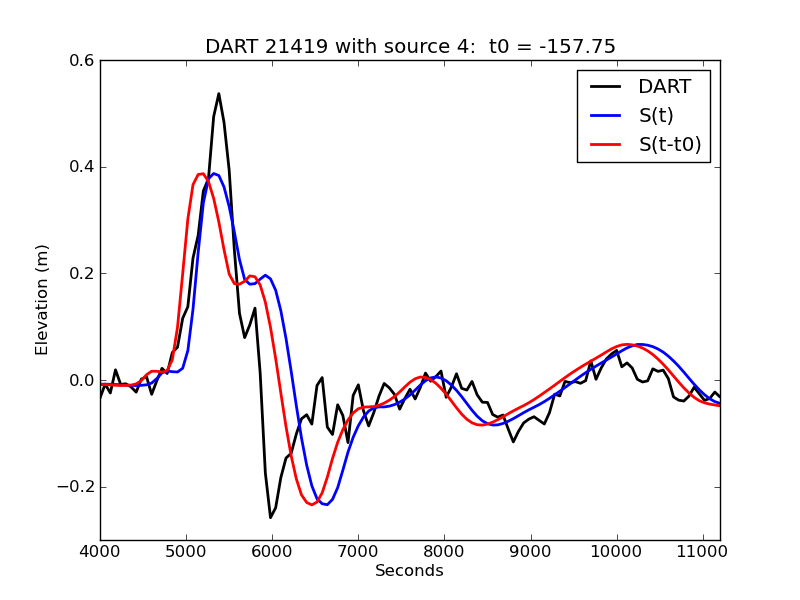
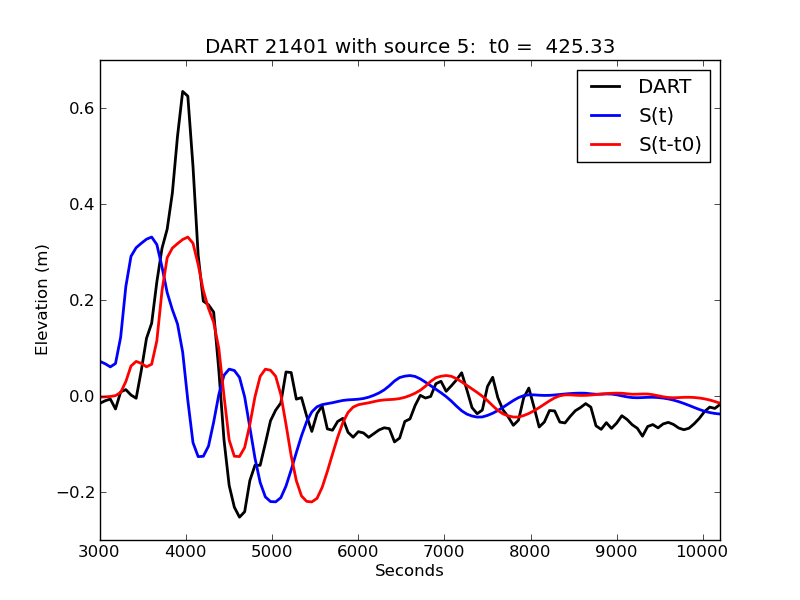
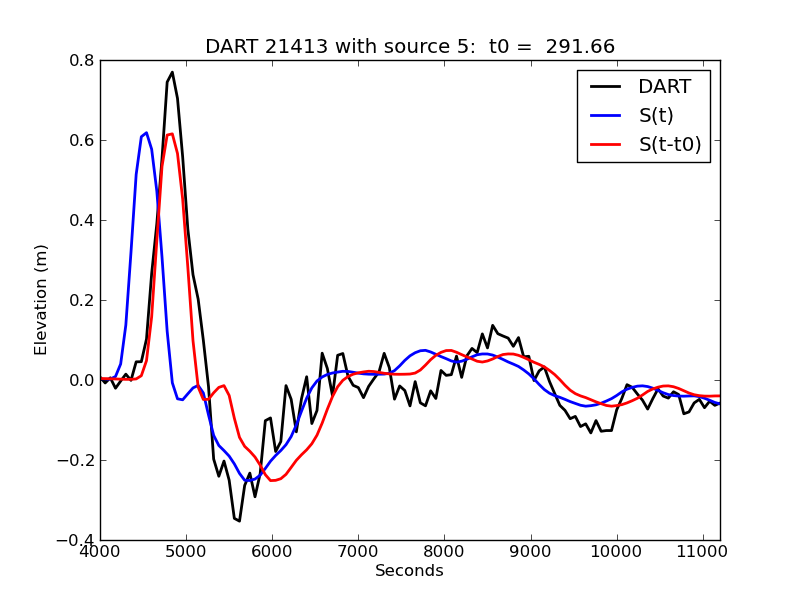
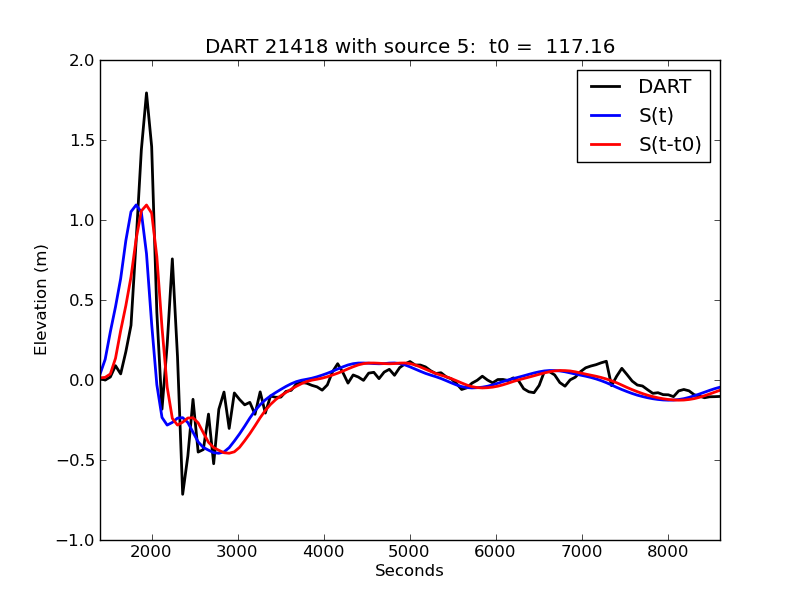
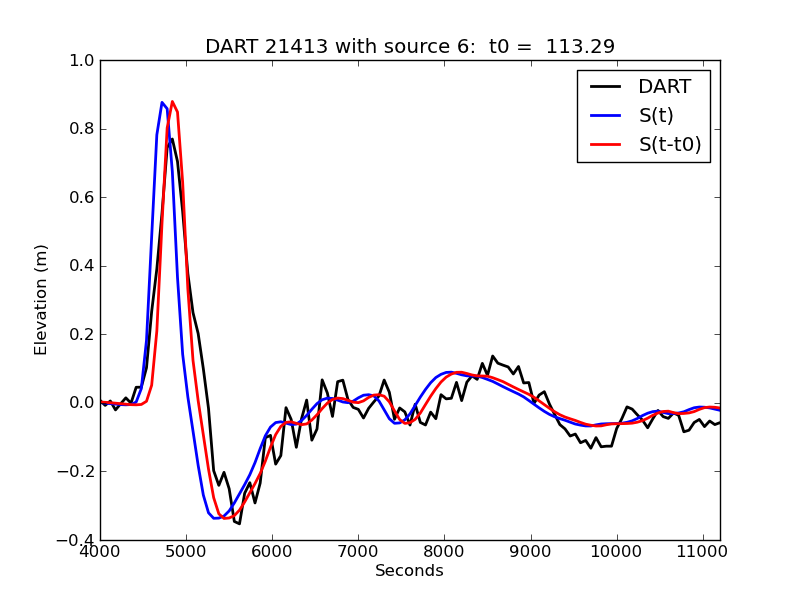
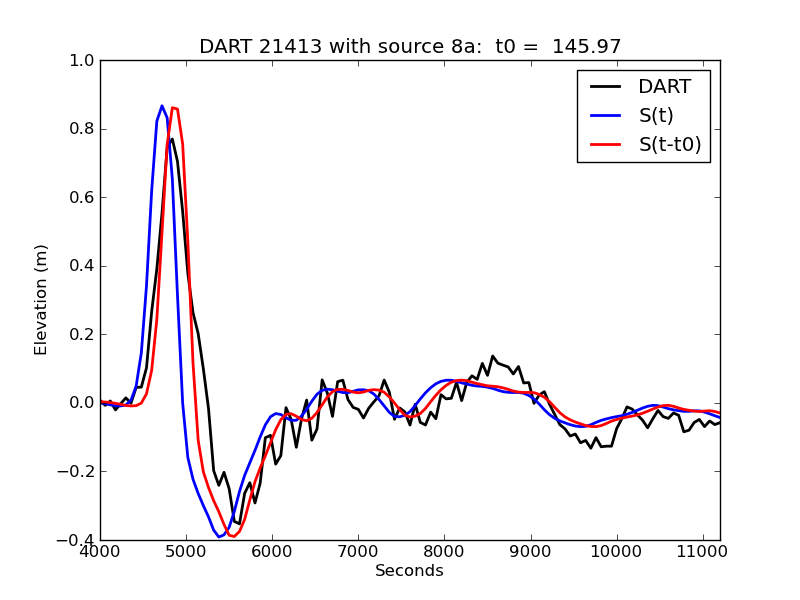
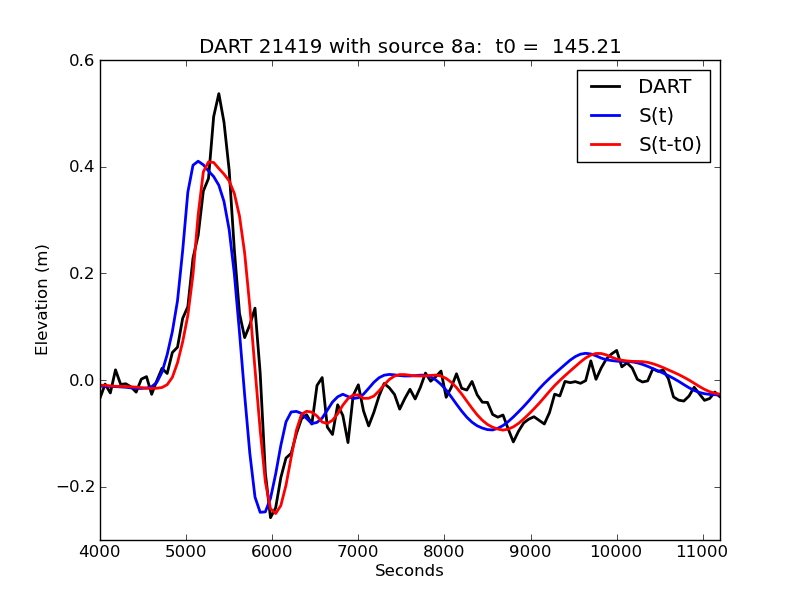
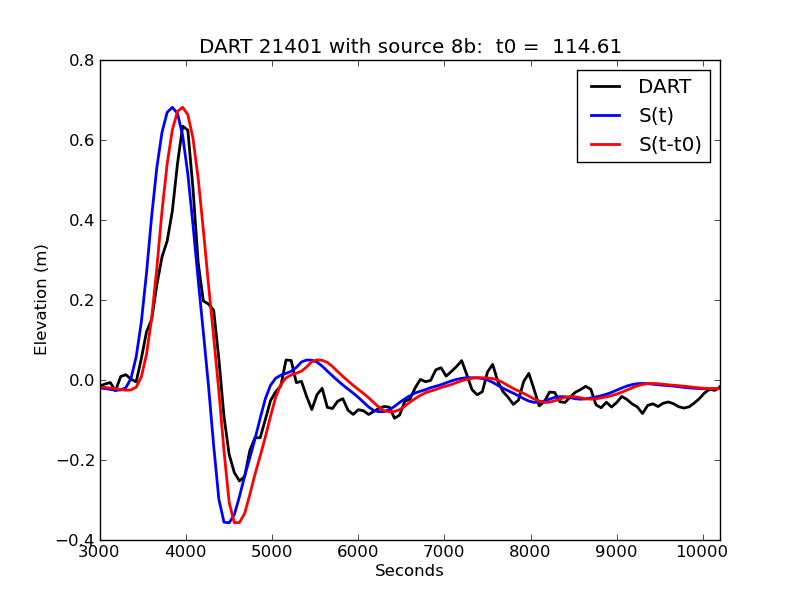
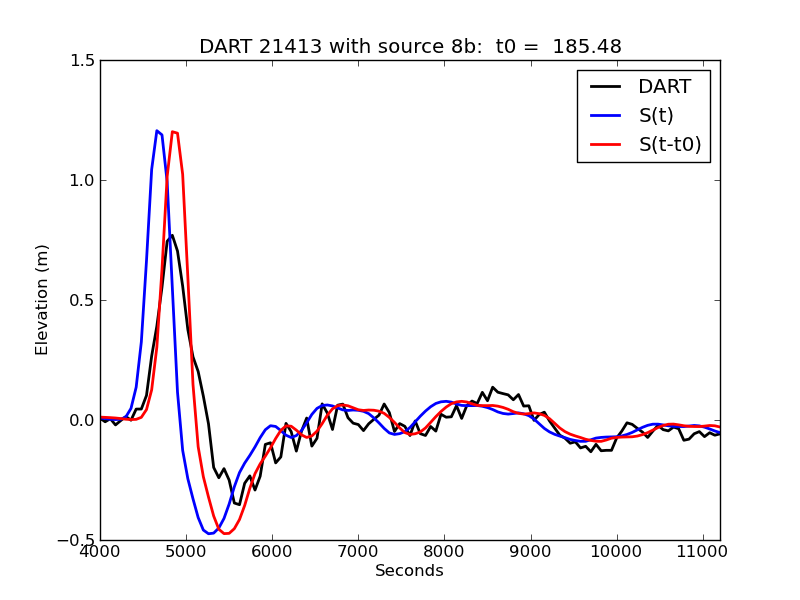
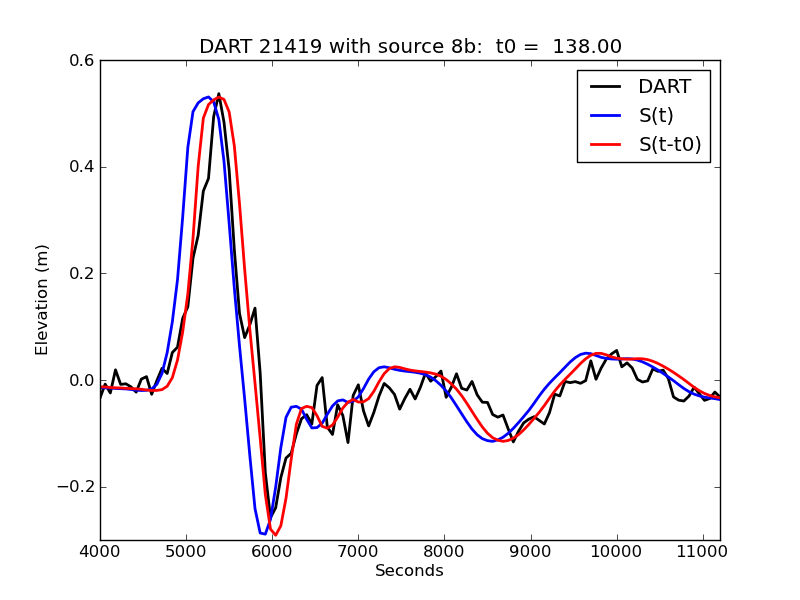
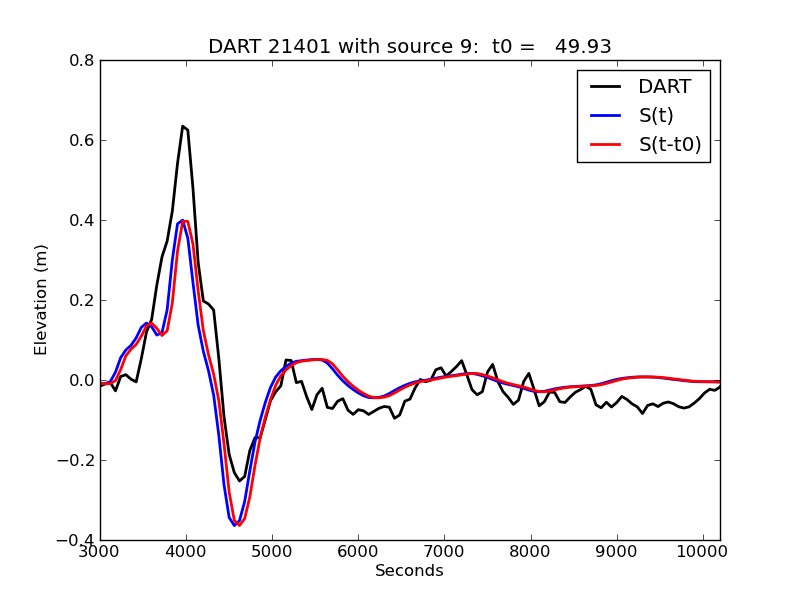
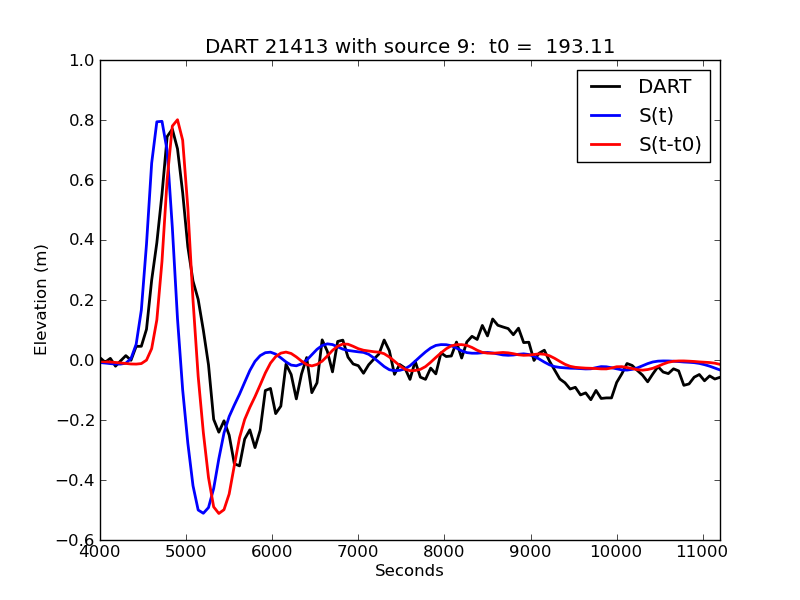
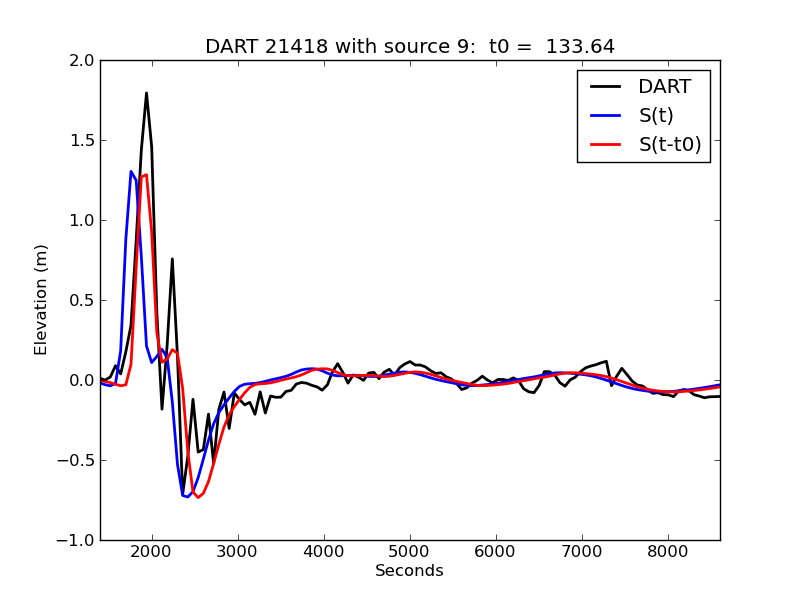
Figure S1: DART observations and simulations (Click plots to enlarge.)
Raw data and processing scripts
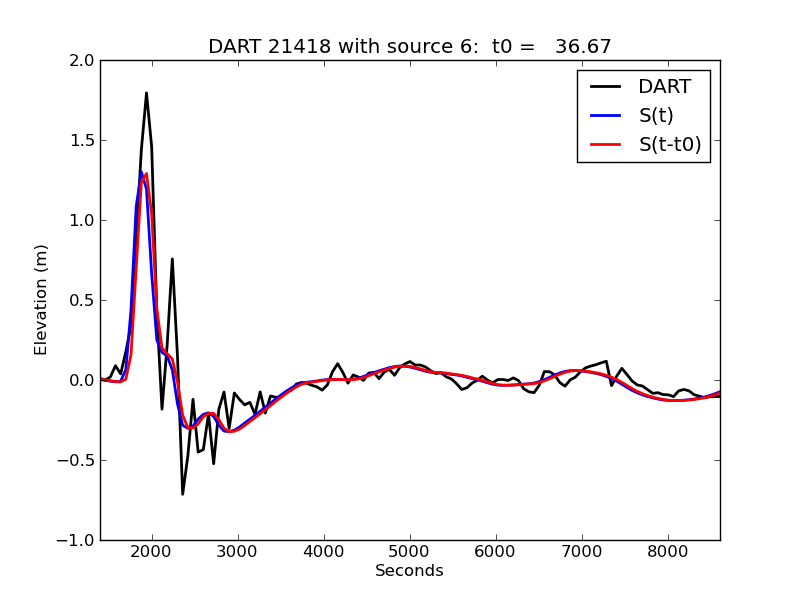
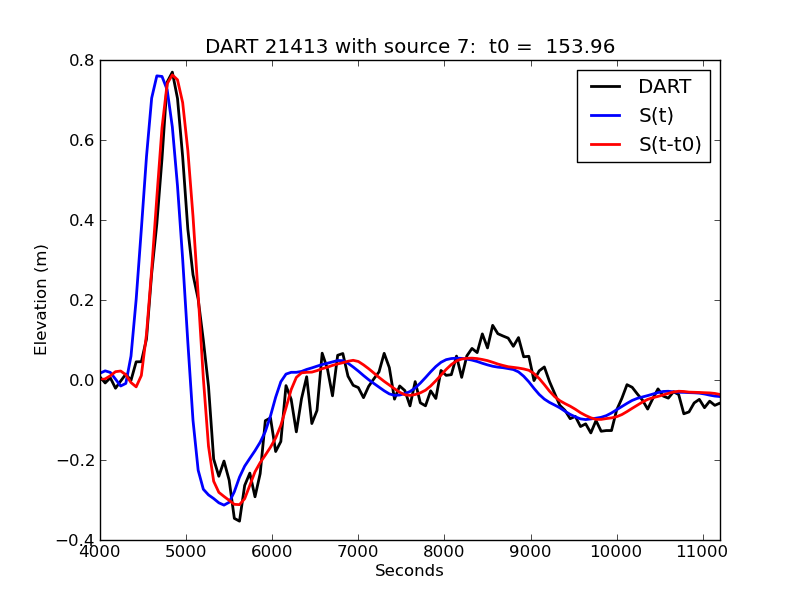
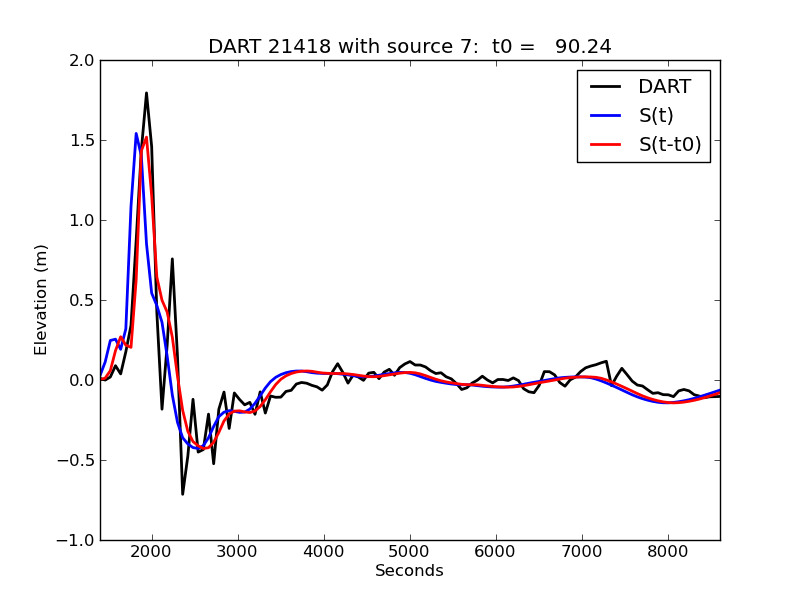
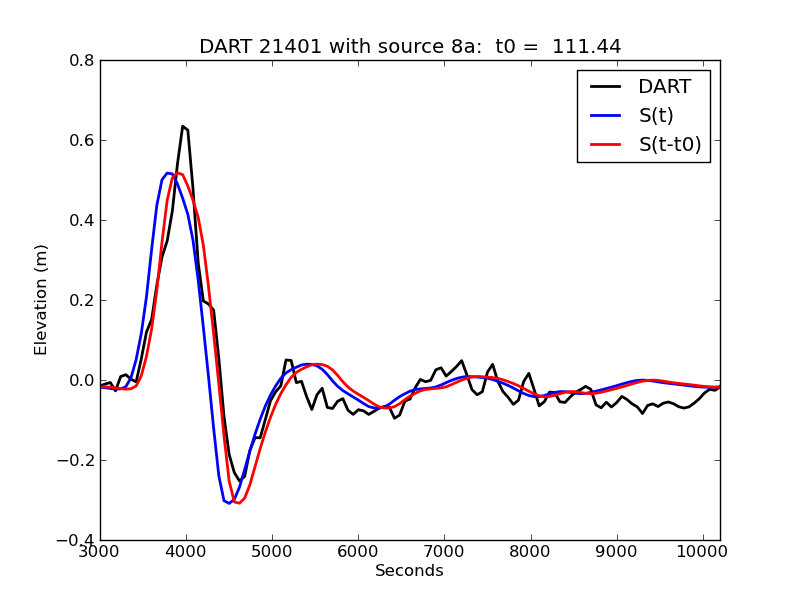
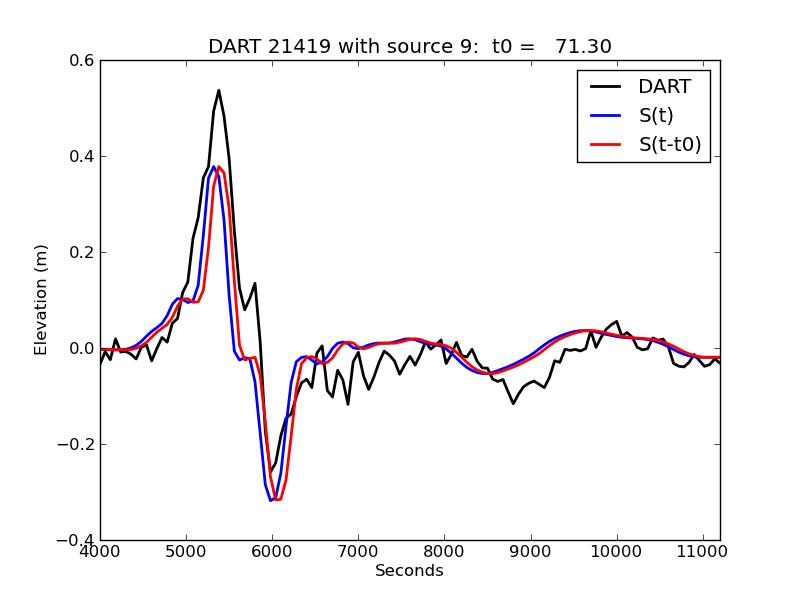
Observed and simulated response at each DART buoy studied. Time is in seconds from 05:46:24 UTC on 11 March 2011. The simulation is shown in two forms: unshifted (with instantaneous seafloor deformation at t=0) and shifted by the optimal time T_d as discussed in the text.
Source 1:
Source 2:
Source 3:
Source 4:
Source 5:

Source 6:


Source 7:


Source 8a:

Source 8b:

Source 9:
[ Back ]