begin_html [use: doc/doc.css]
GeoClaw Sample Code
Sample earthquake-generated tsunami based on the 2010 Chile event.
Primarily to illustrate how set up topo and dtopo files.
See [claw: doc/sphinx/users/topo.html] for more information.
See [code: maketopo.py]. This downloads topography data from the
[http://kingkong.amath.washington.edu/topo/ GeoClaw topography database]
that originally came from the
NOAA National Geophysical Data Center (NGDC)
using [http://www.ngdc.noaa.gov/mgg/gdas/gd_designagrid.html Design-a-grid].
USGS site for earthquake data:
[http://earthquake.usgs.gov/earthquakes/eqinthenews/2010/us2010tfan]
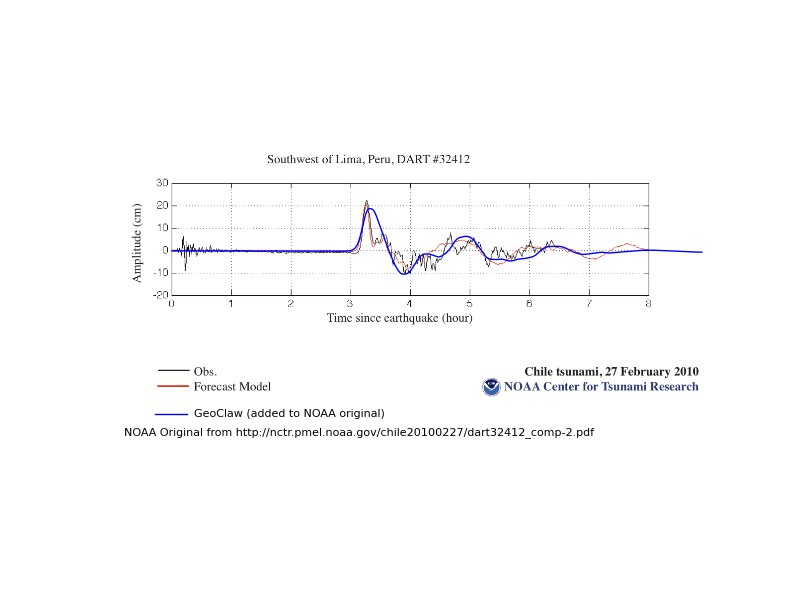
One gauge is included at the location of DART Buoy 32412:
[http://www.ndbc.noaa.gov/station_page.php?station=32412]
To download other DART buoy data, see
[http://www.ndbc.noaa.gov/dart.shtml]
See also the NOAA/PMEL Center for Tsunami Research
site for this tsunami, containing DART data, tide gauges, MOST simulations:
[http://nctr.pmel.noaa.gov/chile20100227/]
Plots of results
After running this code and creating plots via "make .plots", you should be
able to view the plots in [link: _plots/_PlotIndex.html].
The script [code: plot_dart.py] can be used plot a comparison of the gauge
data with the DART Buoy 32412 data, resulting in a plot
dart.png.
Fortran files
- [code: Makefile]
- Determines which version of fortran files
are used when compiling the code with make and specifies where output and
plots should be directed. Type "make .help" at the Unix prompt for options.
- [code: setprob.f]
-
Standard for for GeoClaw
Python files
- [code: maketopo.py]
- Used to create topo file and dtopo data file.
- [code: setrun.py]
- This file contains a function that
specifies what run-time parameters will be used.
- [code: setplot.py]
- This file contains a function that
specifies what plots will be done and
sets various plotting parameters.
- [code: setplot_imshow.py]
- Version of setplot illustrating how the '2d_imshow'
plot type can be used in place of '2d_pcolor'. This plots much faster.
- [code: plot_dart.py]
- This file contains a
script that can be used plot a comparison of the gauge
data with the DART Buoy 32412 data.
Data files
The .data files are automatically generated using the information in
[code: setrun.py].
Instructions
To make topo and dtopo data files:
{{{
$ make topo
}}}
To make all data files, edit setrun.py and then
{{{
$ make .data
}}}
To run code:
{{{
$ make .output
}}}
To plot results, either generate html pages via:
{{{
$ make .plots
}}}
or view interactively using ipython and Iplotclaw.
All of this can be done with:
{{{
$ source make_all.py
}}}
For more documentation, see
[http://kingkong.amath.washington.edu/clawpack/users].
end_html