| Name | Last modified | Size | Description | |
|---|---|---|---|---|
| Parent Directory | - | |||
| _plots/ | 2011-07-26 10:52 | - | ||
| pyclaw.log | 2011-07-26 10:52 | 0 | ||
| make_all.sh | 2011-05-15 14:28 | 169 | ||
| usgs100227.cfg | 2011-05-15 14:28 | 250 | ||
| setfixedgrids.data | 2011-07-26 10:45 | 330 | ||
| setqinit.data | 2011-07-26 10:45 | 330 | ||
| setgauges.data | 2011-07-26 10:45 | 379 | ||
| setregions.data | 2011-07-26 10:45 | 407 | ||
| setdtopo.data | 2011-07-26 10:45 | 421 | ||
| settopo.data | 2011-07-26 10:45 | 476 | ||
| etopo10min120W60W60S..> | 2011-05-15 15:35 | 496 | ||
| setgeo.data | 2011-07-26 10:45 | 561 | ||
| settsunami.data | 2011-07-26 10:45 | 632 | ||
| mem_storage.mod | 2011-07-26 10:45 | 701 | ||
| plot_dart.py | 2011-05-15 14:28 | 865 | ||
| run_tests.py | 2011-05-15 14:28 | 1.1K | ||
| maketopo.py | 2011-05-15 14:28 | 1.7K | ||
| make_all.sh.html | 2011-10-22 13:26 | 1.7K | ||
| setqinit.data.html | 2011-10-22 13:26 | 2.0K | ||
| setfixedgrids.data.html | 2011-10-22 13:26 | 2.0K | ||
| setgauges.data.html | 2011-10-22 13:26 | 2.0K | ||
| setregions.data.html | 2011-10-22 13:26 | 2.1K | ||
| setdtopo.data.html | 2011-10-22 13:26 | 2.1K | ||
| etopo10min120W60W60S..> | 2011-10-22 13:26 | 2.1K | ||
| settopo.data.html | 2011-10-22 13:26 | 2.1K | ||
| setgeo.data.html | 2011-10-22 13:26 | 2.3K | ||
| plot_dart.py.html | 2011-10-22 13:26 | 2.4K | ||
| settsunami.data.html | 2011-10-22 13:26 | 2.5K | ||
| run_tests.py.html | 2011-10-22 13:26 | 2.9K | ||
| maketopo.py.html | 2011-10-22 13:26 | 3.2K | ||
| amr2ez.data | 2011-07-26 10:45 | 3.8K | ||
| setplot.pyc | 2011-07-26 10:48 | 4.3K | ||
| Makefile | 2011-05-15 14:28 | 4.4K | ||
| setplot.py | 2011-05-15 14:28 | 5.0K | ||
| geoclaw_module.mod | 2011-07-26 10:45 | 5.9K | ||
| Makefile.html | 2011-10-22 13:26 | 6.6K | ||
| amr2ez.data.html | 2011-10-22 13:26 | 6.8K | ||
| setplot_imshow.py | 2011-05-15 14:28 | 6.8K | ||
| setplot.py.html | 2011-10-22 13:26 | 7.4K | ||
| topo_module.mod | 2011-07-26 10:45 | 7.4K | ||
| dtopo_module.mod | 2011-07-26 10:45 | 8.4K | ||
| setrun.py | 2011-05-15 14:28 | 9.3K | ||
| setplot_imshow.py.html | 2011-10-22 13:26 | 9.5K | ||
| setrun.py.html | 2011-10-22 13:26 | 14K | ||
| dart.png | 2011-07-26 10:52 | 55K | ||
| dart32412_comp-2.png | 2011-05-15 14:28 | 75K | ||
| etopo10min120W60W60S..> | 2011-05-15 15:35 | 962K | ||
| usgs100227.tt1 | 2011-05-15 15:35 | 1.1M | ||
| README.html |  |
| Source file: README.txt | |
| Directory: /home/rjl/git/rjleveque/clawpack-4.x/apps/tsunami/chile2010 | |
| Converted: Tue Jul 26 2011 at 12:58:50 using clawcode2html | |
| This documentation file will not reflect any later changes in the source file. |
|
|
GeoClaw Sample CodeSample earthquake-generated tsunami based on the 2010 Chile event. Primarily to illustrate how set up topo and dtopo files. See $CLAW/doc/sphinx/users/topo.html for more information. See maketopo.py [.html]. This downloads topography data from the GeoClaw topography database that originally came from the NOAA National Geophysical Data Center (NGDC) using Design-a-grid .
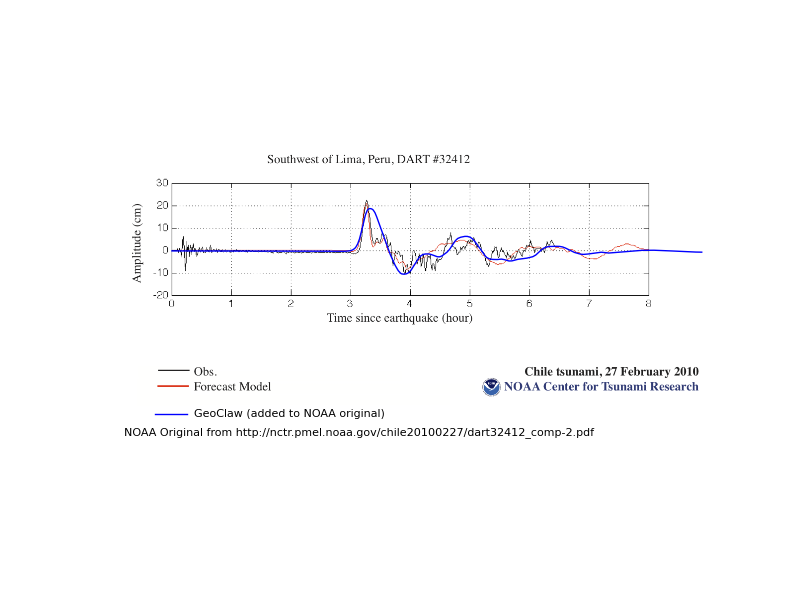
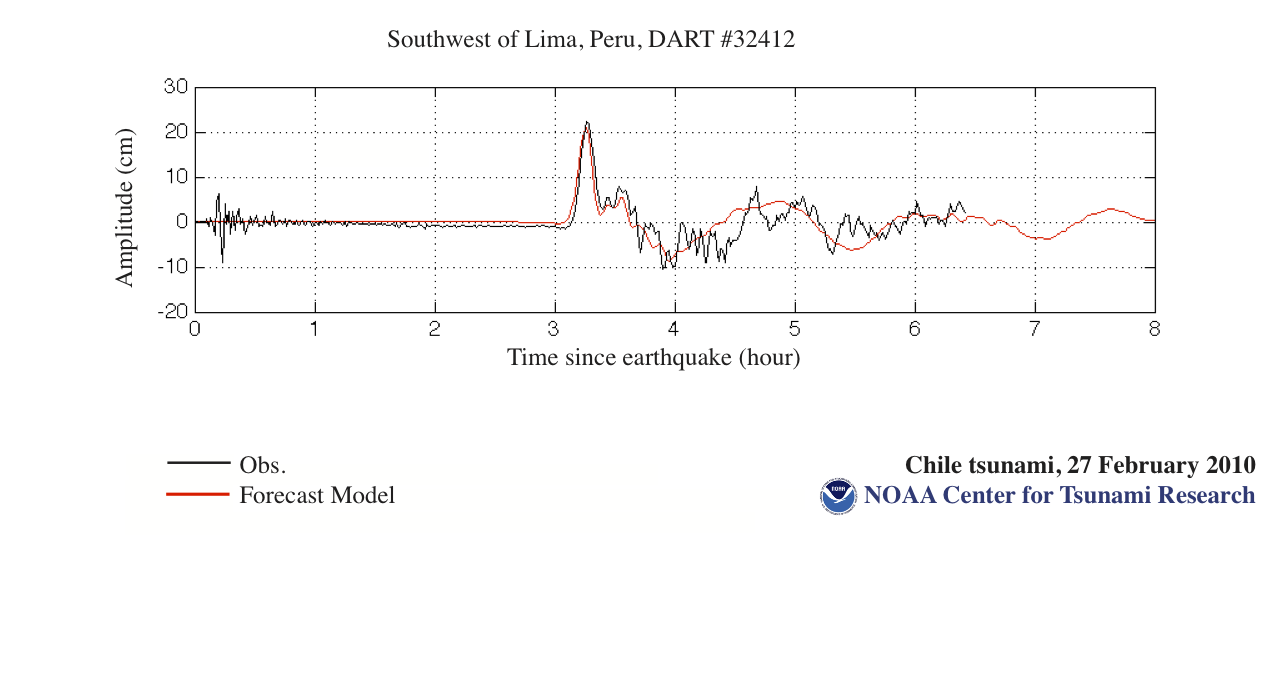
USGS site for earthquake data: earthquake.usgs.gov/earthquakes/eqinthenews/2010/us2010tfan One gauge is included at the location of DART Buoy 32412: www.ndbc.noaa.gov/station_page.php?station=32412 To download other DART buoy data, see www.ndbc.noaa.gov/dart.shtml
See also the NOAA/PMEL Center for Tsunami Research site for this tsunami, containing DART data, tide gauges, MOST simulations: nctr.pmel.noaa.gov/chile20100227/
Plots of resultsAfter running this code and creating plots via "make .plots", you should be able to view the plots in _plots/_PlotIndex.html . The script plot_dart.py [.html] can be used plot a comparison of the gauge data with the DART Buoy 32412 data, resulting in a plot dart.png.
Fortran files
Python files
Data filesThe .data files are automatically generated using the information in setrun.py [.html].
Instructions
To make topo and dtopo data files: $ make topo To make all data files, edit setrun.py and then $ make .data To run code: $ make .output To plot results, either generate html pages via: $ make .plotsor view interactively using ipython and Iplotclaw. All of this can be done with:
$ source make_all.py For more documentation, see kingkong.amath.washington.edu/clawpack/users .
|