
|
AMath 584, Autumn Quarter, 2011 Applied Linear Algebra and Introductory Numerical Analysis |
|
|
AMath 584, Autumn Quarter, 2011 Applied Linear Algebra and Introductory Numerical Analysis |
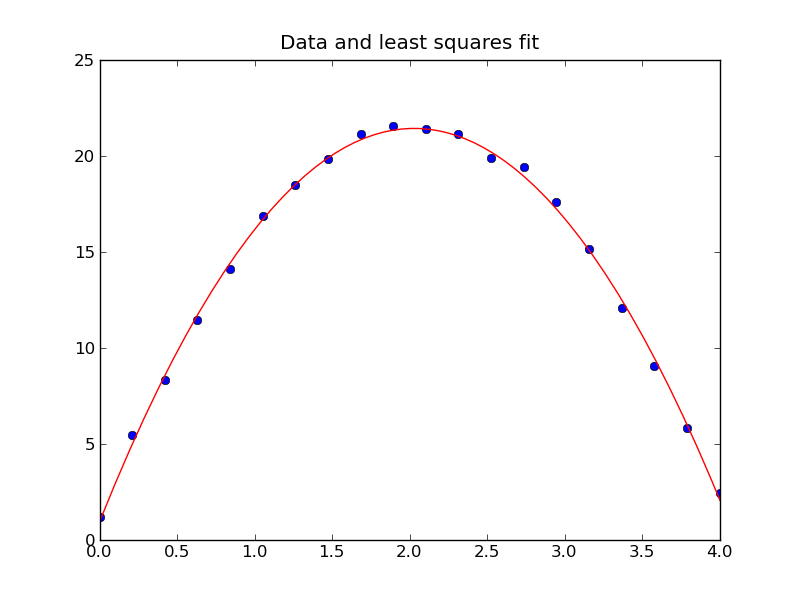
In this example exact data points on a parabola are generated and then normally-distributed (Gaussian) random noise is added. You can change the amount of noise by adjusting the parameter delta.
The least squares solution is then computed and plotted along with the data.
This simulates an experiment in which is ball is thrown upwards and released at y = y0 with velocity v0. The height as a function of time should then be y(t) = y0 + v0*t - 0.5*g*t^2. From noisy measurements we might want to estimate g, the third component of the coefficient vector c below.
1 2 3 4 5 6 7 8 9 10 11 12 13 14 15 16 17 18 19 20 21 22 23 24 25 26 27 28 29 30 31 32 33 34 35 36 37 38 39 40 41 42 43 44 45 46 47 48 49 50 51 52 53 | from pylab import *
# Generate synthetic data:
y0 = 1.
v0 = 20.
g = 9.81
t = linspace(0,4,20)
m = len(t)
# Exact values:
y = y0 + v0*t - 0.5*g*t**2
# Add normally distributed noise of size delta:
delta = 0.3
noise = delta * randn(m)
y = y + noise
# Plot points
figure(1)
clf()
plot(t,y,'o')
title('Data points')
ans = raw_input("Hit return to fit... ")
# Create matrix A:
A = ones((m,3))
# fix second and third columns:
A[:,1] = t
A[:,2] = -0.5 * t**2
# Solve using lstsq:
output = lstsq(A,y)
c = output[0] # see documentation for other elements of output
print "\nCoefficients estimated with lstsq: (y0, v0, g):"
print c
# Solve using QR directly:
Q,R = qr(A)
yhat = dot(Q.T, y)
c = solve(R, yhat)
print "\nCoefficients estimated with QR: (y0, v0, g):"
print c
# Plot the function we found with lots of points:
tt = linspace(0, 4, 1000)
yy = c[0] + c[1]*tt - 0.5*c[2]*tt**2
plot(tt, yy, 'r')
title('Data and least squares fit')
|
1 2 3 4 5 6 7 8 9 10 11 12 13 14 15 16 17 18 19 20 21 22 23 24 25 26 27 28 29 30 31 32 33 34 35 36 37 38 39 40 41 42 43 44 45 46 47 48 49 50 51 | % Generate synthetic data:
y0 = 1.;
v0 = 20.;
g = 9.81;
t = linspace(0,4,20)';
m = length(t);
% Exact values:
y = y0 + v0*t - 0.5*g*t.^2;
% Add normally distributed noise of size delta:
delta = 0.3;
noise = delta * randn(m,1);
y = y + noise;
% Plot points
figure(1);
clf
plot(t,y,'o')
title('Data points')
ans = input('Hit return to fit... ')
% Create matrix A:
A = ones(m,3);
% fix second and third columns:
A(:,2) = t;
A(:,3) = -0.5 * t.^2;
% Solve using backslash:
c = A \ y;
disp(['Coefficients estimated with lstsq: (y0, v0, g):'])
c
% Solve using QR directly:
[Q,R] = qr(A);
yhat = Q' * y;
c = R \ yhat;
disp(['Coefficients estimated with QR: (y0, v0, g):'])
c
% Plot the function we found with lots of points:
hold on
tt = linspace(0, 4, 1000);
yy = c(1) + c(2)*tt - 0.5*c(3)*tt.^2;
plot(tt, yy, 'r')
title('Data and least squares fit')
|