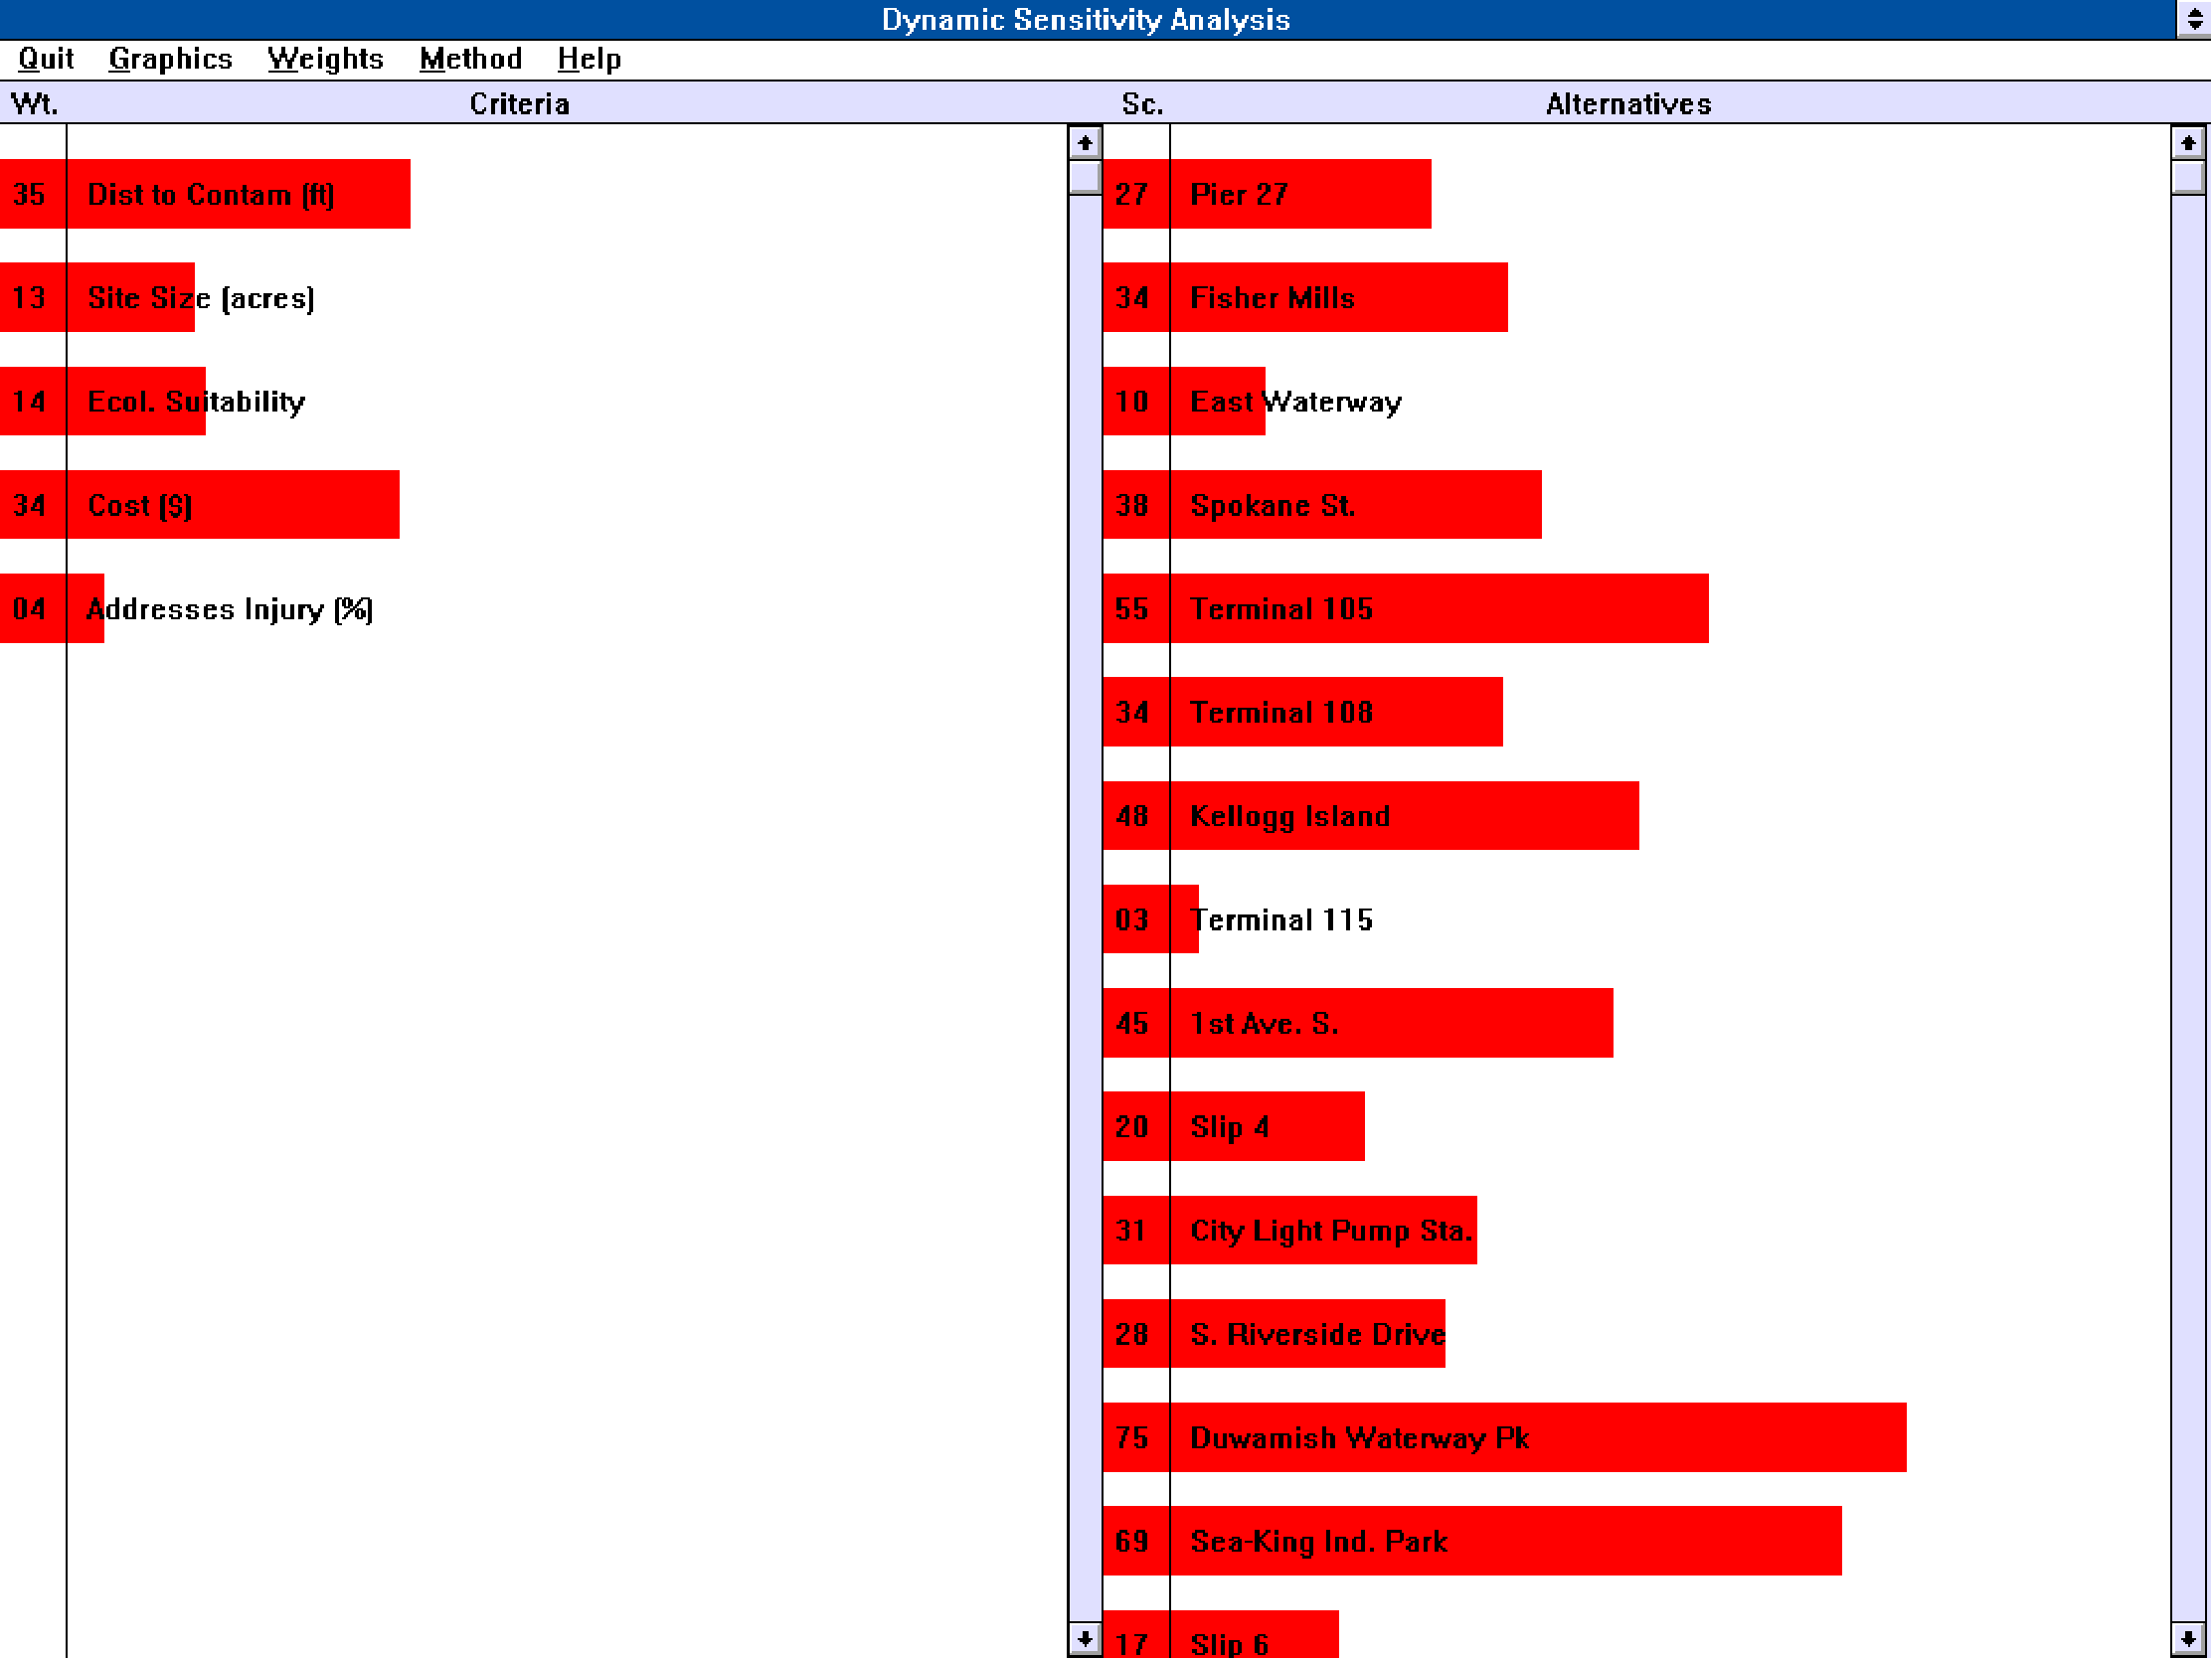
Figure 4c. The dynamic sensitivity analysis tool in MCDM/Consensus. The horizontal bars on the left represent the magnitude of the weights for the selected criteria. The bars on the right represent the resulting total score for each site in the decision problem. When a bar on the left is adjusted with a mouse click-and-drag operation, which changes the criterion weight, all other bars in the display are dynamically updated.