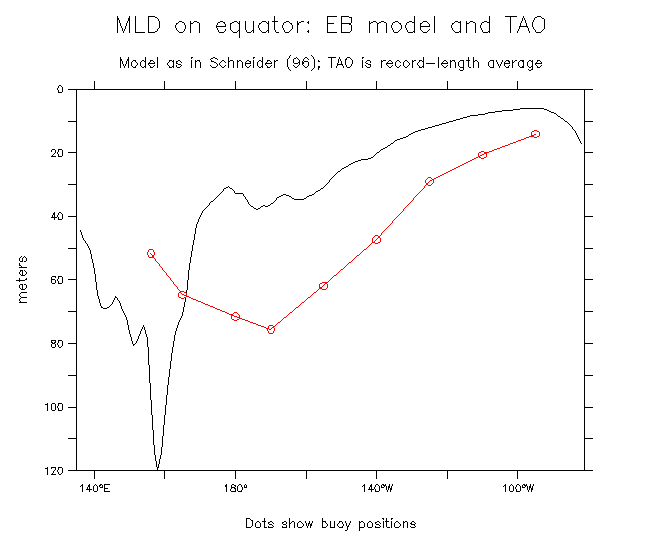
Mixed layer depth on the equator. Black: MLD according to the Schneider
(1996) energy balance model, estimated from the ratio of initial model
to observed SST variance (compare the equatorial values of Fig. 3 of
S96). Red: observed mean values of MLD from the TAO buoys, where MLD
is defined as the depth where the temperature is 0.5C lower than the SST.
Go back to text. Go back to figure list