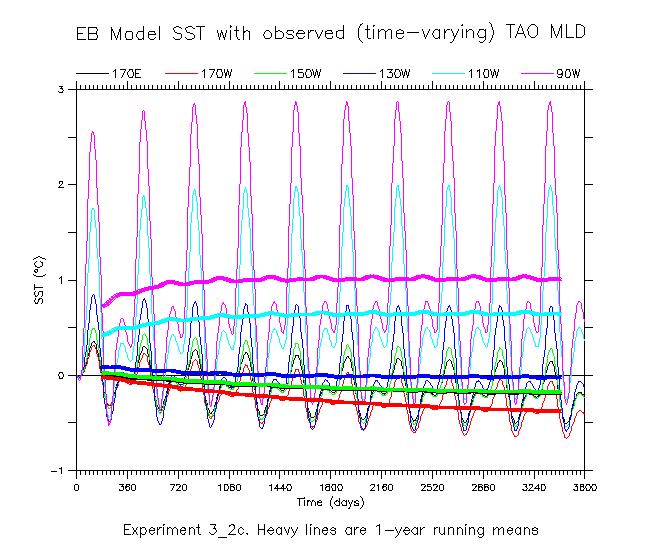
Ten-year time series of SST from the S96 energy balance model at 6 longitudes
on the equator, forced with observed (time-varying) MLD from TAO buoys. The
heavy lines are 1-year running means of the
corresponding colored time series. Note the slow warming and cooling
that occurs at the different longitudes.
Go back to text. Go back to figure list