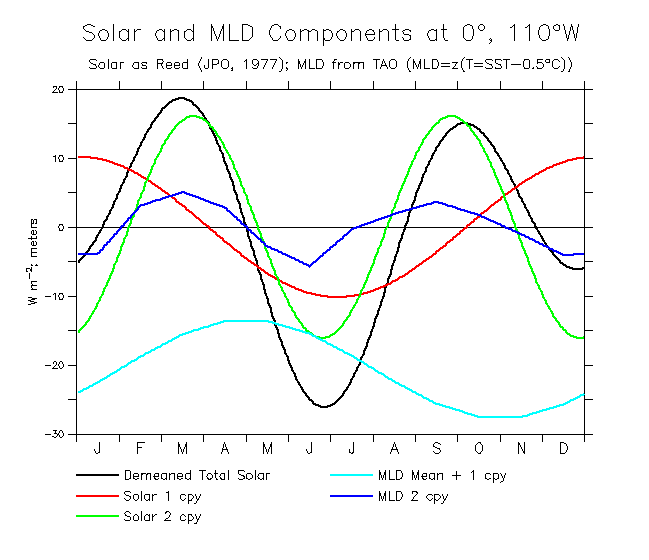
Diagram to show the relative phases of the annual harmonic components of
solar radiation and MLD from TAO buoys. Black, red and green curves show
the total, 1 cpy and 2 cpy solar variations (W/m2). The light blue curve
is the mean + 1 cpy variation of MLD, while the dark blue curve is the
remainder (approximately equal to the 2 cpy variation) (meters). Note the partially
out of phase relation of the 1 cpy signals, and the nearly in-phase
relation of the 2 cpy signals.
Go back to text. Go back to figure list