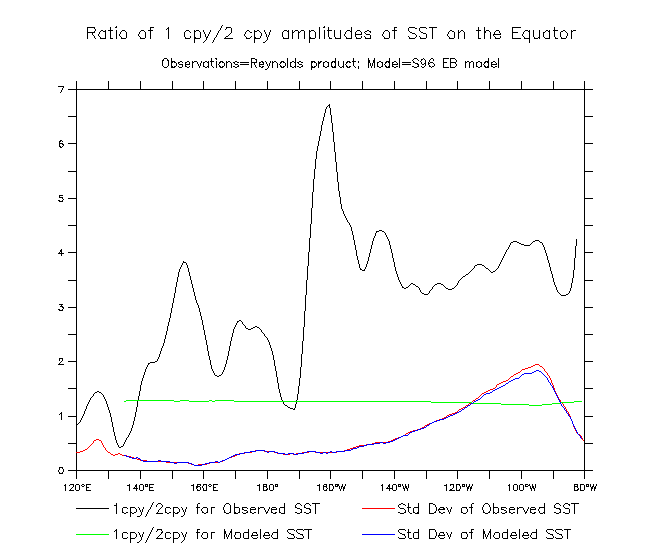
Comparison of the amplitude ratios between observations and the S96 model.
The observed ratio (black) is about 4 in the east-central Pacific, indicating
a strong dominance of 1 cpy variability. The modeled ratio (green) is nearly
constant at about 1.27, indicating only slightly larger 1 cpy amplitude. The
red and blue curves show the standard deviation of observed and modeled SST,
respectively, and should be equal in the "heat storage limit" of S96.
Go back to text. Go back to figure list