Solomon Sea CTDs (historical data)
Plots using historical data in and around the Solomon Sea. Now includes both CTD and ADCP data.
(Also see noumea/gliders/gliders_solomon_sea.html for stuff directly related to the glider experiment)
Section maps and documentation
Region selection
(shows tracklines used in blue)
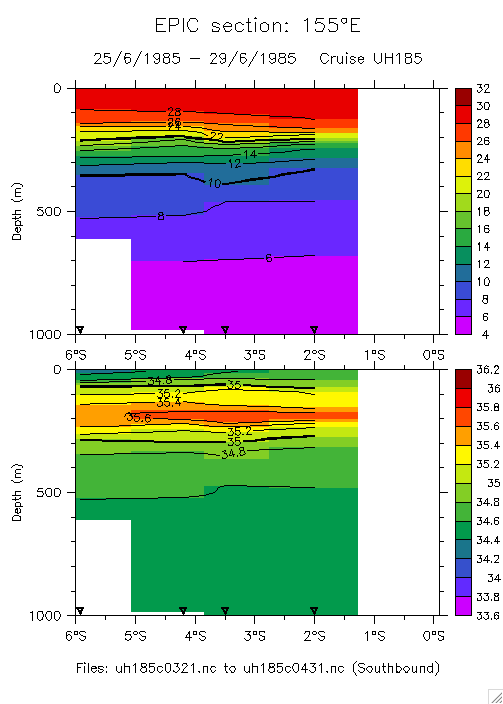
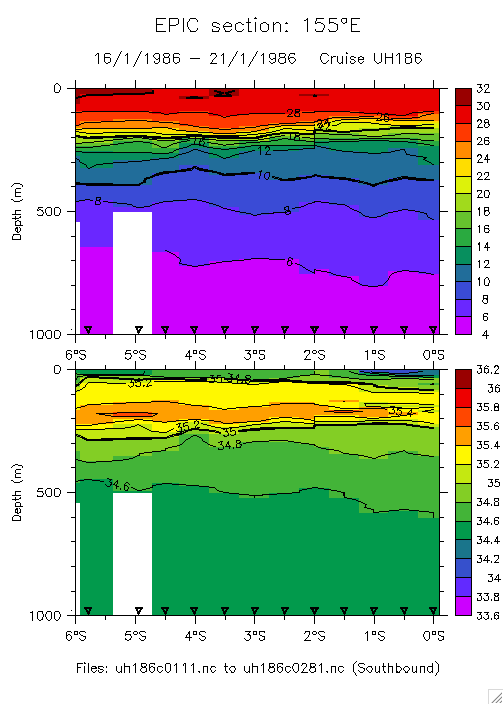
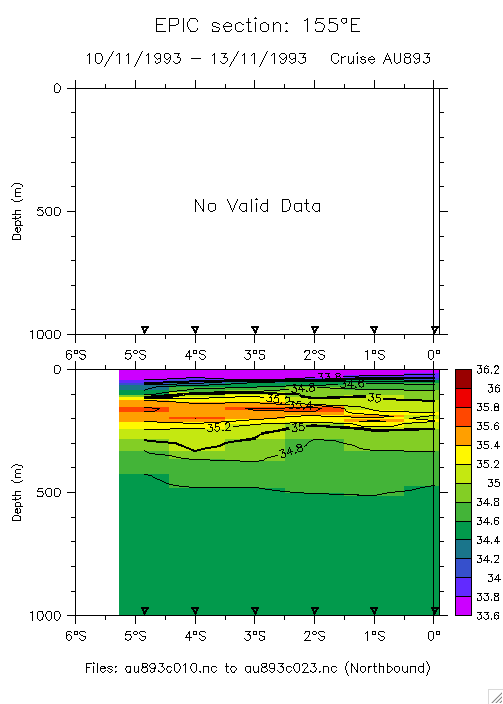
Sections along 155°E (Northern tip of Bougainville)
UH185
UH186
AU893
(Salinity only)
AU592
(Salinity only)
Sections along 156°E (Bougainville Strait)
Maps and time-lat plots:
Map showing 156°E track on bathymetry
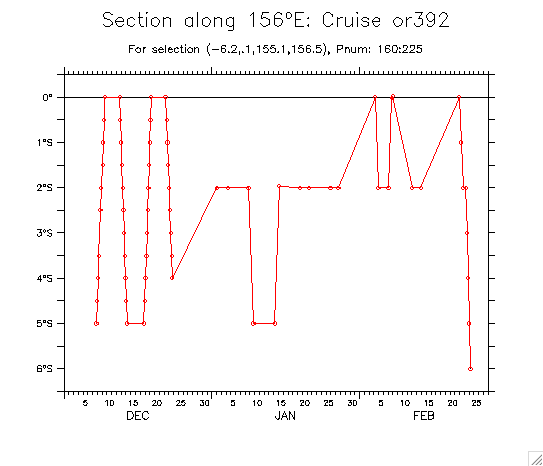
OR392 sections (time-lat)
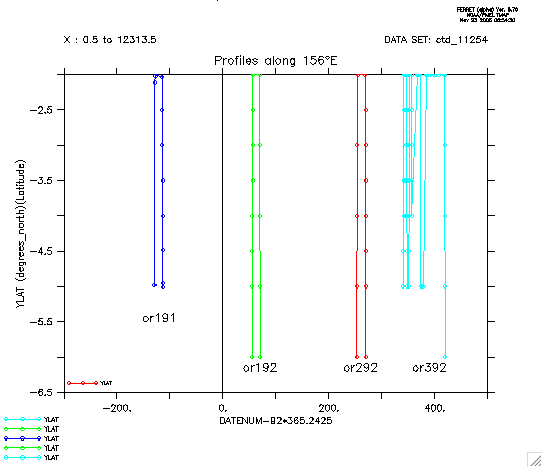
All 156°E sections (time-lat)
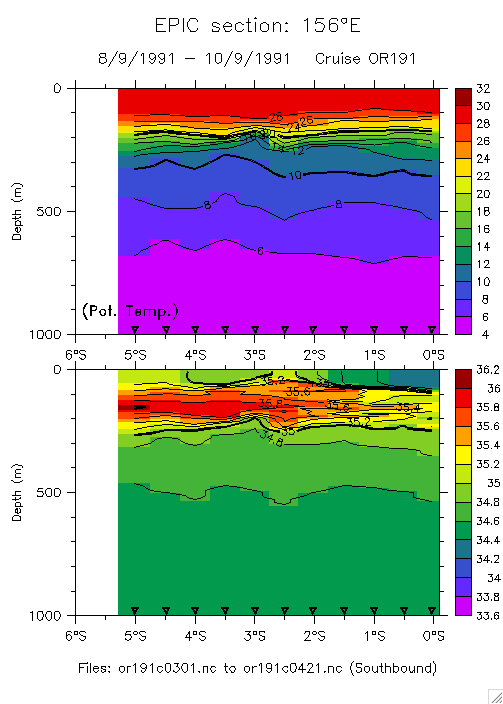
OR191
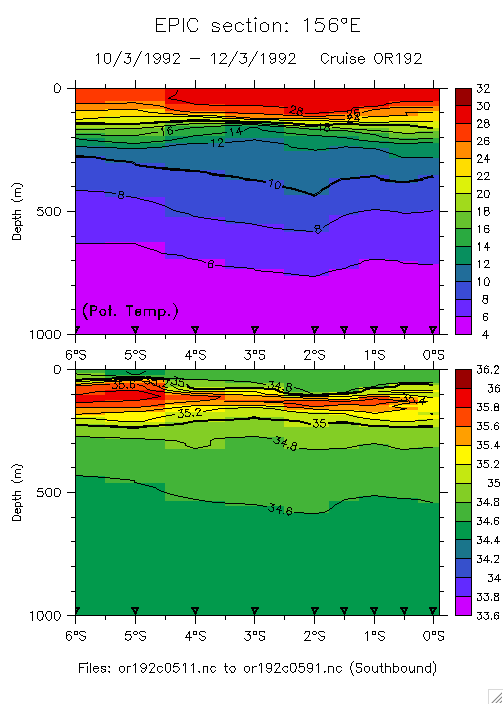
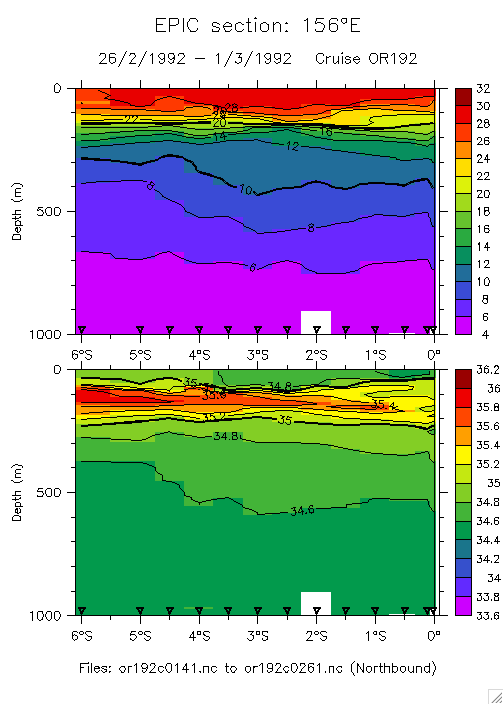
OR192 (S-bound)
OR192 (N-bound)
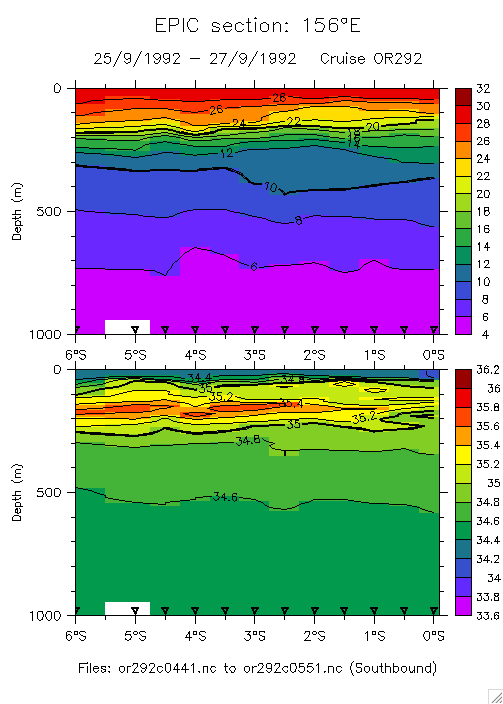
OR292 (S-bound)
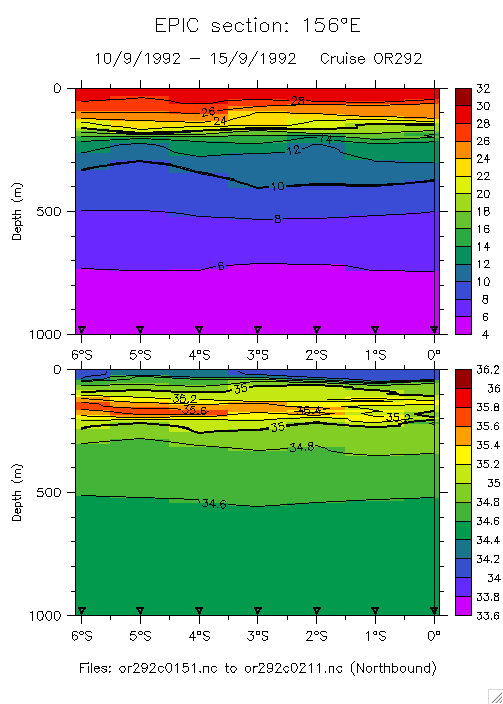
OR292 (N-bound)
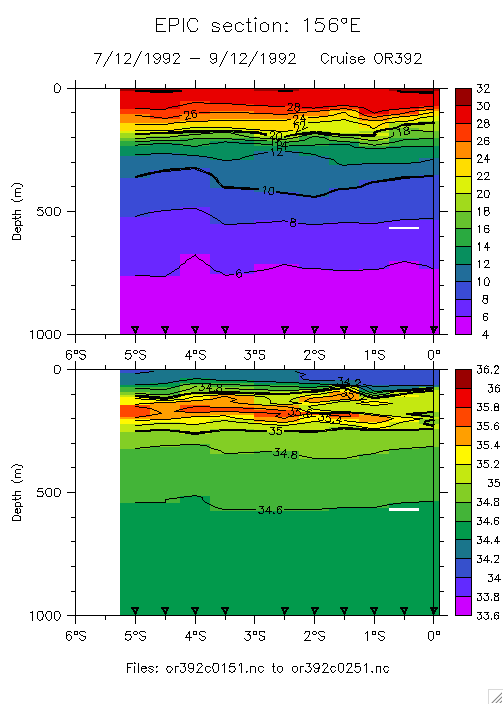
OR392a (S-bound)
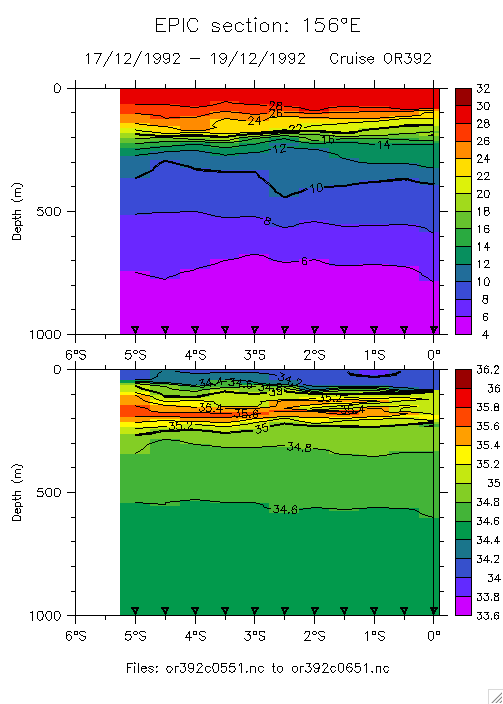
OR392a (N-bound)
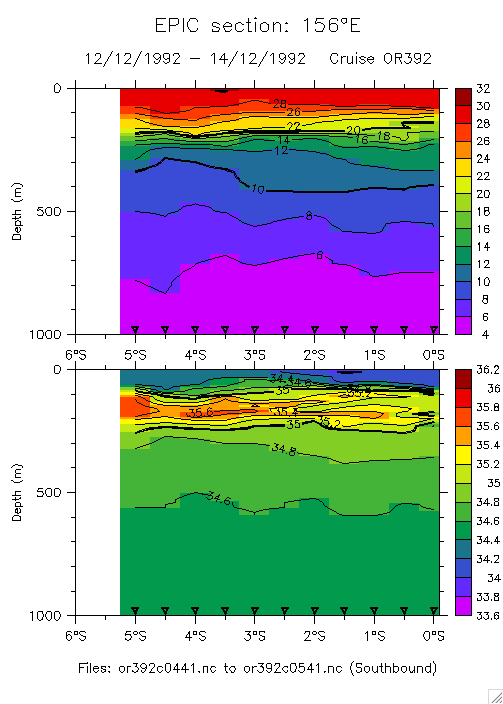
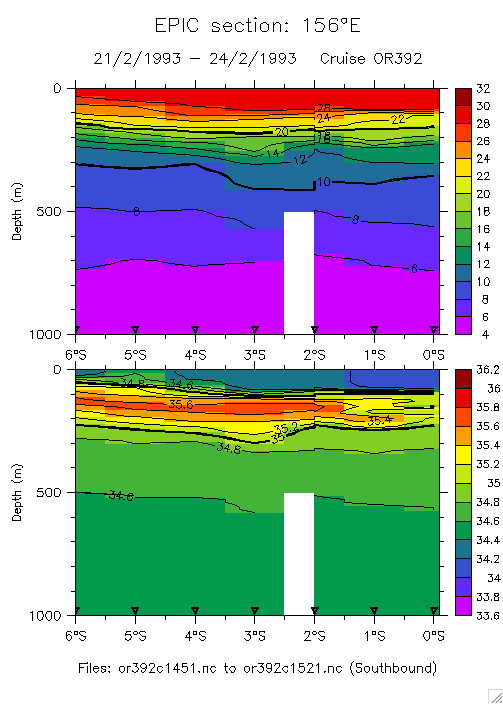
OR392b (S-bound)
OR392b (N-bound)
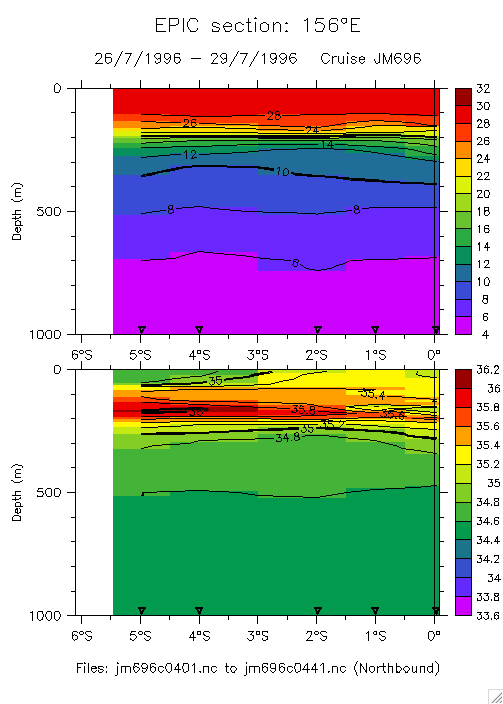
JM696
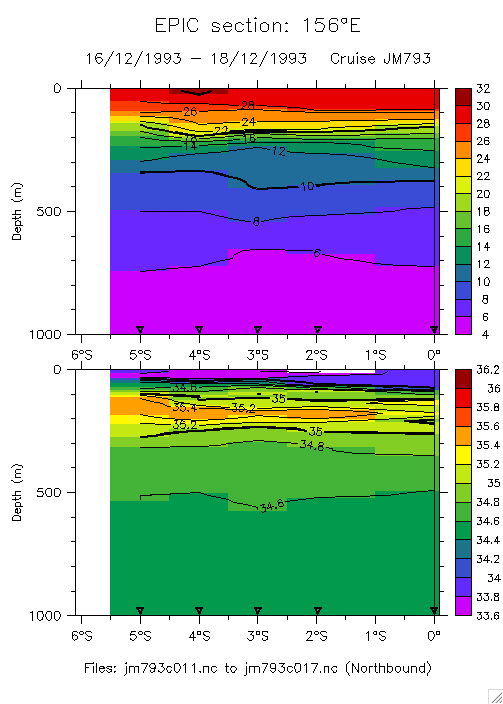
JM793
Sections NE from Makira (San Cristobal) Island
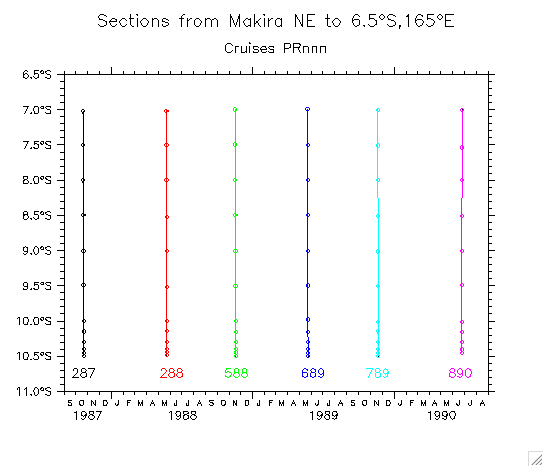
Sections NE from Makira:
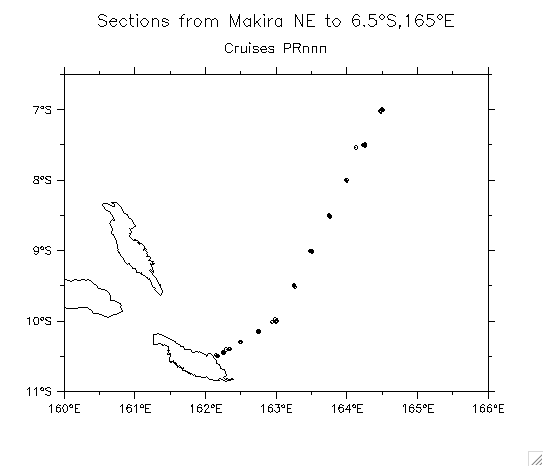
Map
Time-lat
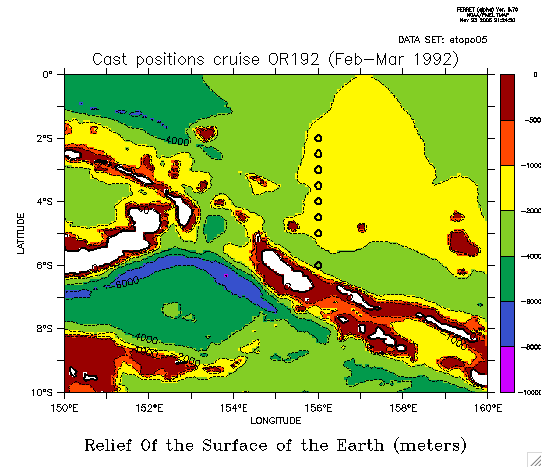
Example cruise map
(from WHOI report 91-19)
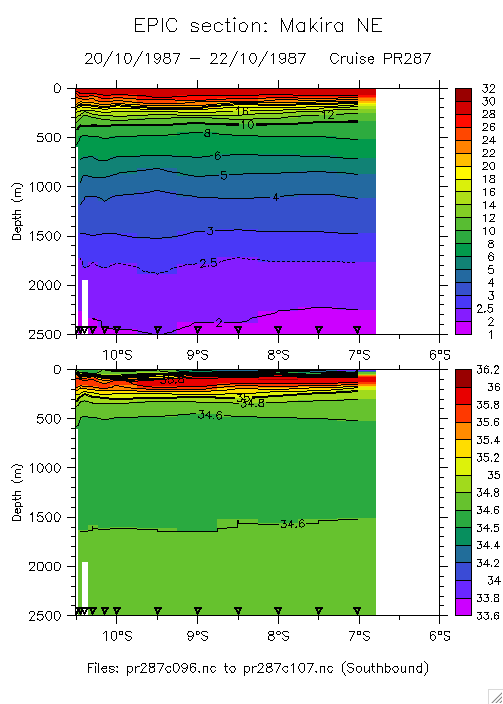
PR287:
T/S
u_g
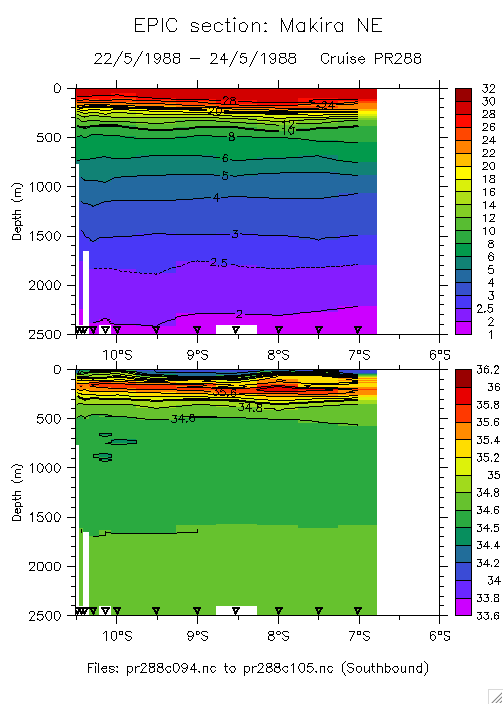
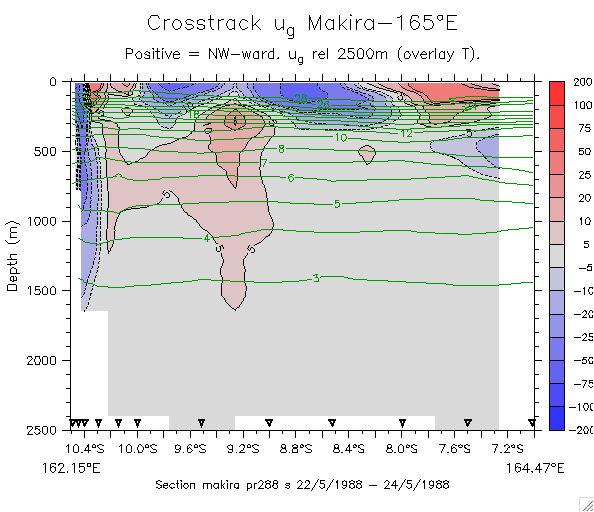
PR288:
T/S
u_g
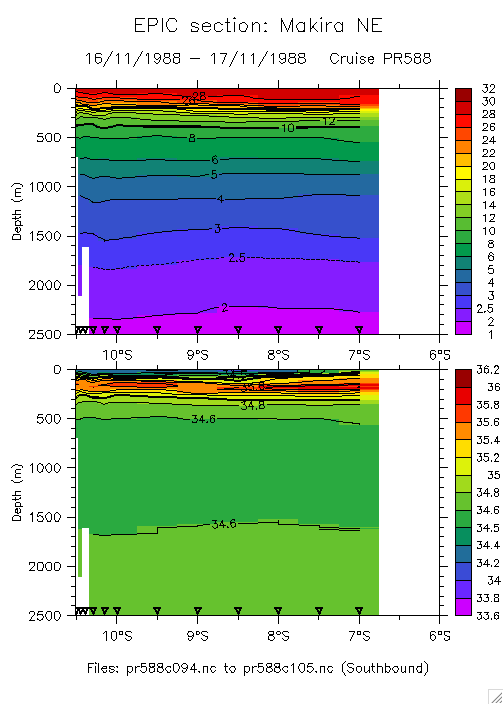
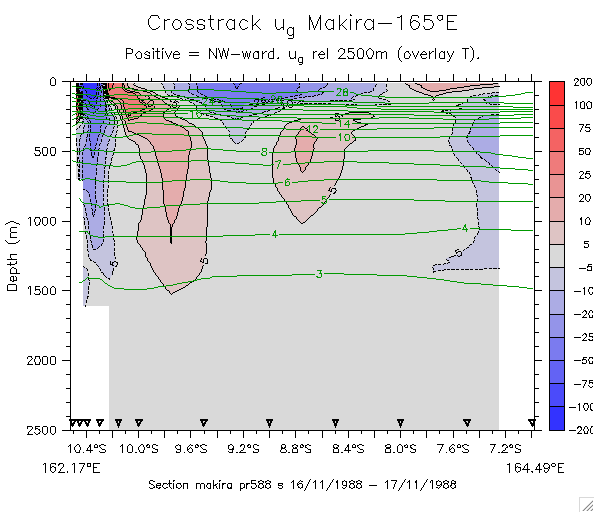
PR588:
T/S
u_g
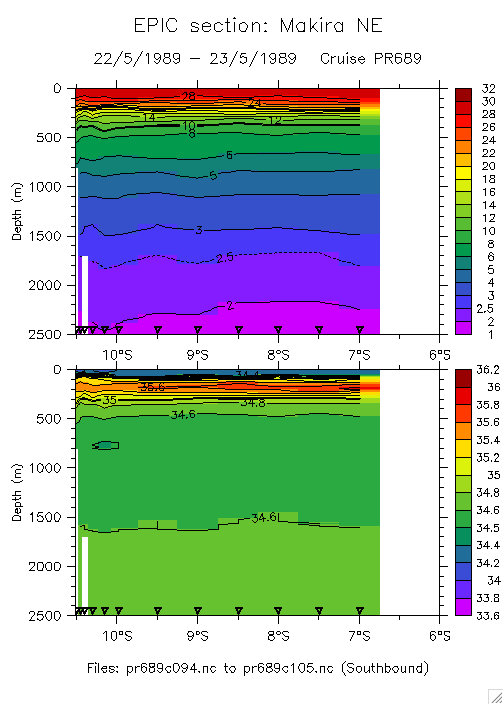
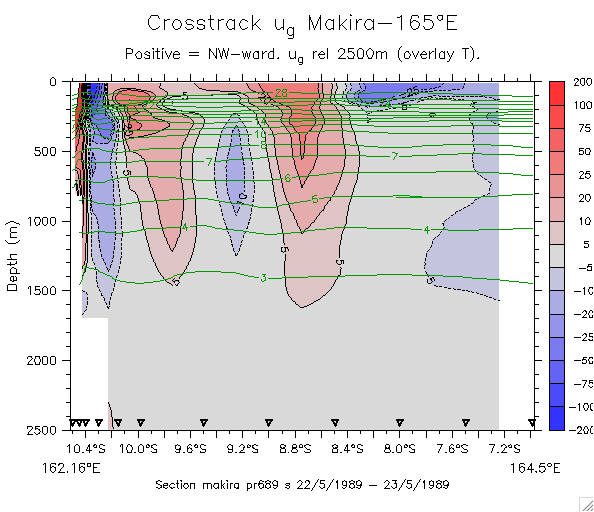
PR689:
T/S
u_g
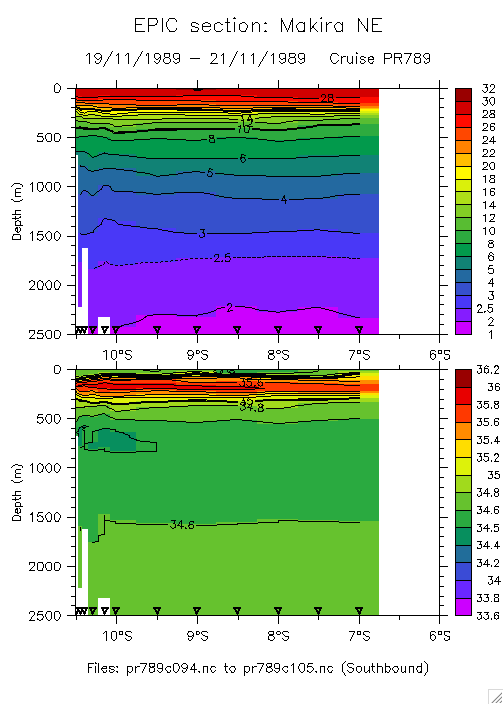
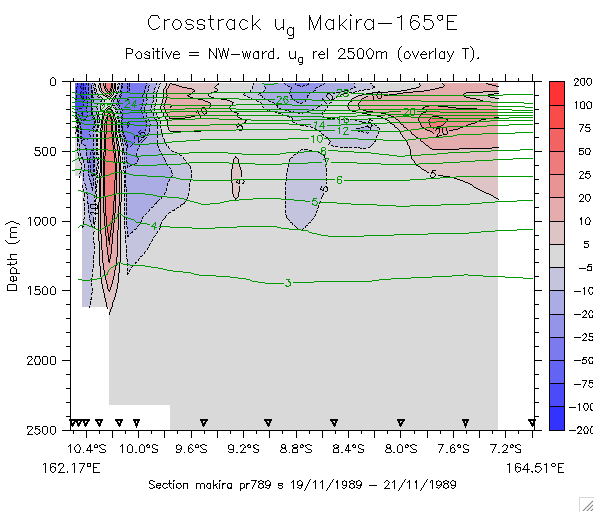
PR789:
T/S
u_g
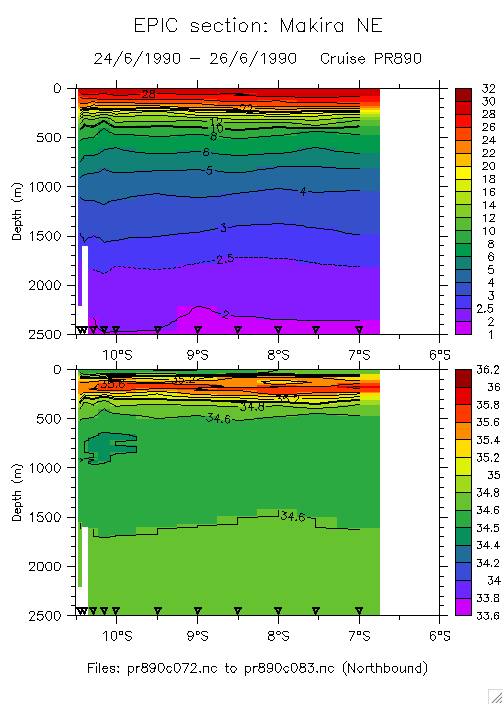
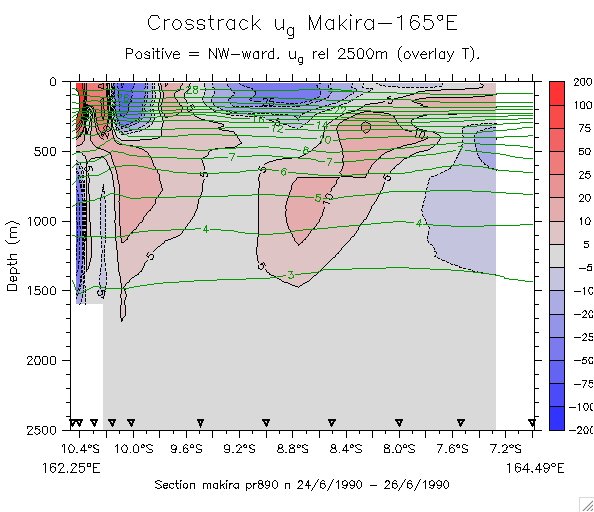
PR890:
T/S
u_g
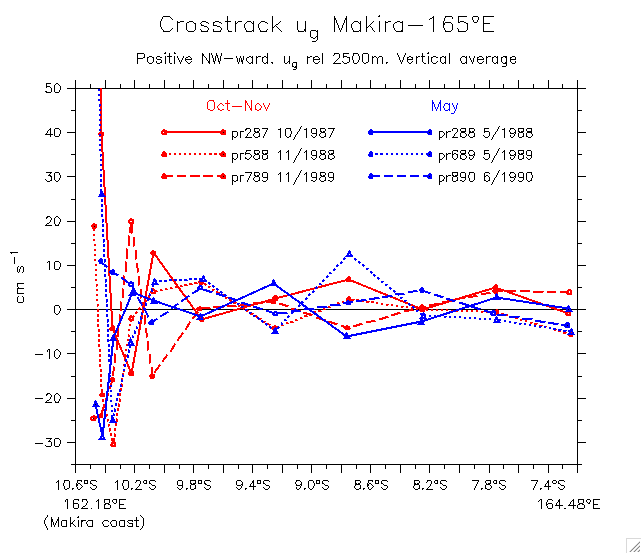
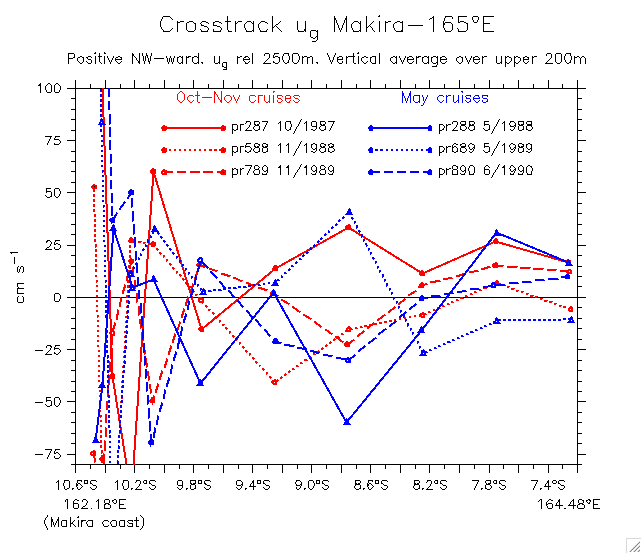
These plots side-by-side, comparing May-July vs Oct-Nov:
T/S
u_g
Vertical average of all sections (split May vs Nov)
Upper 200m only
Glider main page
Dr. William S. Kessler
NOAA / PMEL / OCRD
7600 Sand Point Way NE
Seattle WA 98115 USA
Tel: 206-526-6221
Fax: 206-526-6744
E-mail:
william.s.kessler@noaa.gov
See also:
Kessler home page
Kessler publications
PMEL home page
