
Evaluation of SST Products
The CLIvar MOde Water Dynamic Experiment (CLIMODE) was conducted in the Gulf Stream to study the thermodynamics of the subtropical mode water. A mooring placed in the active region of the SST front collected data for 15 months, at a nominal depth of 80cm.
This analysis was conducted in 2009, using products available at
that time.
Comparing Mooring Data to SST Products
Two of the products contain infrared satellite data only
(NOAA/NCDC OISST AVHRR [OISST(IR)] and NOAA/NCEP RTG [RTG]).
Two products combine microwave and infrared satellite data
(OISST: AVHRR and AMSR [OISST], and REMSS MW_IR: MODIS and AMSR
[REMSS]). The statistical comparison of the gridded SST products
to the mooring data is shown in below.
|
| The correlations (left panel) are all high and significant. The biases (middle panel) show the infrared products are warm compared to the mooring data. The error (right panel) is normalized by the standard deviation of the mooring observations.The products containing microwave data compare more favorably to the mooring data. |
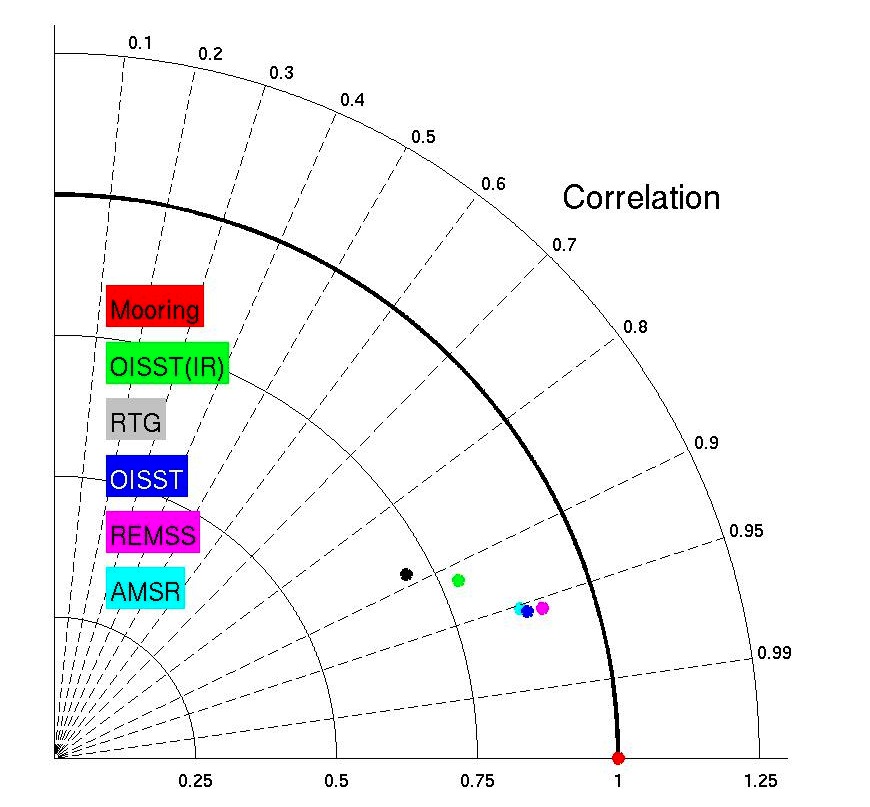 |
The Taylor diagram (Taylor, 2001) considers both the correlation between two time series and their relative magnitudes, plotted in polar coordinates, where theta = cos-1(correlation), and R is the relative magnitude of the signals compared wtih daily-averaged observations. Normalized error is the distance to the red dot on the x-axis. All the satellite based products have lower energy than the mooring data (dots inside R=1 circle). The products containing microwave data show improvement (lower normalized error) over the infrared data only. |