CS 161 Lab I - Think like a Computer Scientist (Complexity Analysis)
Due Fri Apr 03 at noon
Overview
In this lab, you'll explore the time complexity of various algorithms (such as the searching algorithms we discussed in class). You will be generating graphs demonstrating their complexity, and filling in a Lab Report about your experiments.
This lab should be completed in pairs. You will need to find a different partner than you had for the last lab. Remember to switch off who is driving and who is navigating!
Objectives
- To be exposed to analyzing the performance of algorithms
- To deepen your understanding of searching methods
- To experience writing a lab report
- To practice working with arrays and loops
Necessary Files
You will need to download and extract the BlueJ project from the Complexity.zip file. This project contains two classes for you:
-
ListSearcheris a class that will be able to perform searches on a list. You will need to fill in a few missing pieces of this class. -
PerformanceTesterThis class contains "testing" methods that can run experiments using the ListSearcher. You will NOT need to modify this class.- This class will not compile until you've finished the
ListSearcherclass in Parts 1 and 2.
- This class will not compile until you've finished the
-
ComplexityLab_Report.docx Additionally, inside the project folder you'll find a Word document called
ComplexityLab_Report.docx. This report will act as a "template" for your report--you will need to fill in a number of questions in this document (almost like a README).- Make sure that you modify the Word document inside the project folder, so that you turn it in with the rest of the project folder!
Part 1: Generating Test Data
To investigate the performance of our algorithms, we need to (a) generate some test data and (b) be able to count the number of critical operations (comparisons) the algorithms make. Both of these modifications will occur in the ListSearcher class. We'll start with (a) first.
-
Constructor: When you open the class, you should see that it contains a single instance variable, an
int[]to hold the list to search. You should fill in the constructor so that it instantiates a new integer array of the givensizeand assigns it to that instance variable. If thesizeparameter is 0 or negative, the array should be of size10.An example in the Codepad is shown below:
> ListSearcher mySearcher = new ListSearcher(5);
> mySearcher.toString()
"[0, 0, 0, 0, 0]"   (String)

> mySearcher = new ListSearcher(10);
> mySearcher.toString()
"[0, 0, 0, 0, 0, 0, 0, 0, 0, 0]"   (String)
-
Next, add a getter method called
getListSize()that returns the size of your list. -
Write a method,
generateOrderedData()that takes no inputs and returns no values. This method should fill the list with integers from 0 tosize-1in exactly that order.> ListSearcher mySearcher = new ListSearcher(10); > mySearcher.generateOrderedData(); > mySearcher.toString() "[0, 1, 2, 3, 4, 5, 6, 7, 8, 9]" (String)
-
Fill in the provided
shuffle()method. This method will randomly shuffle the values around in your list.To implement this method, you should loop through every element in the array and swap its value with a randomly chosen element that comes after it from the array.
Remember that to swap two variables, you can't just assign each value to the other--instead, you need to use a temporary variable:
//swaps ints a and b int tmp = a; a = b; b = tmp;
When implemented, you should have the following functionality:
> ListSearcher mySearcher = new ListSearcher(10); > mySearcher.toString() "[0, 0, 0, 0, 0, 0, 0, 0, 0, 0]" (String) > mySearcher.generateOrderedData(); > mySearcher.toString() "[0, 1, 2, 3, 4, 5, 6, 7, 8, 9]" (String) > mySearcher.shuffle(); > mySearcher.toString() "[5, 9, 2, 6, 0, 3, 1, 8, 4, 7]" (String) > mySearcher.shuffle(); > mySearcher.toString() "[3, 8, 9, 1, 4, 7, 5, 2, 6, 0]" (String)
(The order of the shuffled numbers will of course be different).
-
Finally, write a method
generateUnorderedData()that takes no inputs and returns no values. This method will fill your list with integers from 0 tosize-1, but in a random order. Hint: reuse the methods you just wrote! - This is a good time to switch drivers.
Part 2: Counting Comparisons
In class, we learned that searching over collections of data is one of the most commonly-used operations in computing. Here, we will explore the complexity of linear search and binary search algorithms. In this lab, we assume that the time complexity of an algorithm is the number of comparisons it has to make, as a function of the problem size (i.e., list size). Thus you will need to modify the search methods to keep track of the number of comparisons that are made.
Linear Search
-
Look over the provided
linearSearch()method inside theListSearcherclass. You should be familiar with this algorithm by now, but read through the code again to remind yourself just in case. -
In class, we learned that the amount of work to do varies based on the number of elements in the list, as well as the target you're looking for. Specifically, if
nis the size of your list, we calculated that it would take1,n, andn/2comparisons for the best-case, worst-case, and average case, respectively. Also recall the scenarios under which these cases are exhibited:- Best Case: when the target is found in the first element of the list.
- Worst Case: when the target is found in the last element of the list, or is not found.
- Average Case: when the target is found near the middle of the list.
-
Though these ideas make sense intuitively, it would be goo to verify these cases experimentally--by actually seeing how many comparisons are made. To do that, you'll need to make a few more minor modifications to the
ListSearcherclass:-
Add a new attribute called
numComparisonsthat will keep track of the number of comparisons made by theListSearcher. What data type should this be?- Remember: whenever you declare a new instance variable, assign that variable a value in the constructor!
-
Add a getter for this attribute called
getComparisons() -
Add a method called
resetComparisons()that resets the number of comparisons made to 0. This method is a lot like a setter, but doesn't take a parameter (it always sets the value to 0).
-
Add a new attribute called
-
Next, modify the provided
linearSearch()method so that it counts the comparisons made by the search. That is, every time your algorithm checks iflist[i] == target, you should increment the attribute tracking the comparisons.-
Important note: you'll need to count the comparison outside of the
ifstatement, not inside. Why do you think this is?
If everything is working properly, your interaction should look exactly like the following:
> ListSearcher mySearcher = new ListSearcher(10); > mySearcher.generateOrderedData(); > mySearcher.toString() "[0, 1, 2, 3, 4, 5, 6, 7, 8, 9]" (String) > mySearcher.linearSearch(7); > mySearcher.getComparisons() 8 (int) > mySearcher.resetComparisons(); > mySearcher.linearSearch(56); > mySearcher.getComparisons() 10 (int) > mySearcher.resetComparisons(); > mySearcher.linearSearch(0); > mySearcher.getComparisons() 1 (int)
-
Important note: you'll need to count the comparison outside of the
- This is a good time to switch drivers.
Binary Search
In addition to testing the linear search algorithm, we'd also like to test the binary search algorithm.
-
Look over the provided
binarySearch()method inside theListSearcherclass. Again you should already be familiar with this algorithm, but read through the code to remind yourself. Recall the caveat that binary search only works if the list is sorted in ascending order!The method works by comparing the middle element in the list to the target. If this element is larger, then it "throws away" the latter half of the list, and vice-versa if the element was instead smaller. These steps continue until the target is found, or if there is no more elements to throw away, in which case, the target must not be in the list.
-
In class, we learned that the amount of work to do again varies based on the number of elements in the list, as well as the target you're looking for. Specifically, if
nis the size of your list, it would take1comparison in the best case, andlg(n)comparisons in the worse case [lgis log_2, or log base 2). The scenarios under which these cases are exhibited are:- Best Case: when the target is found in the very middle of the list.
- Worst Case: when the target is not found.
- Average Case: (you'll find out soon!)
-
Next, modify the provided
binarySearch()method so that it counts the comparisons made by the search. Again, you want to count the number of times it checks if the element is equal to the target.- For our purposes, consider the entire
if/elseblock as a single "comparison" (even though we're technically doing 3 different checks to see if the item is equal to, greater than, or less than the target).
If you've done it correctly, you should be able to reproduce the following:
> ListSearcher mySearcher = new ListSearcher(8);
> mySearcher.generateOrderedData();
> mySearcher.toString()
"[0, 1, 2, 3, 4, 5, 6, 7]"   (String)

> mySearcher.binarySearch(0);
> mySearcher.getComparisons()
3   (int)

> mySearcher.resetComparisons();
> mySearcher.binarySearch(1);
> mySearcher.getComparisons()
2   (int)

> mySearcher.resetComparisons();
> mySearcher.binarySearch(2);
> mySearcher.getComparisons()
3   (int)

> mySearcher.resetComparisons();
> mySearcher.binarySearch(3);
> mySearcher.getComparisons()
1   (int)

> mySearcher.resetComparisons();
> mySearcher.binarySearch(68);
> mySearcher.getComparisons()
4   (int)
- For our purposes, consider the entire
- It is imperative for the correctness of your lab report that you count the comparisons correctly! Make sure that you can get the exact answers listed above, and check in with us if you're not sure.
Part 3: Experimentation and Analysis
Now that you can count the comparisons of your search methods, you can test to see if our discussion of their algorithmic complexities are sound. The provided PerformanceTester class includes three methods for you to use:
-
public static void testLinearSearch(int n, int numTrials, boolean unordered)This method takes in the list size
n, the number of trials, and a boolean on whether it should run over an ordered list or unordered list. It will run thelinearSearch()method over lists of increasing size and print out a summary of the results. -
public static void testBinarySearch(int n, int numTrials)This method takes in the list size
nand the number of trials (the list will have to be ordered!), and will run thebinarySearch()method over lists of increasing size and print out a summary of results. -
public static void testShuffle(int n, int numTrials)This method takes in the list size
nand the number of trials (the list's order doesn't matter), and will run theshuffle()method over lists of increasing size and print out a summary of results.
Note that these are all
static
methods, so you can call them simply by right-clicking on the PerformanceTester class in BlueJ.
Linear Search Analysis
-
Try running
testLinearSearch(1000, 1, true). This call will generate an unordered list ofn=1000numbers, and runlinearSearch()on a random target over this list one time. If you implemented everything properly in the previous section, you should get an output similar to the following:n=1000, best=672 (expected 1), worst=672 (expected 1000), avg=672 (expected 500)
Your results will probably vary (wildly) from these.
-
Let's take a minute to understand the report we just generated above. Recall our hypothesis that the best case, worst case, and average case comparisons for linear search are
1,n, andn/2, respectively.In the reported output, the best, worst, and average number of comparisons are all the same because
linearSearch()was only run once---so the "best" and "worst" number of comparisons we made were the same! As a result, the quality of these results are very low, and as computer scientists, we know that results from a single experiment cannot be taken at face value. A good scientist would repeat the experiment multiple times to get a good representation of what's really happening. -
Okay, lesson-learned. Let's get the simulator to run
linearSearch()multiple times using randomly generated targets. Repeating the experiment 10 times seems reasonable...PerformanceTester.testLinearSearch(1000, 10, true);Do the results look closer to what we are expecting?
-
We wonder what would happen if you ran more than 10 tests? Open the Lab Report (
ComplexityLab_Report.docx) and answer Q1.-
Remember to put your names on the Lab Report!
- This is a good time to switch drivers.
Generating Plots
Numbers are great for data, but pictures can be even better for understanding results. Thus you should include some charts that visualize the results of your experiments.
-
Run the
testLinearSearch()experiment forn=1000, 2000, 3000, ..., 10000. Remember to use the value that worked best for you asnumTrials, and to use an unordered list. You will want to record the results of all of these runs (if you set the BlueJ terminal to not "Clear screen at method call", then the results should stick around). For example:n=1000, best=1 (expected 1), worst=1000 (expected 1000), avg=502 (expected 500) n=2000, best=1 (expected 1), worst=2000 (expected 2000), avg=1011 (expected 1000) n=3000, best=1 (expected 1), worst=3000 (expected 3000), avg=1507 (expected 1500) n=4000, best=1 (expected 1), worst=4000 (expected 4000), avg=2007 (expected 2000) n=5000, best=2 (expected 1), worst=5000 (expected 5000), avg=2509 (expected 2500) ... etc
-
Let's summarize this data in a visual graph (or plot). Open up your favorite spreadsheet tool, like Sheets on Google Docs or Excel. The following example shows how to generate charts using Sheets on Google Docs.
-
Open a browser and navigate to Google Docs
(https://docs.google.com/).
You will need to use a Google ID (like your Gmail login) to sign in. Once logged in, click on the hamburger icon (the striped-lines button on the top-left corner), and select Sheets. Next, click on the
+button on the bottom-right corner and it should generate a new blank spreadsheet. Let us know if you have troubles getting this far. -
Once you have a blank spreadsheet in front of you, start plugging in your results for
n, the Best Case, the Worse Case, and the Average Case as follow: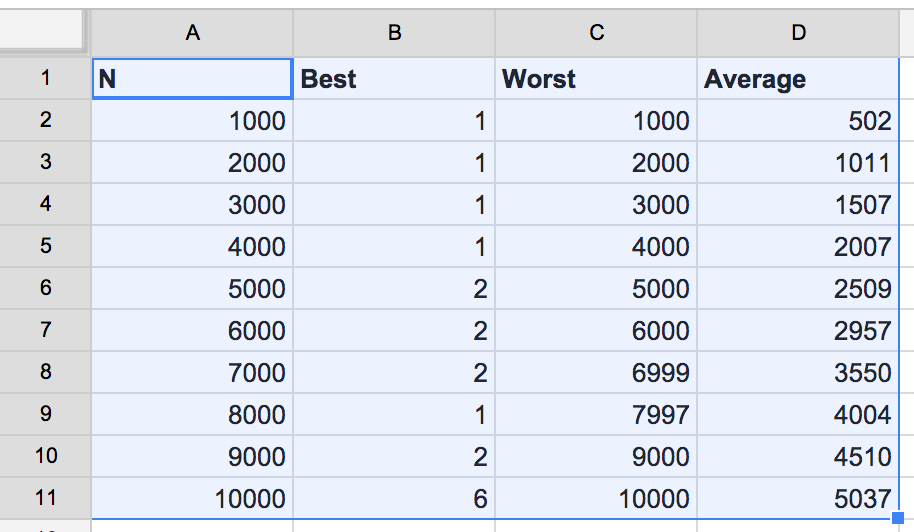
You will need to include the row and column labels as well!
-
Double-check that all of your data is entered correctly. Then select your data (including the first row containing labels). From the menu bar, click
Insert > Chart.... This will bring up a new dialog box that looks like the following. Make sure you place checkmarks inUse Row 1 as HeadersandUse Column A as Labels.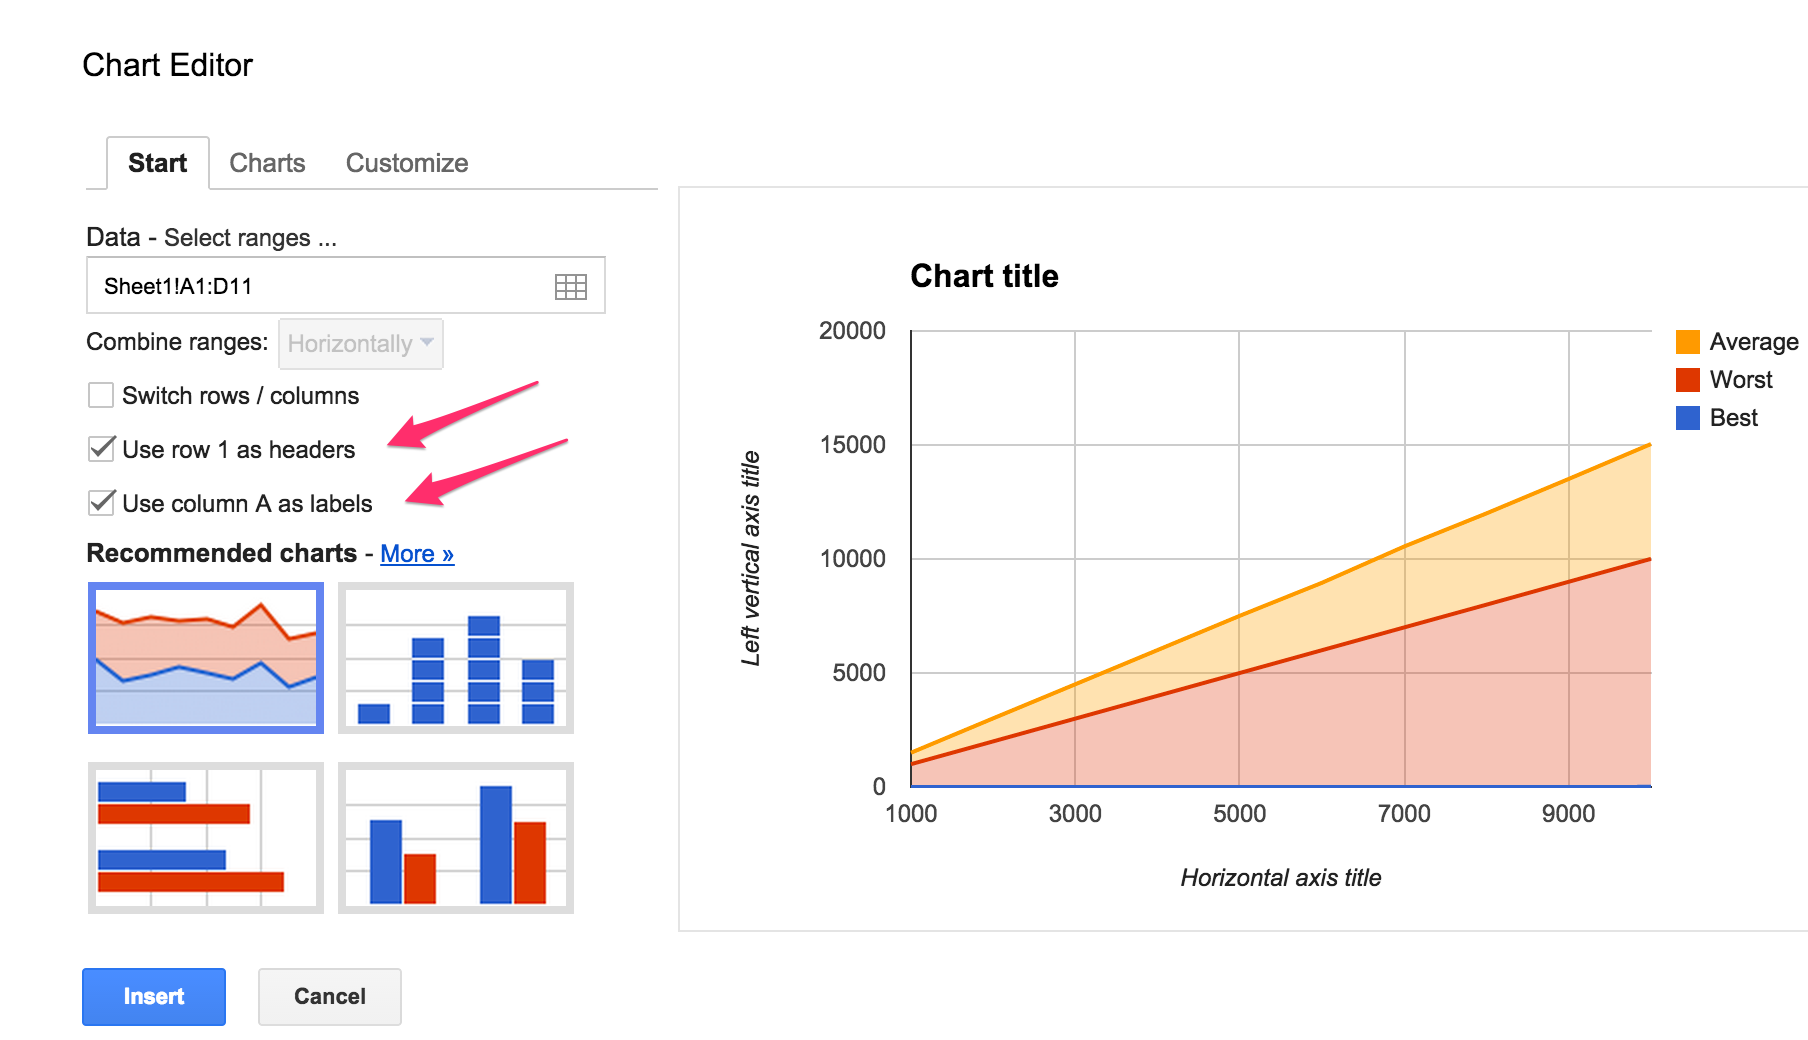
-
Now you need to decide the best kind of graph to visualize your data. For these results, the best option is a simple line-graph. From the dialog, click on the
Chartstab. Make sureLineis selected on the left-hand panel, then select the top option (for straight lines). Do not hit Insert yet!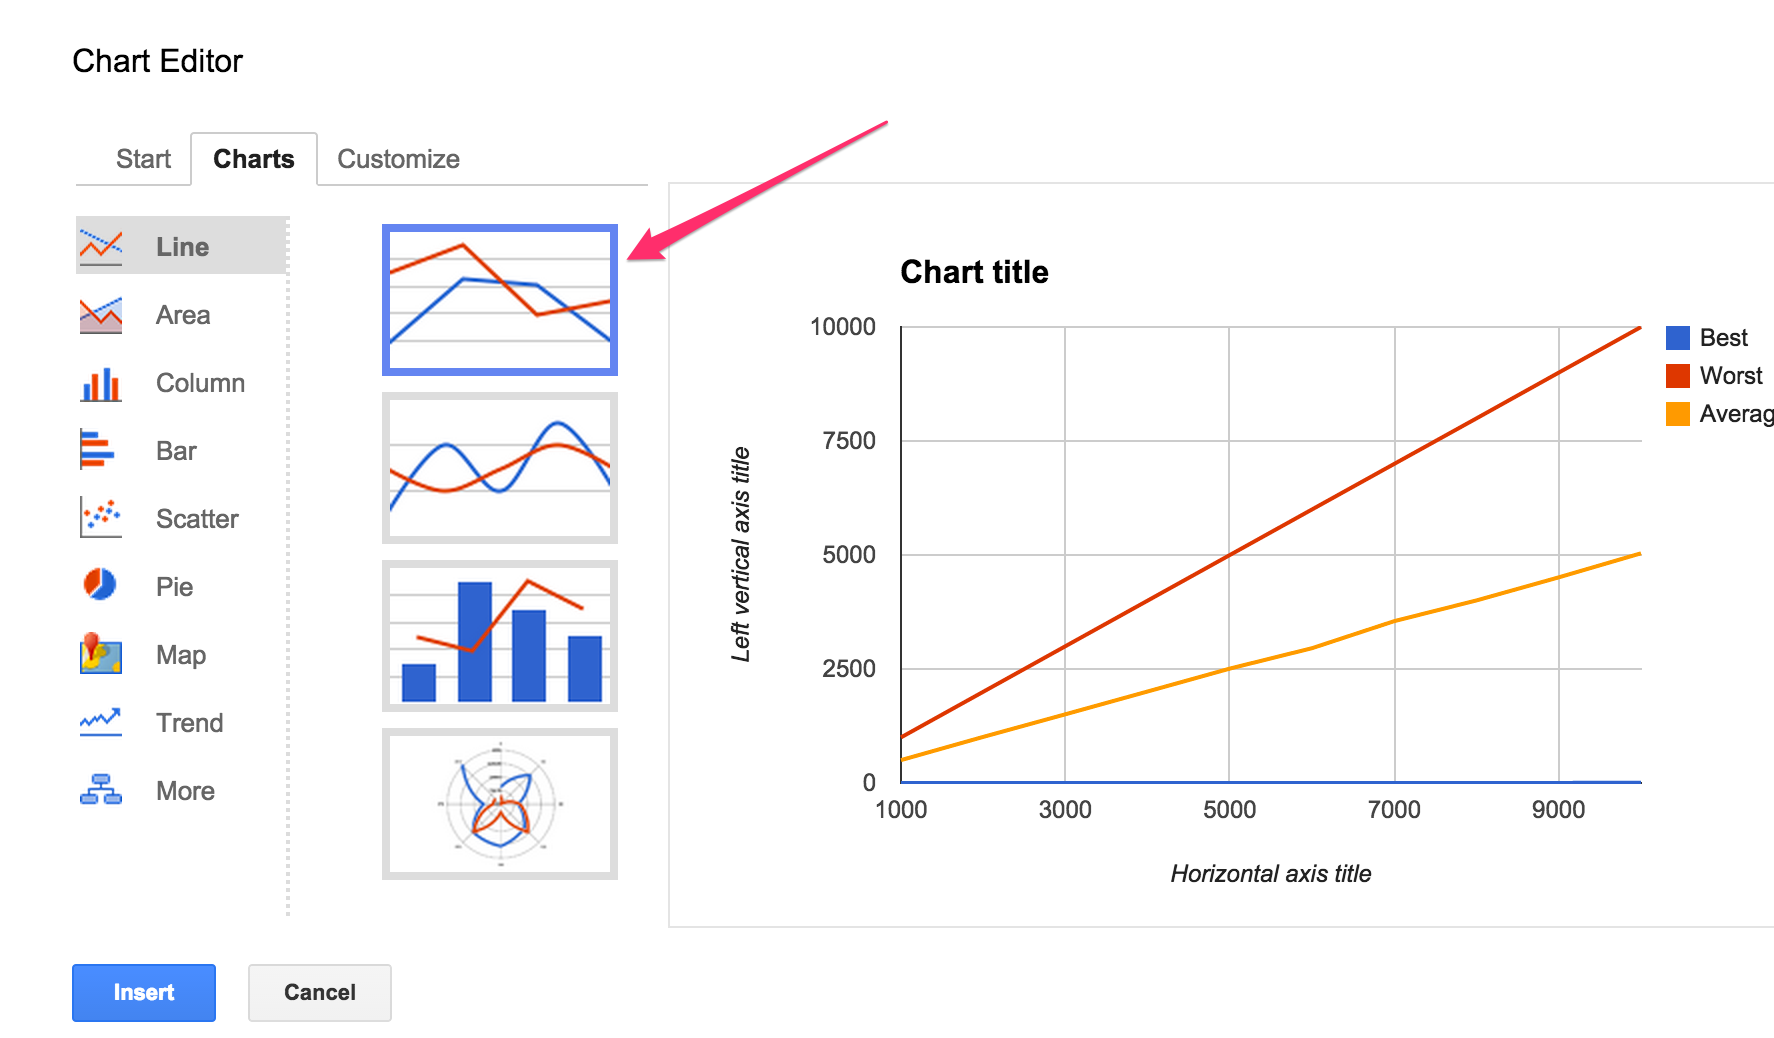
-
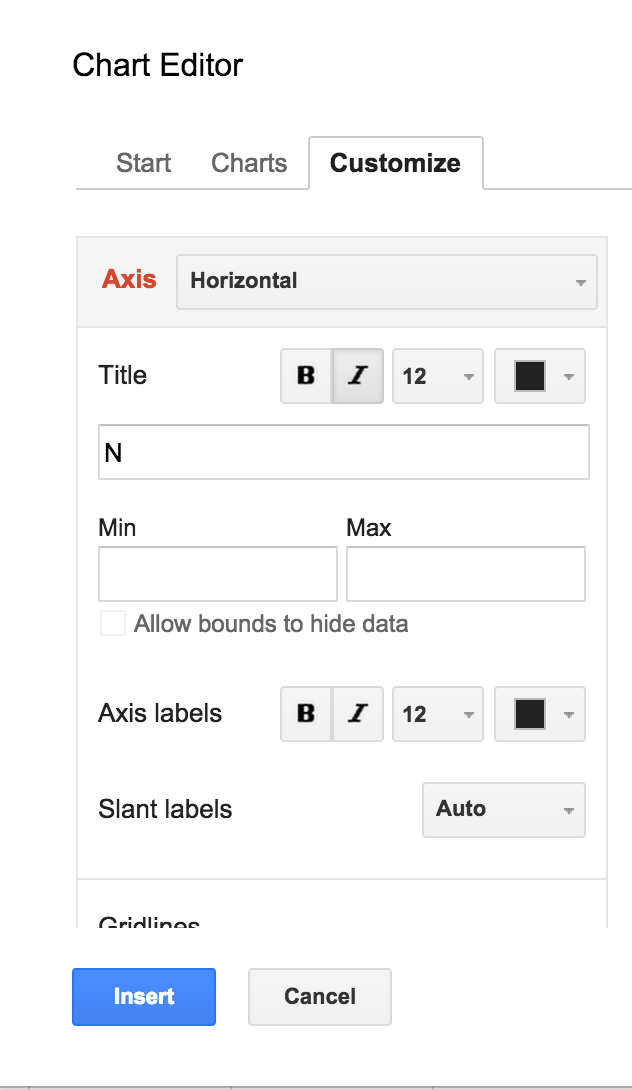
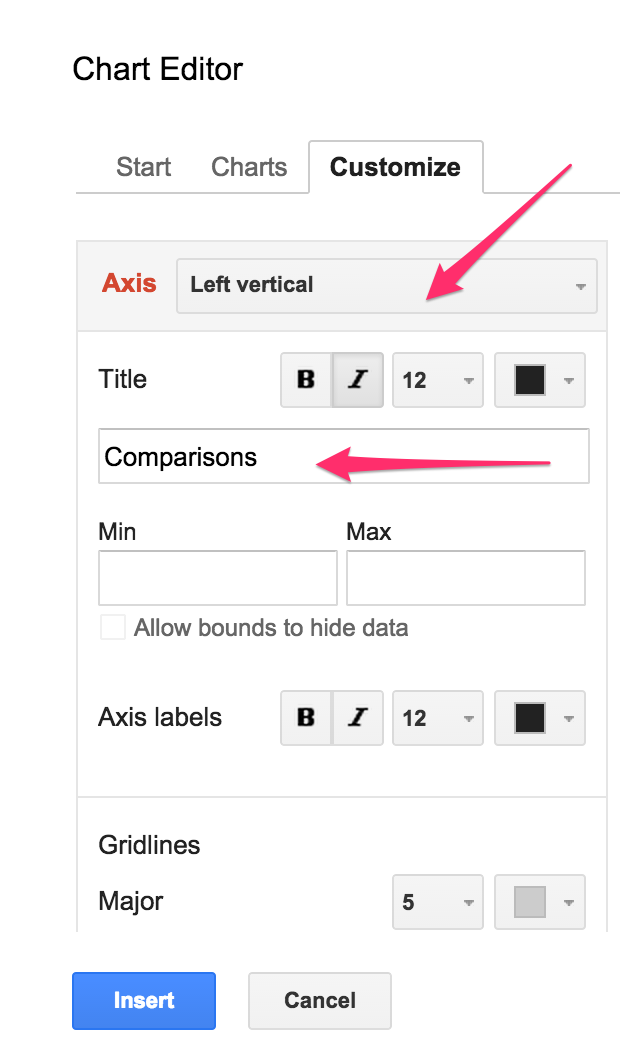
Inside the same dialog, click on the
Customizetab. Give your chart a title (e.g.,"Linear Search Complexity"), then scroll down half way to findAxis:-
Label your Horizontal Axis
"N (List Size)" -
Label your Left Vertical Axis
"Comparisons"
-
Label your Horizontal Axis
-
Now you can click the
Insertbutton at the bottom and you should see the Chart!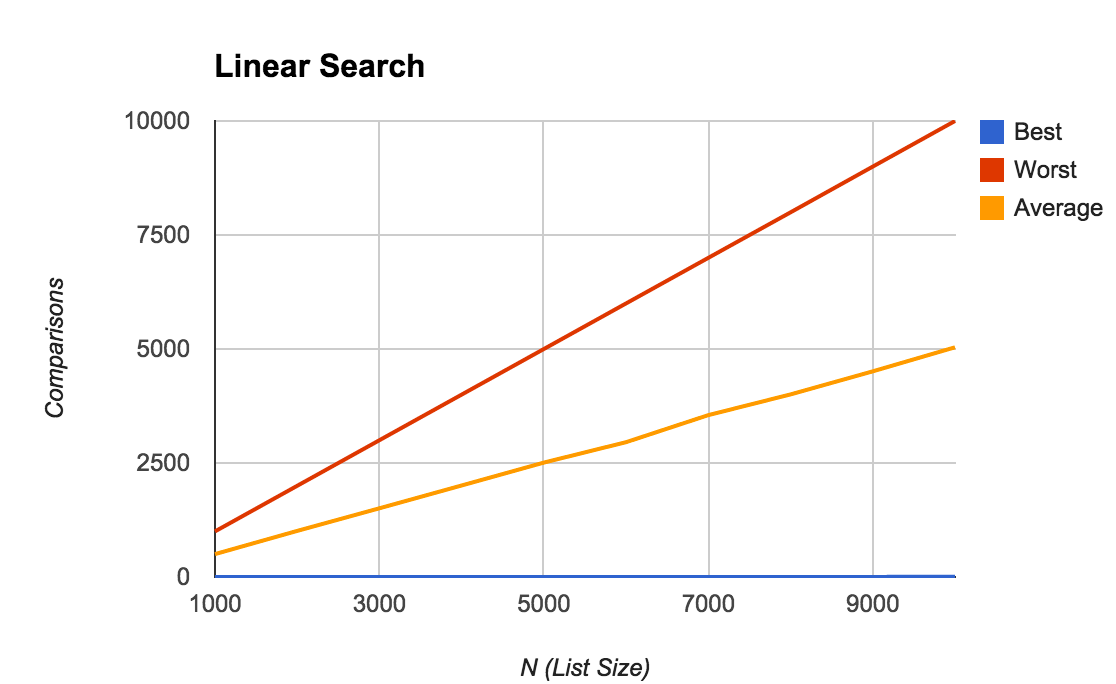
- Finally, copy-and-paste this Chart into the appropriate place in your Lab Report under Q2.
-
Open a browser and navigate to Google Docs
(https://docs.google.com/).
You will need to use a Google ID (like your Gmail login) to sign in. Once logged in, click on the hamburger icon (the striped-lines button on the top-left corner), and select Sheets. Next, click on the
- Now fill in the rest of Section 1 of the lab report, using the same process as above.
- This is a good time to switch drivers.
Binary Search Analysis
-
Try experimenting with the
PerformanceTester.testBinarySearch()method. Note that this method has no boolean flag to indicate whether it should generate an ordered or unordered list---it always generates an ordered list, because binary search relies on this ordering to work! -
Try running this test with the same number of trials you found that worked best from the linear search experiments. Again, vary
n=1000, 2000, 3000, ..., 10000. - Continue to fill out Section 2 of the Lab Report. You'll need to generate another chart with the the best, worst, and average-case results (each as a different series). Again, paste the chart into the proper place in your Lab Report. If you juxtapose the two charts (between Linear Search and Binary Search) and you can see the power of Binary Search! Also, what can you glean about the average-case time complexity of binary search? Is it more like the best-case, or the worst-case? Fill in your conclusion in the Lab Report.
- This is, yet again, a good time to switch drivers.
Part 4: Shuffle Analysis
So far, you've only had to verify algorithmic complexities of algorithms that we've already covered in lectures. Now it's time to make your own hypothesis!
-
Consider again the
shuffle()method you wrote in theListSearcherclass. For this method, we'll consider a "critical operation" (like comparisons in search) to be a swap (where we exchange the value in two spots in the list).Study the code carefully, and then reason about its best, worst, and average case complexity (in terms of number of swaps) as a function of the list size
n. For each case, write down in your Lab Report (1) the scenario under which the case would be observed, and (2) a (simple) equation expressing its complexity. -
Like you did with
linearSearch()andbinarySearch(), modify this method to count the number of critical operations (swaps) that occur. You'll need to count this using thenumComparisonsattribute you created.- Ideally, we'd refactor our code so that we were counting
numOperationsas a generalization of the number of comparisons... but that would take time we don't have, so we'll just use slightly misnamed code for now. This is something you would want to fix in a homework or any other future projects you do! - A swap involves 3 assignments, but we count those 3 statements as a single swap.
- Ideally, we'd refactor our code so that we were counting
-
Again, run some experiments on your algorithm (using the provided
PerformanceTester.testShuffle()method). As before, varyn=1000, 2000, 3000, ..., 10000. - In your spreadsheet program, generate another plot with the best, worst, and average-case results. Copy-and-paste this plot into your Lab Report, and answer the final questions.
- Double-check that your names are on the report, and that you have answered all the questions. Remember to save your report before you close it!
Extensions
These extensions are not worth any extra credit, but are good practice to complete.
- Write a method called
reverseList()that reverses the list. You should keep aleftand arightindex, pointing at 0 and the last element of the list, respectively. Swap the left and right elements, and move the left and right indices one step closer together. Continue doing this until the indices cross. Then analyze the complexity of this algorithm.
Submitting
-
Make sure both of your names are in a JavaDoc comment at the top of the
LinearSearcherclass, as well as on your Lab Report. If your names aren't on your assignment, we can't give you credit! - Make sure your Lab Report is saved inside the BlueJ project folder.
-
Right-click on the project folder, then:
- If using Linux, select Compress...
- If using Windows, select Send to and then Zip file
- If using Mac, select Compress ... items
This will let you take the selected folder (or files) and generate a new compressed
.zipfile. -
Navigate to the course on Moodle
(Lecture Section A),
(Lecture Section B).
Upload your
.zipfile to theLab I Submissionpage. Remember to click "Save Changes"! You may submit as often as you'd like before the deadline; we will grade the most recent copy. - While you're on Moodle, remember to fill out the Lab I Partner Evaluation. Both partners need to submit evaluations.
Grading
This assignment will be graded out of 22 points.
- Implementation (8pt)
- [1pt] You have implemented the
generateOrderedData()method - [2pt] You have implemented the
shuffle()method so that it shuffles the list - [1pt] You have implemented the
generateUnorderedData()method using previous methods - [2pt] You have added the
numComparisonsattribute and its getter/setter - [2pt] You have modified the
linearSearch(),binarySearch(), andshuffle()methods to count comparisons - Lab Report (11pt)
- [1pt] You have correctly answered Q1 in the lab report
- [1pt] You have correctly answered Q2 in the lab report (with a generated plot)
- [2pt] You have correctly answered Q3 in the lab report
- [1pt] You have provided a conclusion to Section 1 of the lab report
- [1pt] You have correctly answered Q4 in the lab report
- [2pt] You have provided a conclusion to Section 2 of the lab report
- [2pt] You have correctly answered Q5 in the lab report
- [1pt] You have provided a conclusion to Section 3 of the lab report
- Style & Documentation (3pt)
- [1pt] All plots have appropriate titles and axis labels
- [1pt] Your code and lab report show proper style and formatting!
- [1pt] You submitted a lab partner evaluation