CS 161 Homework 3 - Bar Graph Generator
Due Wed Sep 25 at 11:59pm
Overview
In this assignment, you will be writing a program that will generate simple bar graphs from a list of data points you provide. This is the same kind of program used in software like Excel!
Your program will use the terminal to solicit data values from the user: it will give the user a series of "prompts", and the user will type in the labels and values for each data point. The user should provide both a title for the graph, as well as labels and values for four (4) data points. An example interaction is shown below:
Welcome to the bar graph creator.
What is the title of your graph? Arbitrary Values
First data label: Alice
First data value: 8
Second data label: Bob
Second data value: 12
Third data label: Charles
Third data value: 3
Fourth data label: Doris
Fourth data value: 7
Generating graph...
The text in italics was typed in by the user.
After the user has entered this information, your program should display a window showing the bar graph. For example, the above entries would produce a graph similar to the following:

Some elements to notice about this window:
- The title of the window is the title of the graph as entered by the user.
- Each data point is labeled at the bottom.
- The dependent-variable (the y-axis) is labeled with "tick" marks. Moreover, the scale on the axis corresponds to the range of values entered by the user: if I had typed in 100, 200, 300, and 400 as values, the numbers on the scale would be much larger.
- Each bar should be a different color---but you can use any colors you like!
- You are also welcome to add any further decorations you wish :)
This assignment should be completed individually.
Objectives
- To practice working with input (via the Scanner) in Java.
- To make a simple graphical application.
- To continue practicing working with variables and mathematics to produce dynamic programs.
- To practice creating a new class with instance variables and a constructor.
Necessary Files
You will be creating your own program from scratch for this assignment---select "Project > New Project" from the BlueJ menu to create a new project.
You will need to download a copy of the README.txt (right-click on the link and select "Save Link As" to download the file) to fill out and turn in along with your assignment.
Also be sure to review relevant portions of the textbook: Chapters 2.9, 2.10, and 4.3.1.
Assignment Details
Below are some details and tips for developing your program. Note that the steps are not as explicit as in previous assignments---you should be able to develop this program on your own. But if you get stuck, you are welcome to ask for help!
- DO THIS FIRST: Before you read ahead, take a few minutes and think about how you would solve this problem! What classes do you think you'll need? What methods will they have? How might those methods fit together? Forming a mental model of how your program will work will make completing the assignment much easier!
-
Your program should have two classes: a
BarGraphclass and aBarGraphGeneratorclass. TheBarGraphGeneratorclass should be like a "tester" class--it has a main method that prompts the user for values using the Scanner, and then creates the window with the bar graph. TheBarGraphclass will be a drawing class like those described in Chapter 2.9 (though see below for some changes). -
Your
BarGraphGeneratorwill need to use the Java Scanner to read user input.- Remember to import
java.util.Scannerat the top of the class! -
You will need to read in both text and numbers. You can read text by using the
nextLine()method (which will read all the text until the end of the line--when the user hit "enter"--allowing labels to have multiple words). You can read numbers by using thenextInt()ornextDouble()methods. However remember that you will need to callreadLine()after you read a number, so that there isn't a line break left floating in the scanner! - If you want to have the user's typed-in text appear on the same line as the prompt, you can use the
System.out.print()method instead ofSystem.out.println().print()works exactly the same asprintln(), it just doesn't add a line break to the end. - Note that the terminal window will only pop-up when you call
System.out.println(); make sure that you print a "prompt" for the user before demanding input! If you accidently close the terminal, you can reopen it by selecting "View > Show Terminal" from the BlueJ menu.
- Remember to import
-
Your
BarGraphclass should utilize the drawing template from the text: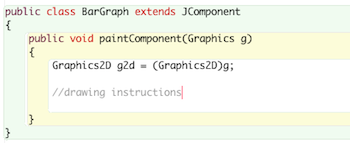 This will enable you to add a
 BarGraphobject to a JFrame, and to draw shapes on it.- Remember to import the
java.awt.*andjavax.swing.*packages at the top of any classes where you use GUI components like JFrames, andjava.awt.geom.*at the top of any class where you're drawing shapes. -
Creating your
JFramewill have one significant difference from the book's example. The book has you call thesetSize()method on the frame in order to specify its size. However, this gives the size of the entire window including the title bar, etc. When we're drawing, we often care more about the size of our drawing area--that is, the size of theBarGraph.So rather than specify the size of the
JFrameobject, we will specify the desired size of theBarGraphobject, and then tell Java to make theJFramebig enough to fit that drawing. We specify the desired size of the bar graph object with the following method call:barGraphObject.setPreferredSize(new Dimension(width,height));
In this case, rather than passing in twoints for the size, the method has us create a newDimensionobject, which is an object representing a set of dimensions (a width and a height)--the width and the height are specified when we create the dimension. This lets us tell Java how big the bar graph object should be. Note: 500x500 pixels is a good size for aBarGraphFinally, we tell Java to make the frame large enough to fit the
BarGraphwith the following method:frame.pack();
We include this code immediately before we make the frame visible. This should let your frame fit your BarGraph, rather than forcing you to account for the (unknown) size of the window's title bar.
- Remember to import the
-
I recommend you begin drawing your graph with "hard-coded" labels and values. Don't worry about doing it dynamically yet, just figure out the coordinates that makes your graph show up nicely. Once you have done that, you can "pull out" the coordinate numbers that might change and place them into variables. For example, if your code is:
g2d.drawString("Hello World!", 10, 20);and you decide that the x-coordinate of that command will be variable, you can change your code to:int xCoord = 10; g2d.drawString("Hello World", xCoord, 20);This is called "refactoring" your code, and is a good way to add functionality once you have the basics in. Then you can just change what value you assign to thexCoordvariable to make your code dynamic! -
You'll need to figure out the proper math to make your graph display dynamic (that is, to make sure that the axis labels are correct and that the bars are the correct height). This kind of math is very common in computer science--and is why this course fulfills a math requirement! A few tips:
-
In order to figure out the range for the y-axis, you'll want to find the maximum of your data values. There is a
Math.max()function that gives you the maximum of 2 numbers... how can you use this method to find the maximum of 4 numbers? Think about how you might do it on paper! - Once you have the maximum value, you can figure out what numbers to put at each tick mark (dash) by taking the maximum range and dividing it into a number of portions.
- In order to calculate the height of each rectangle, I recommend you calculate the number of "units" per pixel. If your maximum value is 20 and your graph is 400 pixels height, then each pixel is worth 20/400=0.05 units.
- For drawing rectangles, once you have calculated the width and the height, you can subtract from where you want the "end" of the rectangle to be (on the bottom of the graph) to figure out the starting {x,y} coordinates.
-
In order to figure out the range for the y-axis, you'll want to find the maximum of your data values. There is a
-
You can use whatever colors you like for the bars: you can use the constants from the Color class, or define your own Color objects using
Color mycolor = new Color(redValue,greenValue,blueValue);where each value is a number between 0 and 255. If you want to pick a nice set of complementary colors, you might check out an online matching tool such as this or this, which will give you red/green/blue values. If you need help, let me know! -
Once you've got your graph being drawn correctly, you'll need to make sure that you can take the values from the user and give them to the
BarGraphobject. Because theBarGraphwindow may be redrawn multiple times (like if you cover it up and reveal it again), you'll need to store these variables in the object's state---that is, you'll need to make instance variables for them (we will discuss this in class; see also Chapter 3).- Remember to make your instance variables
private! -
You can have your graph use the instance variables in the draw method by referencing them as
this.variableName
After you've set up your instance variables, you'll need to define a constructor for your
BarGraph. This constructor should take in all the user-specified variables as parameters, and then store them in the instance variables---and that's in!- We will talk about constructors in class, but possibly close to the assignment due date--you should make sure everything else works so that you can add in this final piece and turn in the assignment on time!
- Remember to make your instance variables
- Be sure and test your code as you write! Don't try and fix syntax errors or display bugs at the last minute; write a small piece of your program, then run it to make sure it works. And remember to test with multiple different sets of inputs!
- You should also include plenty of comments in your program--use them to explain your graph drawing math, to label sections of code, etc. Comments are about making your code readable and explaining why you wrote what you did.
Extensions
You can extend this assignment by adding extra decorations to your graph. Maybe dotted lines at each tick mark? Remember to use helper methods to break up your code if it gets complicated!
If you've got lots of time, you might try making a different kind of graph. Line graphs are pretty straightforward--but if you're feeling really adventurous, you can try to make a Pie Chart. You'll likely want to use the
fillArc()
method of the Graphics2D object.
Submitting Your Assignment
- Be sure and test your program thoroughly to make sure it works, and make sure it is documented with lots of comments!
-
Remember to download the
README.txt
file and to place it in your project directory. Once you've downloaded it you can open it in BlueJ by double-clicking on the
 icon.
icon.
-
Upload the entire BarGraph project directory (including both the
BarGraph.javaandBarGraphGenerator.javafiles, as well as the README.txt) to the Hwk3 submission folder on the hedwig server. Make sure you upload your work to the correct folder!. - This assignment is due at midnight on Wed, Sep 27.
Grading
This assignment will be graded on approximately the following criteria:
- Your program reads terminal input from the user [20%]
- Your program creates and displays an appropriate window with a bar graph [10%]
- Your bar graph has axes bars, tick marks, labels, and different colored data bars [5%]
- Your
BarGraphclass stores and references data in its instance variables [20%] - The axis labels on your bar graph reflect the user input [15%]
- Each bar in the bar graph is the appropriate size [20%]
- Your code is properly formatted (indentation, etc), has comments, and is otherwise readable [5%]
- You have completed the included README.txt file [5%]