This tutorial is written around Microsoft Visual Studio 2005. Debugging tools in different compilers will vary somewhat, but, generally, all support the capabilities that are presented here. The methodologies and tools discussed address the most common issues. What we can call phase of the moon types of problems that occur once every several weeks or after long sequences of input patterns are not discussed. These types of problems are much more challenging and require a lot of insight and patience.
Let’s begin with a bit of background. The first rule of debugging is that debugging is different from testing. When you are testing, you know that what you are testing worked at one time and now it’s broken. When you are debugging, you know that what you are debugging never worked.
The second rule of debugging is to change your mindset from trying to get your design to work to trying to figure out why it doesn’t work. Thus, you want to look at things down into small pieces….modules, functions, classes, structs, loops, and the like.
For any such entity that you are trying to debug, you must know what the inputs should be and, for those inputs, you must know what you are expecting on the output. If you don’t know this, then you cannot debug something. Observe that I’m carefully using the words ‘should be’. If, because of a design error, the inputs are not what you expect, then certainly the chances of your outputs being correct are reduced.
All of that said, several things seem to be key. The first are static. Thus, we want to be able to stop a running program at a specific line of code. Next, we want to be able to look at the variables of interest to see what their values are…to determine if they are what we were expecting or not.
For this tutorial, we will use the code contained in Appendix A. The program is written in C because everyone should be familiar with that language.
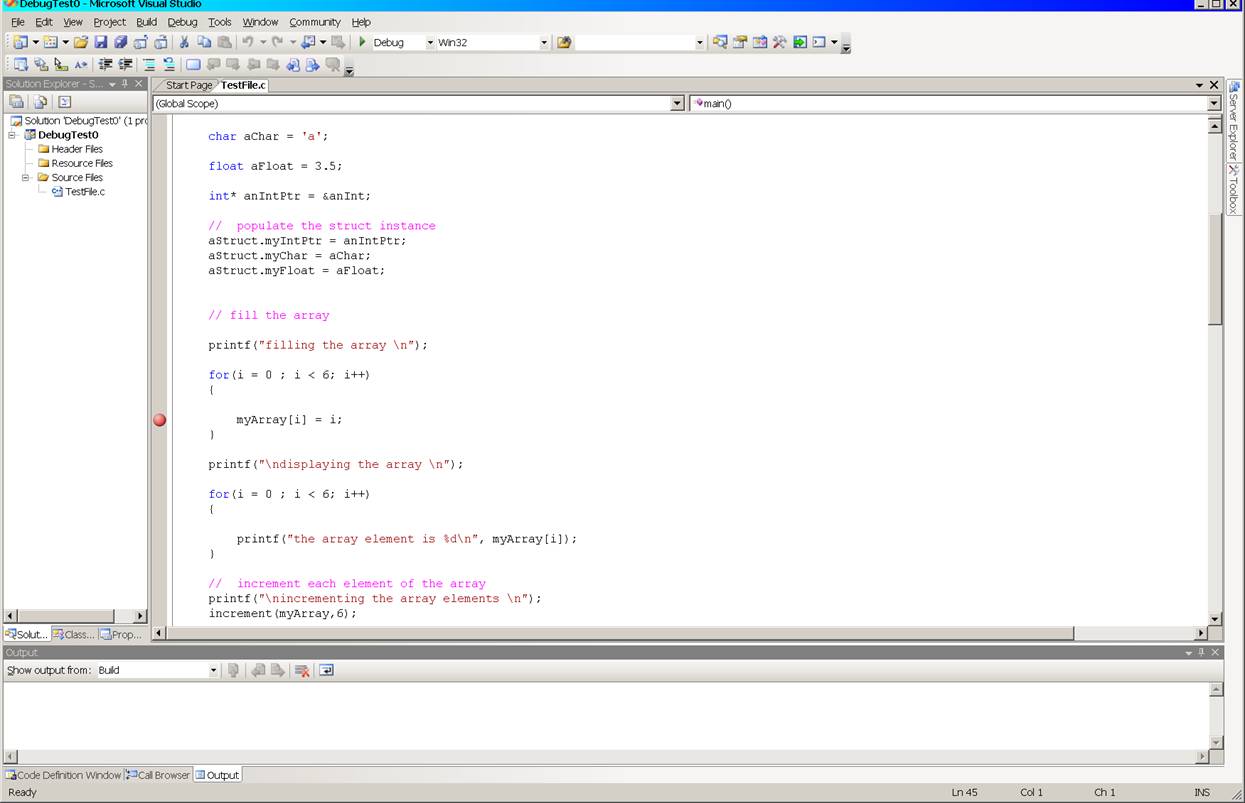
In the figure, a breakpoint, signified by the colored ball, has been set on the line of code
myArray[i] = i;
To unset the breakpoint, select and click it one more time. When the program is now run selecting either Start Debugging under the Debug menu or striking the key F5, the program will run until execution reaches the breakpoint when it will stop.

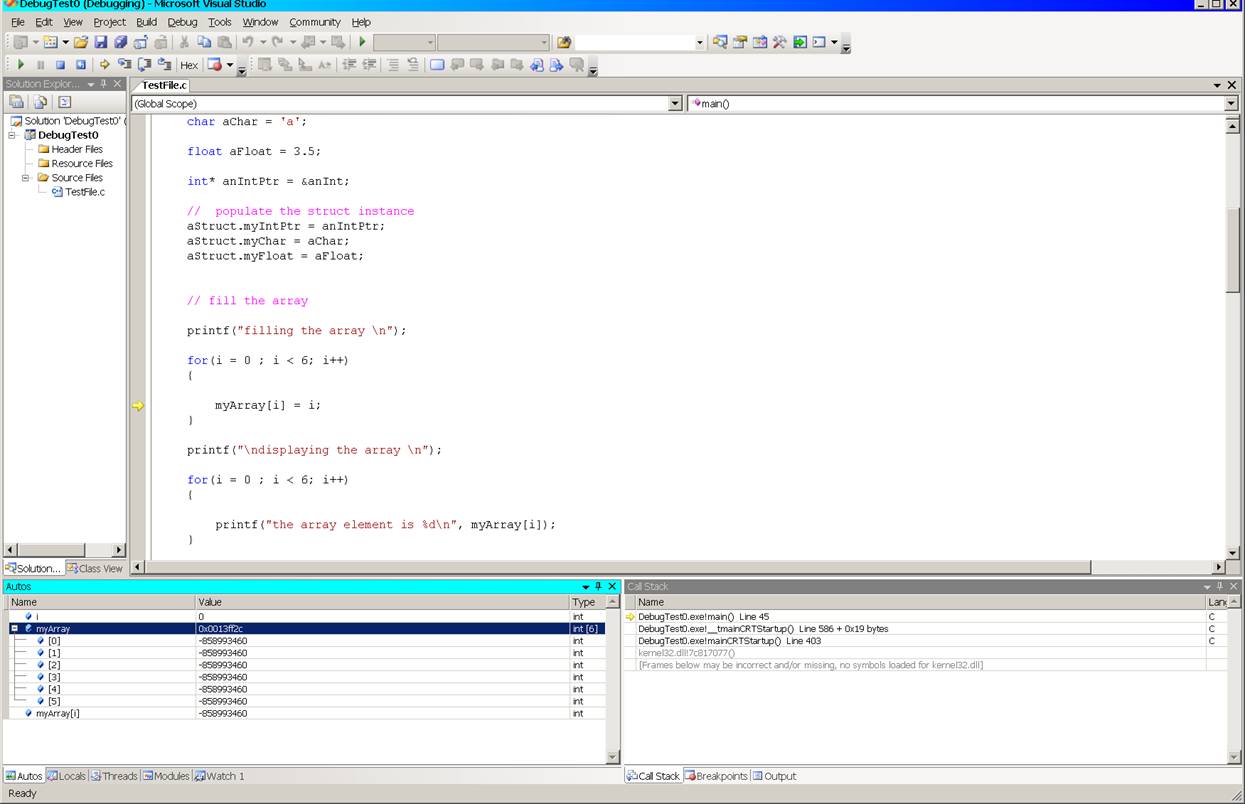
If we do that, we see that the program has indeed stopped. This is indicated by the yellow arrow at the breakpoint. The left hand pane of the bottom two windows show the value of the variable i and the contents of the array, myArray. Note that i has the value 0 as we expect and that the contents of the array is junk…we have not initialized it.
While breakpoints are handy, personally, most of the time I prefer the more convenient right mouse menu shortcut called Run to Cursor. Placing the cursor on the line at which I want to stop and then executing this action accomplishes two things. First, it runs the program in the debug mode (the same as striking the key F5) and second, stops the execution on the line I’ve selected (the same as setting a breakpoint on that line). This way I done have to be continually setting and resetting breakpoints.
We see this in the next figure; execution has stopped at the yellow arrow and the state of the variable i and the array are displayed as before. Unfortunately, trying to capture the menu using the alt Print Screen kills the menu. Trust me, it works.
If we place the cursor on the program line
printf("\ndisplaying the array \n");
select Run to Cursor, highlight the variable myArray when execution halts, and select the right mouse menu item Add Watch, we will see the contents of the array displayed in the left hand pane of the lower window. Next, if we select the right mouse menu item Quick Watch, we will see the QuickWatch window open and similarly display the contents of the array. Observe that we could also add a watch on myArray using the Add Watch selector button in the QuickWatch window if we decided we wanted to track this variable’s behaviour.
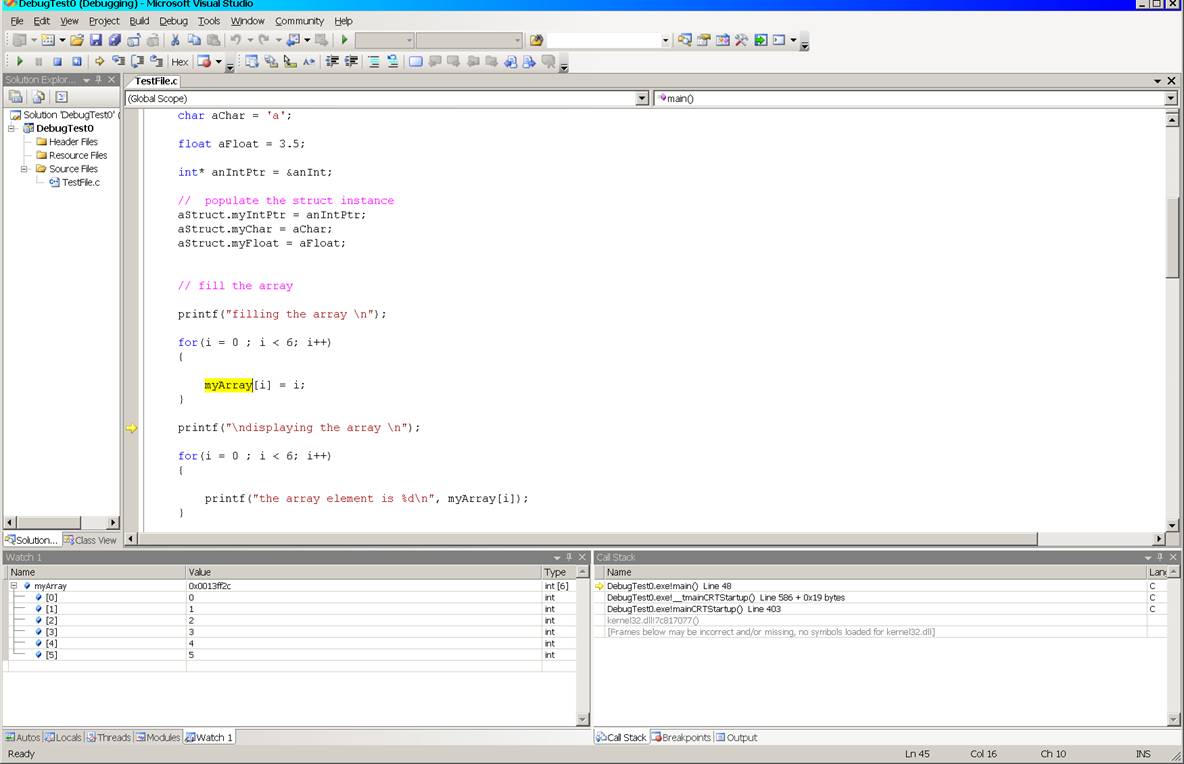
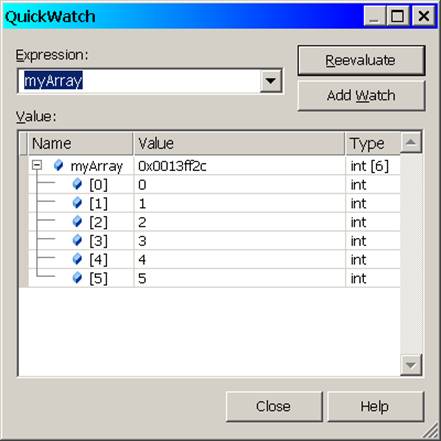
Observe in both the Watch and QuickWatch windows that the array is stored in memory at the hex address: 0x0013ff2c.
Using just the simple tools of breakpoints, Run to Cursor, QuickWatch, and Watch, we can learn quite a bit about what our program is doing, what values variables have, and how those values are changing.
Ok, so much for simple static behaviour. You have the program stopped at the point of interest…you’ve inspected the variables to see their values and now you want to watch what happens as the program runs. You can either Continue by selecting the Debug menu item by the same name or strike the F5 key once again. If you have added a watch, you can see the values of the variable that you are watching as they change.
Depending upon your program and where you have breakpoints set, your program will either run to completion (unless it crashes – more debugging) or until it encounters a breakpoint again.
So much for that.
If your program crashes, for example, or gives incorrect results you will probably want to try to find out where and why. Enter three very handy tools. These are Step Over, Step Into, and Step Out. These can be accessed either by making the desired selection from the Debug menu or by striking the keys F10, F11, or shift F11 respectively.
These three tools do pretty much what their names suggest. The typical debugging process proceeds as follows…
You have chosen a line of code on which to pause execution. At this point, you can single step through your code one instruction at a time.
Let’s work with the following code fragment from the program in Appendix A,
// increment each element of the array
printf("\nincrementing the array elements \n");
increment(myArray,6);
// print the array
printf("\ndisplaying the array \n");
display(myArray,6);
// print the struct
printf("\nprinting the struct\n");
Step Over: Executes/evaluates the line of code that the cursor is sitting on without single stepping into the code that comprises the body of the function.
Let’s assume that the cursor is sitting on the line
increment(myArray,6);
from above. Selecting Step Over from the Debug menu or striking F10 one time will evaluate the increment function for given arguments then advance to the line
printf("\ndisplaying the array \n");
If we Step Over the printf function, it too will be evaluated and the specified text printed to stdout and the cursor advances to the line
display(myArray,6);
Using Step Over we can single step through our entire program if we choose. If we encounter a function call for which we have the correct inputs but either get an incorrect value returned or we crash in the function, we need to explore the function more deeply. Now we want to step through the body of the function. First, we need to get there….
Step Into: Enters the block of code that comprises the body of a function that the cursor is sitting on. Thereafter, Stepping Over each of the lines of code within the function body will evaluate each as we just saw.
Let’s assume that the cursor is sitting on the line
display(myArray,6);
from above. Selecting Step Into from the Debug menu or striking F11 one time will cause the flow of control to switch to the display function. Specifically, this will be the first line of that function; the opening ‘{‘ in the following code fragment.
void display(int anArray[], int size)
{
// declare a working variable
int i = 0;
// print the array
for(i = 0 ; i < 6; i++)
{
printf(“the array element is %d\n”, anArray[i]);
}
return;
}Striking the F10 key will now successively evaluate each line of code in the function. Six iterations will be required to complete the evaluation of the for loop. With each iteration, the printf function will be evaluated thereby printing the text string and the control variable i will incremented, evaluated, and compared with 6. When the control variable is equal to 6, the cursor will move to the return statement; once more and it will move to the closing ‘}’. If we strike the F10 key one more time, flow of control will return to the line of code following the display function which we Stepped Into.
If we had pressed the F11 key when we were on the printf function, we would have then stepped into that function. There, we would step into the code body for that function. Probably not what we’d like to see.
If we have seen enough within the body of a function and wish to continue executing back in the original context, then we need to go back there…
Step Out: Exits the block of code that comprises the body of a function in which the cursor sitting.
Continuing the example, assume that we are in the display function and now wish to return to the main line code (or to the block of code enclosing the function we are in). Selecting Step Out from the Debug menu or striking shift F11 one time will cause the flow of control to switch to the printf function following the display function.
Armed with basic tools that we’ve covered here as, well as a little imagination and creativity, you should be able to effectively debug a substantial portion of the problems that you’ll encounter. The tools will only take you part of the way, however. To be able to effectively debug a piece of software or hardware, you must really understand what it is supposed to do and how it’s supposed to behave.
Most of the time, when a design has a problem, the incorrect results that it’s displaying are telling us in very loud strong terms what the problem is. The challenge is listening to it and understanding what it is saying. This is the hard part.
Play. Explore these simple tools. Try them on the program in the Appendix. Once you are comfortable with these, go on to some of the more powerful.
Here’s a simple exercise…start with the program in the Appendix. Find the following block of code,
printf("the int is %d\n", *(aStruct.myIntPtr));
printf("the char is %c\n", aStruct.myChar);
printf("the float is %f\n", aStruct.myFloat);
set the cursor in the first printf line and select Run to Cursor from the right mouse menu. Highlight aStruct and open a QuickWatch. Examine what you see. In particular, look at the first line in the struct, that containing the integer pointer….what is that pointer point to…
#include <stdio.h>
// declare a struct prototype
typedef struct
{
int* myIntPtr;
char myChar;
float myFloat;
} MyStruct;
int increment(int anArray[], int size);
void display(int anArray[], int size);
void main(void)
{
// declare and initialize some working variables
MyStruct aStruct;
int i = 0;
int myArray[6];
int anInt = 9;
char aChar = 'a';
float aFloat = 3.5;
int* anIntPtr = &anInt;
// populate the struct instance
aStruct.myIntPtr = anIntPtr;
aStruct.myChar = aChar;
aStruct.myFloat = aFloat;
// fill the array
printf("filling the array \n");
for(i = 0 ; i < 6; i++)
{
myArray[i] = i;
}
printf("\ndisplaying the array \n");
for(i = 0 ; i < 6; i++)
{
printf("the array element is %d\n", myArray[i]);
}
// increment each element of the array
printf("\nincrementing the array elements \n");
increment(myArray,6);
// print the array
printf("\ndisplaying the array \n");
display(myArray,6);
// print the struct
printf("\nprinting the struct\n");
printf("the int is %d\n", *(aStruct.myIntPtr));
printf("the char is %c\n", aStruct.myChar);
printf("the float is %f\n", aStruct.myFloat);
printf("done\n");
return;
}
int increment(int anArray[], int size)
{
// declare a working variable
int i = 0;
for(i = 0 ; i < 6; i++)
{
anArray[i] = i+1;
}
return 0;
}
void display(int anArray[], int size)
{
// declare a working variable
int i = 0;
// print the array
for(i = 0 ; i < 6; i++)
{
printf("the array element is %d\n", anArray[i]);
}
return;
}